S&P 500 struggles for direction as investor await inflation data
The short answer is that the Bank of Japan (BoJ) is letting the market set yields. For years, the BoJ has run an extremely loose monetary policy, including capping yields at extremely low levels and negative interest rates.
Limited economic growth and disinflation made such a policy possible. However, inflationary pressures and a weak yen have prompted the BoJ to shift its stance. Policy normalization started in 2023, when the BoJ allowed 10-year JGB yields to rise above 1% for the first time in over a decade.
Today, 10-year and 30-year bond yields are 1.60% and 3.20%, respectively. They better reflect expectations of continued tighter monetary policy as inflation lingers above the BoJ’s 2% target. Moreover, the yen’s persistent weakness, exacerbated by low interest rates versus the U.S., forces the BOJ to encourage higher interest rates to stabilize the currency.
Japan’s improving economy and higher inflation lead many to anticipate that the BoJ may entirely abandon interest rate caps and negative interest rates. Additionally, with public debt exceeding 250% of GDP, concerns about long-term fiscal sustainability are percolating. Consequently, these factors add to the upward pressure on yields.
The risk to US and global stock and bond investors is that higher Japanese yields and a stronger yen force a reversal of the yen carry trade. If you recall, we saw what that may look like in August 2024.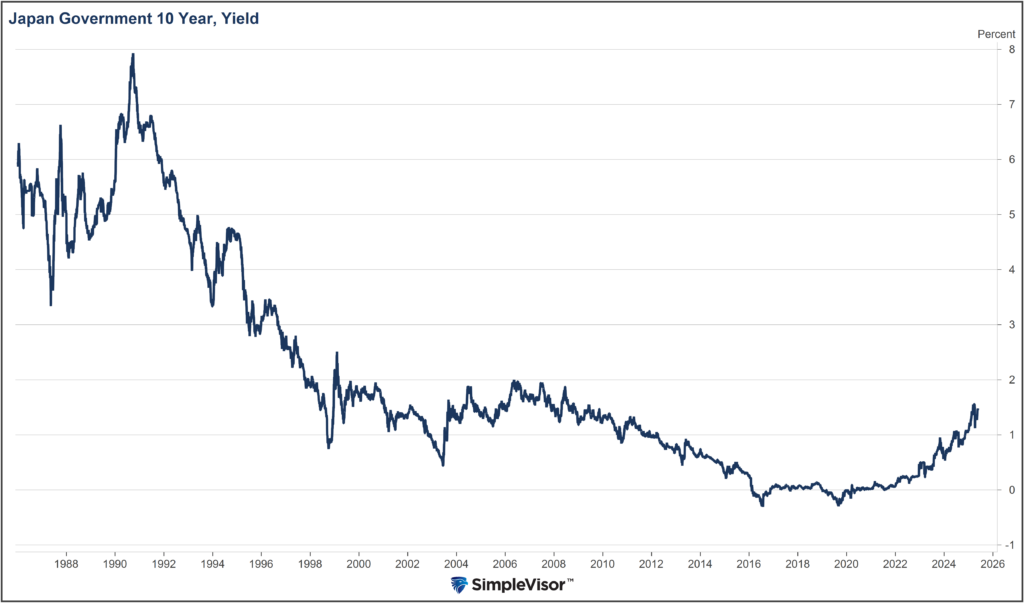
What To Watch Today
Earnings
- No notable earnings reports
Economy

Market Trading Update
Yesterday, we discussed the backdrop to bonds. We also added to our longer-duration bond holdings in portfolios due to the deep oversold condition. However, there is a rather large and glaring mistake between the current narrative that “deficts” are causing yields to rise.
The problem is that we have been running deficits for more than 40 years, and deficits today are lower than they were five years ago. But therein lies the key to why rates are currently higher than they were in 2020.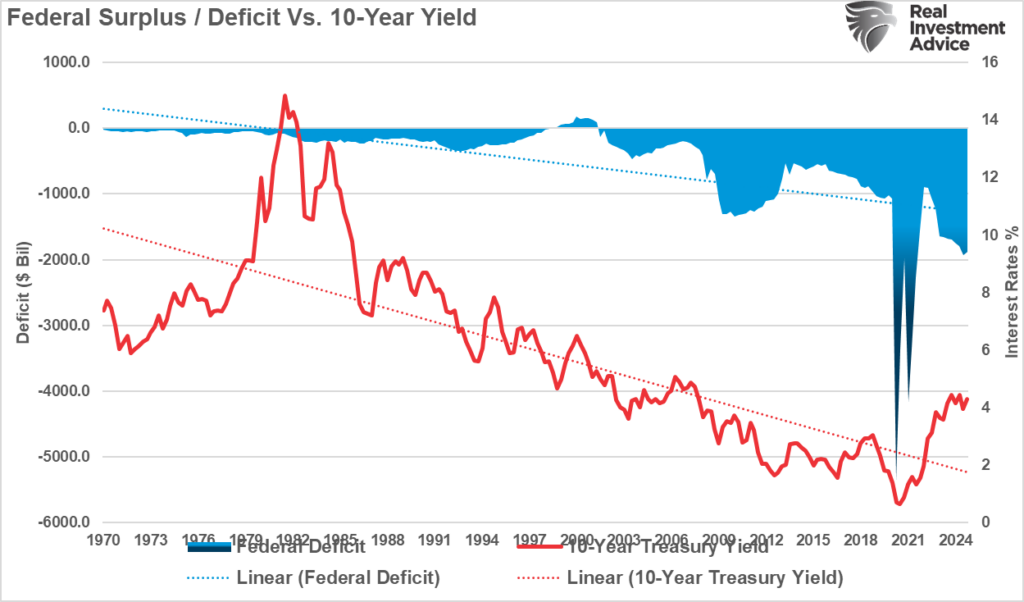
As shown, the correlation between deficits and rates makes sense. The reduction in the deficit since 2020 has been a function of stronger growth and less debt issuance. As deficits decline, and economic growth strengthens, borrowers are able to ask for more yield. Conversely, when economic growth is declining sharply, and deficits increase due to increased debt issuance, yields fall. You can see this correlation in the chart below.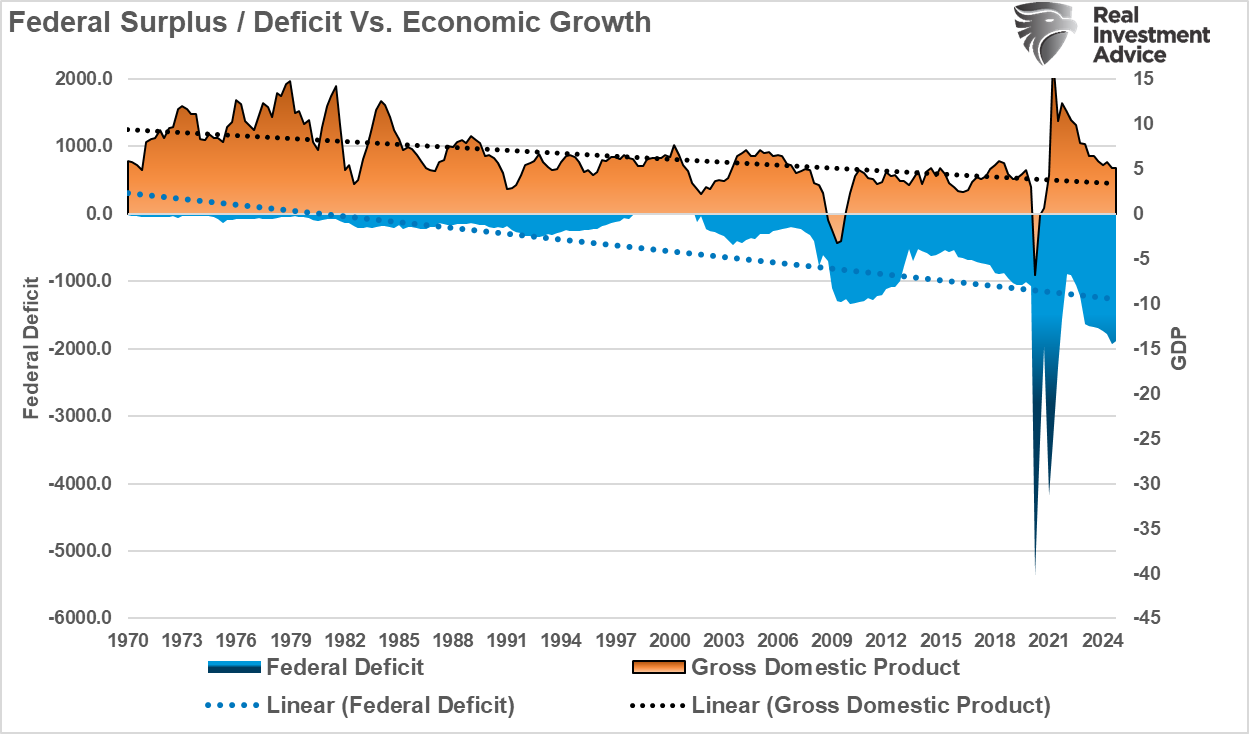
In the short term, narratives drive yields along with massive short-positioning and NO central bank interventions. When the Federal Reserve and the Treasury begin to intervene to control the rise in yields, which they will do to protect financial stability, the reversal in yields will be rather sharp. However, that could be months or quarters away.
In the meantime, we will have to take advantage of swings in the bond market to increase returns from our fixed income holdings. Currently, as shown, longer-duration bonds are deeply oversold and due for a reflexive rally. What causes that rally? Who knows, but some headline will emerge suggesting lower inflation or slower economic growth, and yields will respond accordingly.
As shown, TLT is currently trading 3-standard deviations below the mean which suggest a rally to 88 (the mean) is possible which is a decent short-term trade setup.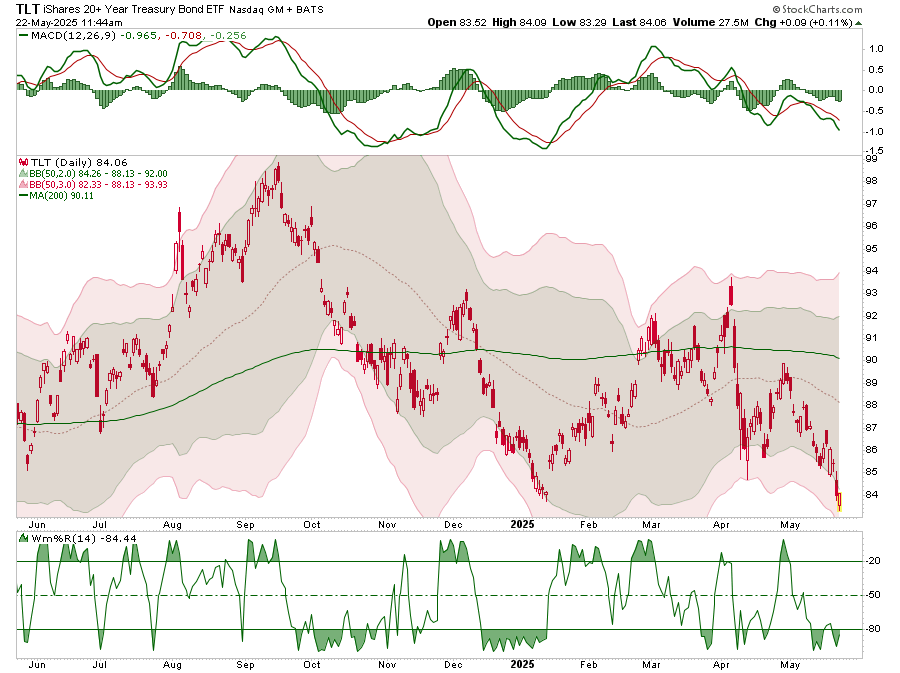
In the meantime, we get to clip a 4.5% coupon while we wait for a short-term gain.
The 20-Year Auction Was Not As Bad As Its Headlines
- The Terrifying Implications From Today’s Dismal 20-Year Auction- Twitter/X
- The U.S. just held a 20-year Treasury bond auction, and it went terribly- Twitter/X
- 20-Year Treasury Auction Goes Badly – Barrons
Social and traditional media made Wednesday’s 20-year auction out as one of the worst Treasury auctions ever. We, however, would categorize it as tepid. Let’s review a few facts and let you make up your own mind.
For starters, the 20-year Treasury is an orphan bond of sorts. The demand and supply of 20-year bonds are not as large as the more liquid 2-year, 3-year, 5-year, 10-year, and 30-year bonds. As such, the reduced liquidity and smaller auction sizes tend to lead to more volatile auction results.
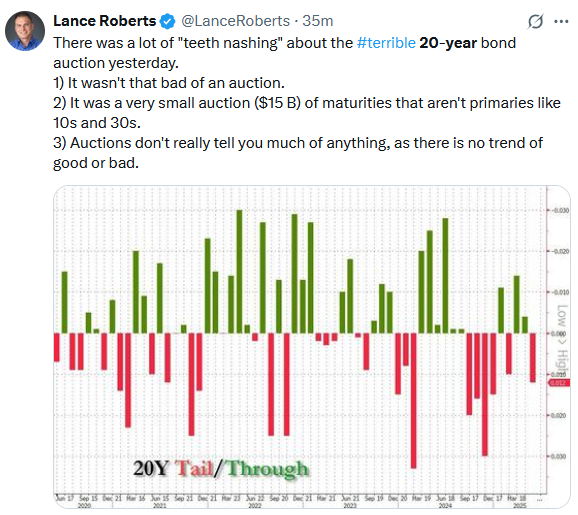
The Tweet of the Day shows that the “tail” on the auction was 1.2 bps. Thus, the auction rate was 1.2 bps higher than where it was trading prior to the auction. The graph shows that a +/- 1bps result is somewhat normal.
Consider that indirect bidders, predominantly central banks, took 88% of the auction. Direct bidders, the backstop for auctions, took a relatively low 8%. In other words, the auction did not need the largest banks to support it. The graph below shows that the direct bidder allotment was on the low side of recent auctions.
Indeed, the auction could have been better, but the media exaggerates the outcome to feed their current bearish bond narrative.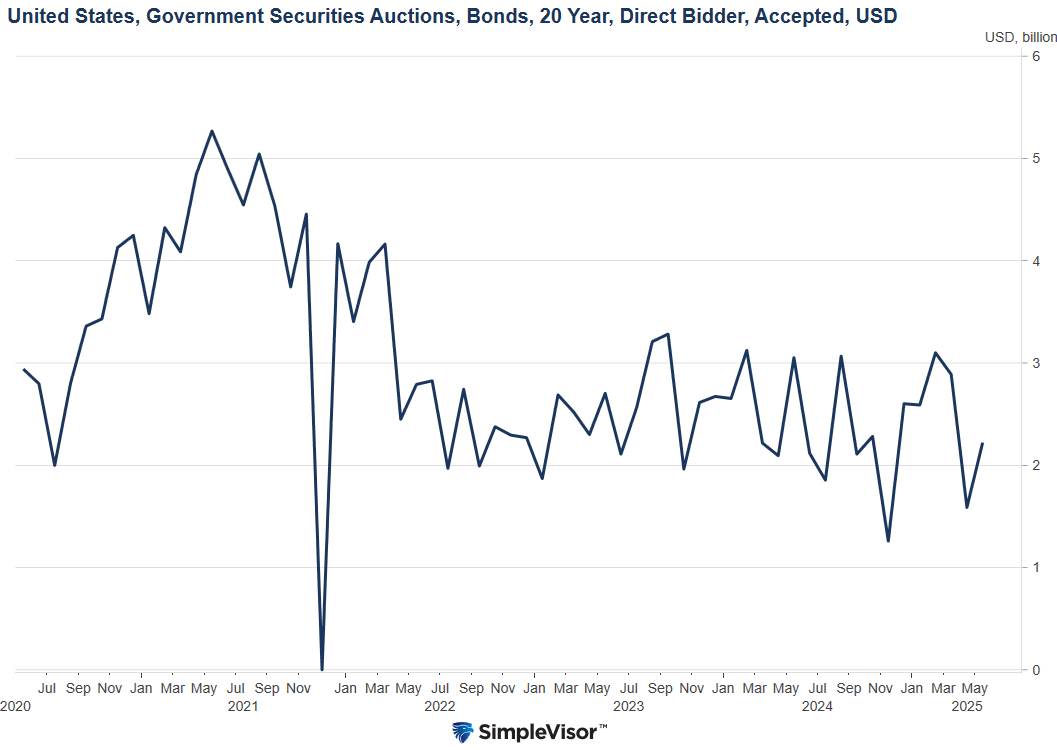
Tweet of the Day
