Interactive Brokers shares jump as it secures spot in S&P 500

Introduction & Market Context
Alpine Income Property Trust (NYSE:PINE) released its first quarter 2025 investor presentation, highlighting continued growth in funds from operations (FFO) and adjusted funds from operations (AFFO), along with strategic portfolio management initiatives. The real estate investment trust, which focuses on single-tenant net lease retail properties, reported a 7.3% year-over-year increase in FFO per share and a 4.8% increase in AFFO per share for Q1 2025.
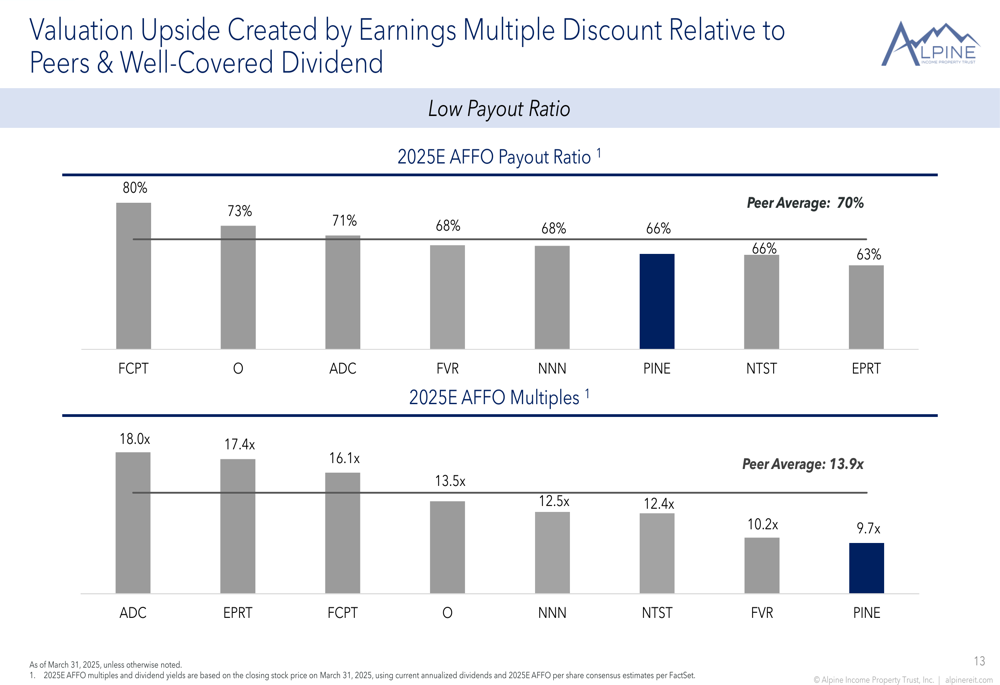
The company’s stock closed at $16.28 on April 24, 2025, with an aftermarket gain of 1.6%, trading at approximately 9.7x its projected 2025 AFFO - a discount to the peer average of 13.9x, suggesting potential valuation upside according to the company.
Quarterly Performance Highlights
Alpine’s Q1 2025 results demonstrated the company’s continued focus on active asset management and strategic capital allocation. The REIT reported FFO and AFFO growth while expanding its portfolio through targeted acquisitions and divestitures.
As shown in the following quarterly highlights slide, the company closed seven investments totaling $79.2 million at a weighted average initial cash yield of 9.0%, while selling three properties for $11.7 million at a weighted average cash yield of 9.1%. Additionally, Alpine originated or upsized four loans totaling $39.5 million with a weighted average initial cash yield of 9.5%, and repurchased 273,825 common shares for $4.5 million.
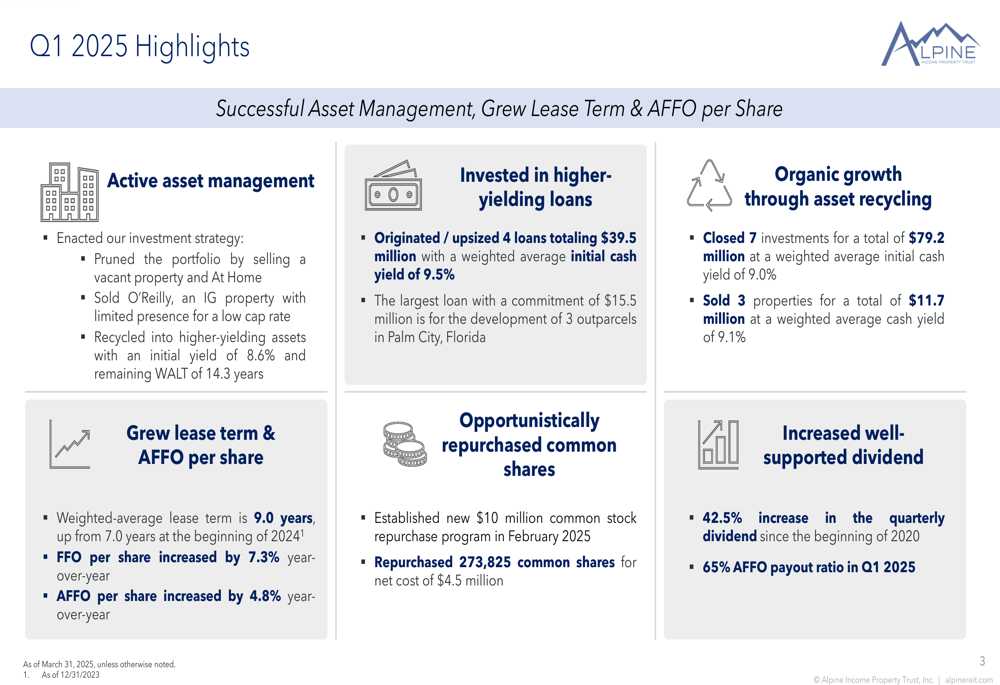
This performance builds on the momentum seen in previous quarters. In Q3 2024, the company had reported strong results with FFO per diluted share up 22% and AFFO per diluted share up 16%, while raising its quarterly dividend and full-year earnings guidance.
Portfolio Quality and Tenant Composition
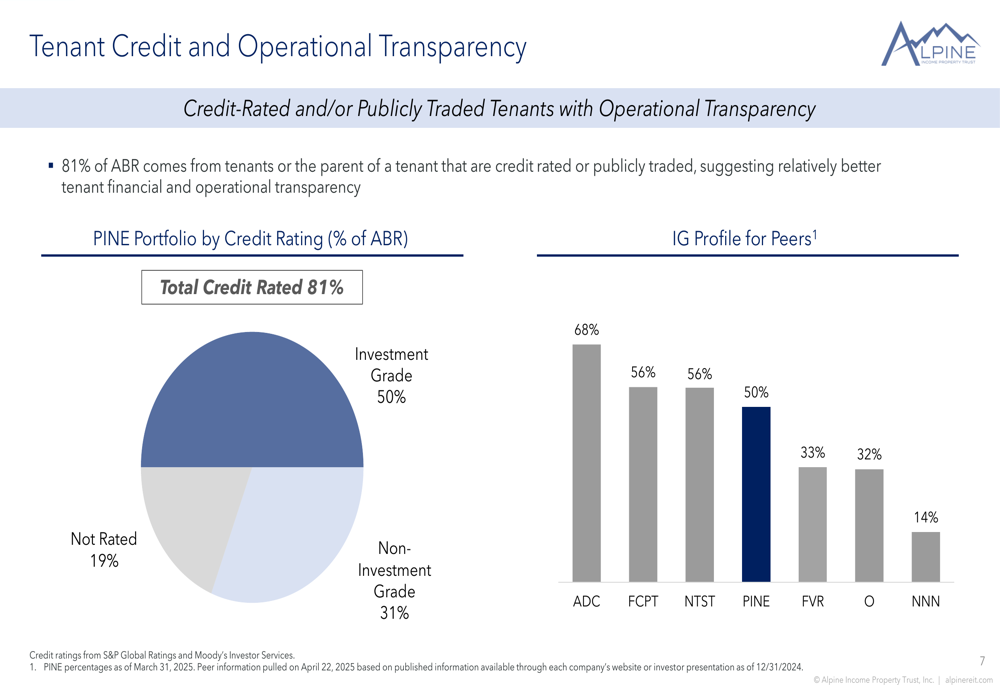
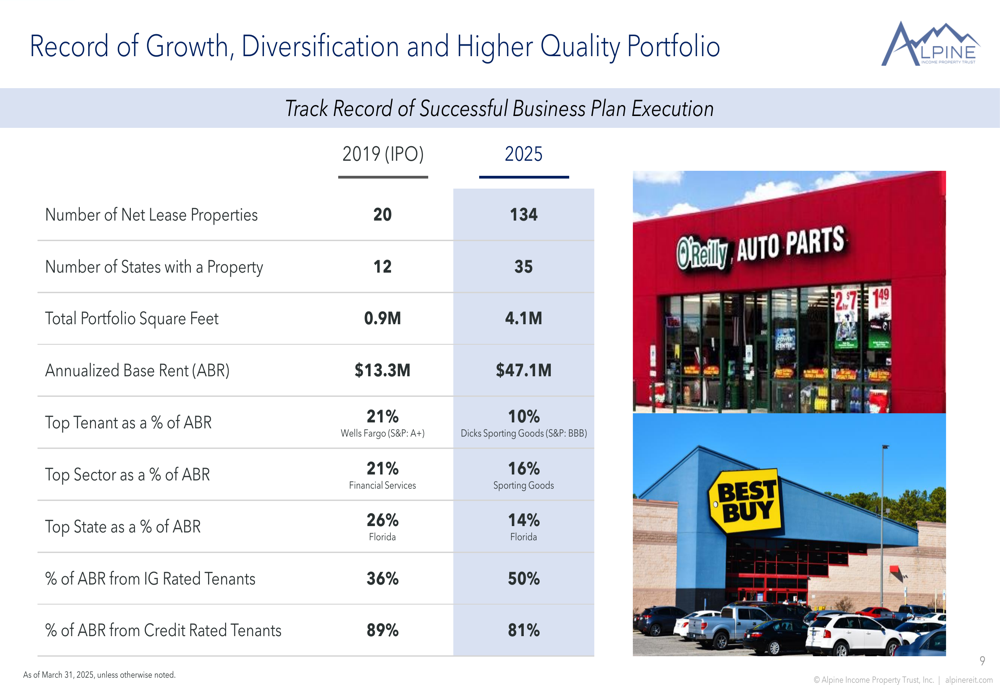
Alpine’s portfolio has grown significantly since its IPO in 2019, expanding from 20 properties in 12 states to 134 properties across 35 states. The company maintains a high-quality tenant roster with 50% of its annualized base rent (ABR) coming from investment grade-rated tenants, and 81% from tenants that are either credit rated or publicly traded.
The following slide provides a comprehensive overview of the company’s retail net lease portfolio, highlighting key statistics and top tenants:
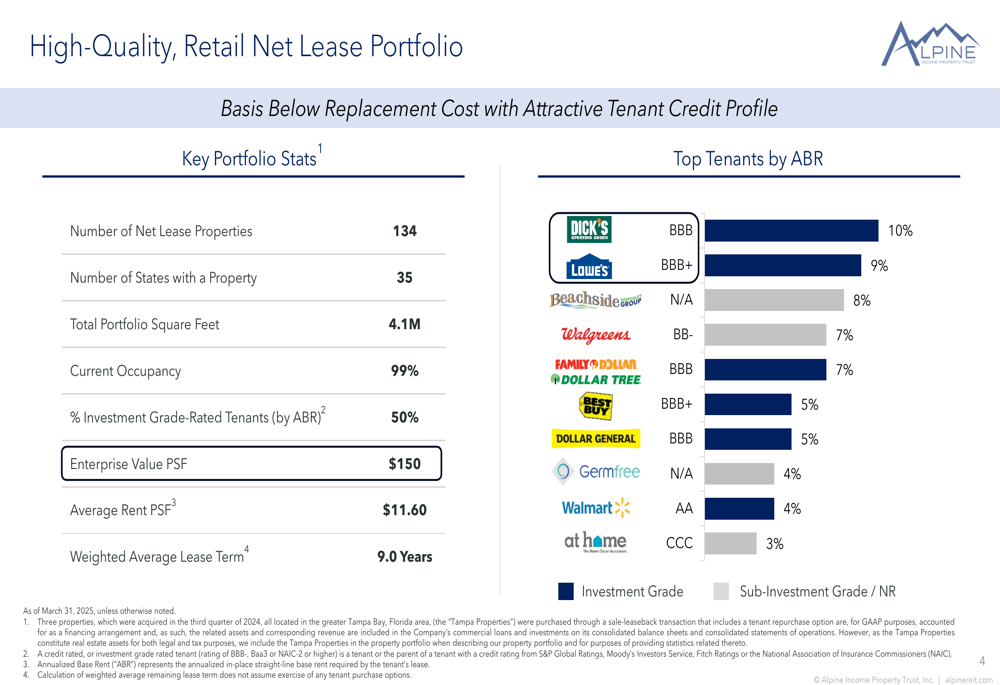
DICK’S Sporting Goods represents the largest tenant exposure at 10% of ABR, followed by Lowe’s (NYSE:LOW) at 9% and Beachside Group Hospitality at 8%. The portfolio maintains a 99% occupancy rate with a weighted average lease term of 9.0 years, up from 7.0 years at the beginning of 2024.
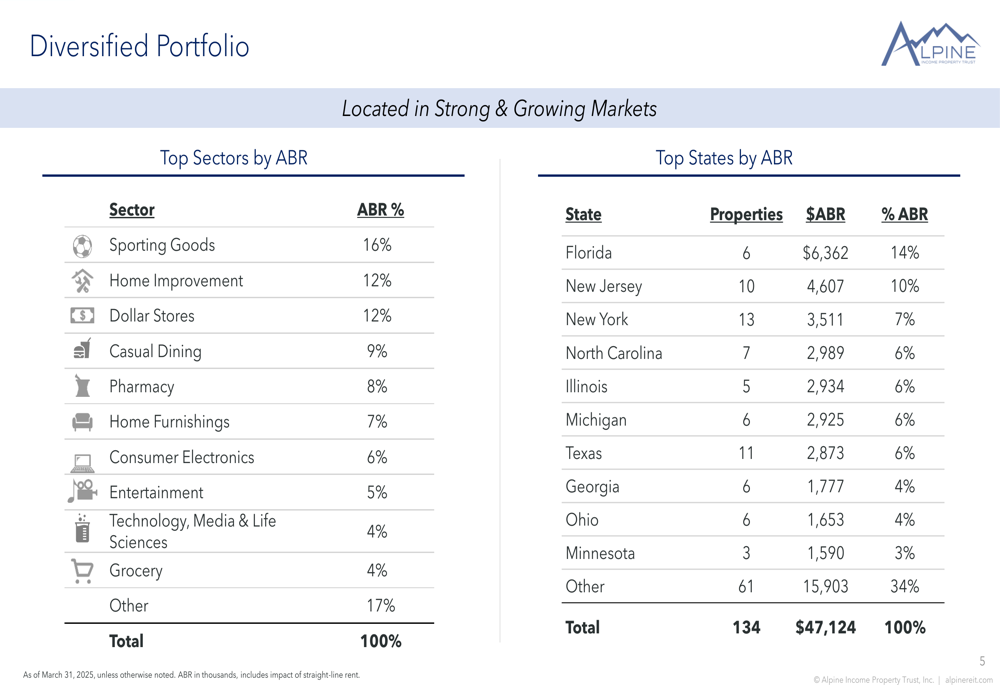
The company’s portfolio is also well-diversified across sectors and states, with sporting goods (16%), home improvement (12%), and dollar stores (12%) representing the largest sector exposures. Geographically, Florida leads with 14% of ABR, followed by New Jersey (10%) and New York (7%).
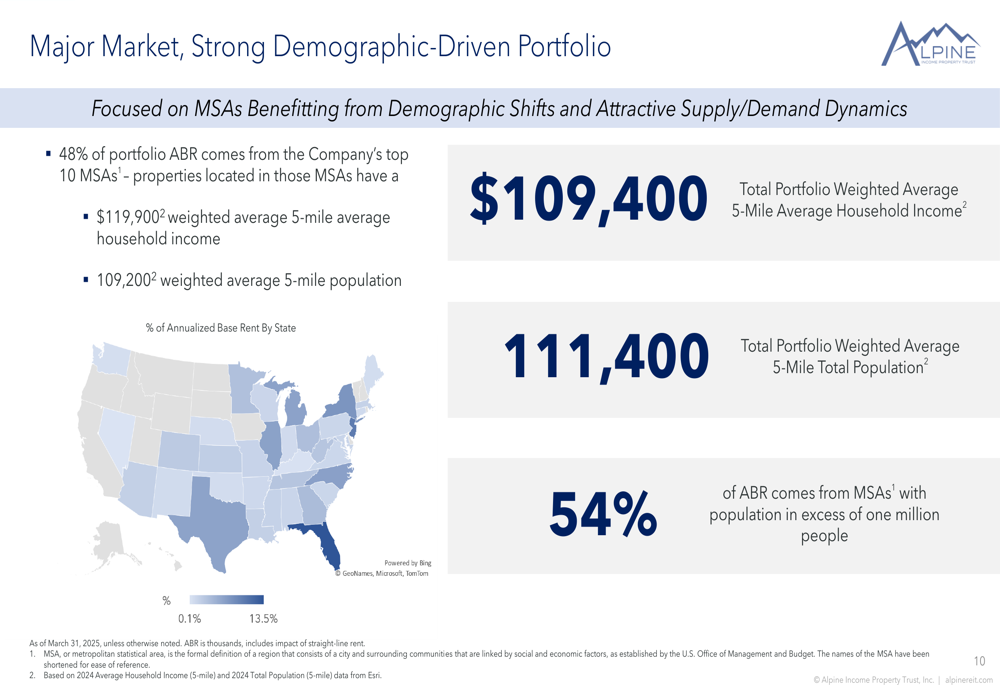
Alpine has strategically positioned its portfolio in strong demographic areas, with 54% of ABR coming from metropolitan statistical areas (MSAs) with populations exceeding one million people. The weighted average 5-mile average household income around its properties stands at $109,400, reflecting the company’s focus on quality locations.
Financial Position and Dividend Growth
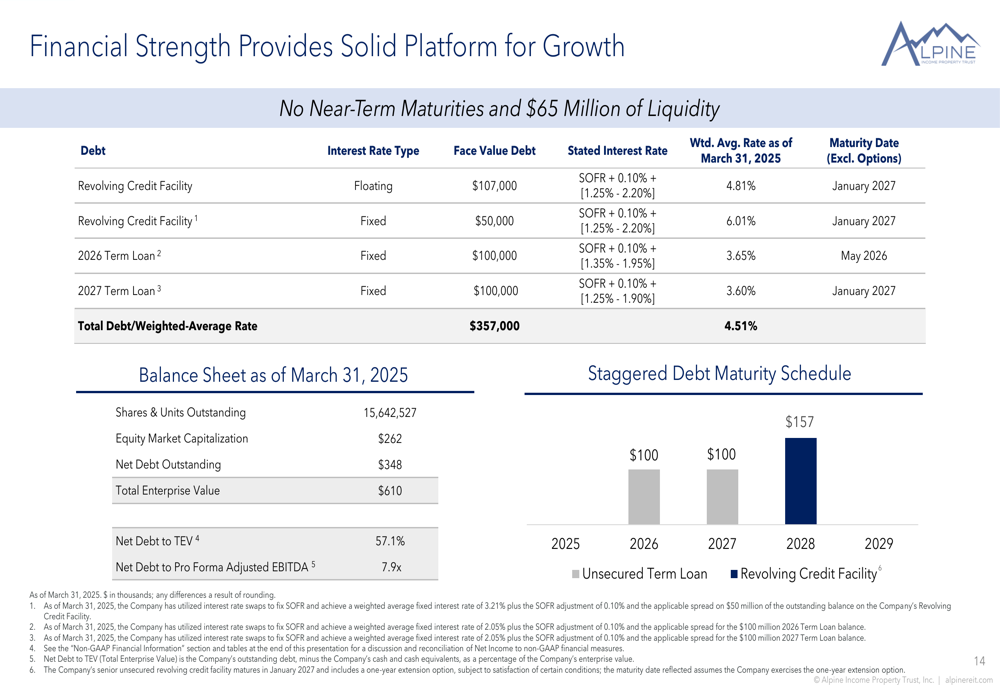
Alpine reported a solid financial position with $65 million of liquidity and no near-term debt maturities. The company’s total debt stands at $357 million with a weighted average interest rate of 4.51%. Net debt to total enterprise value is 57.1%, while net debt to pro forma adjusted EBITDA is 7.9x.
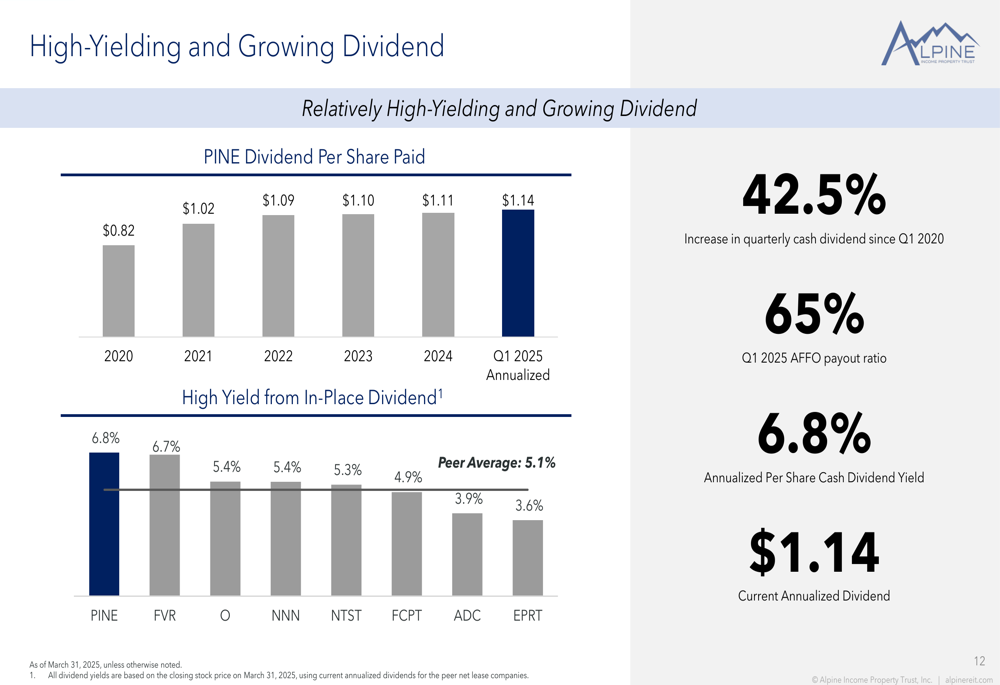
One of Alpine’s key strengths is its growing dividend, which has increased by 42.5% since Q1 2020. The current annualized dividend of $1.14 per share represents a 6.8% yield, among the highest in its peer group. The Q1 2025 AFFO payout ratio of 65% suggests the dividend is well-covered and potentially has room for further growth.
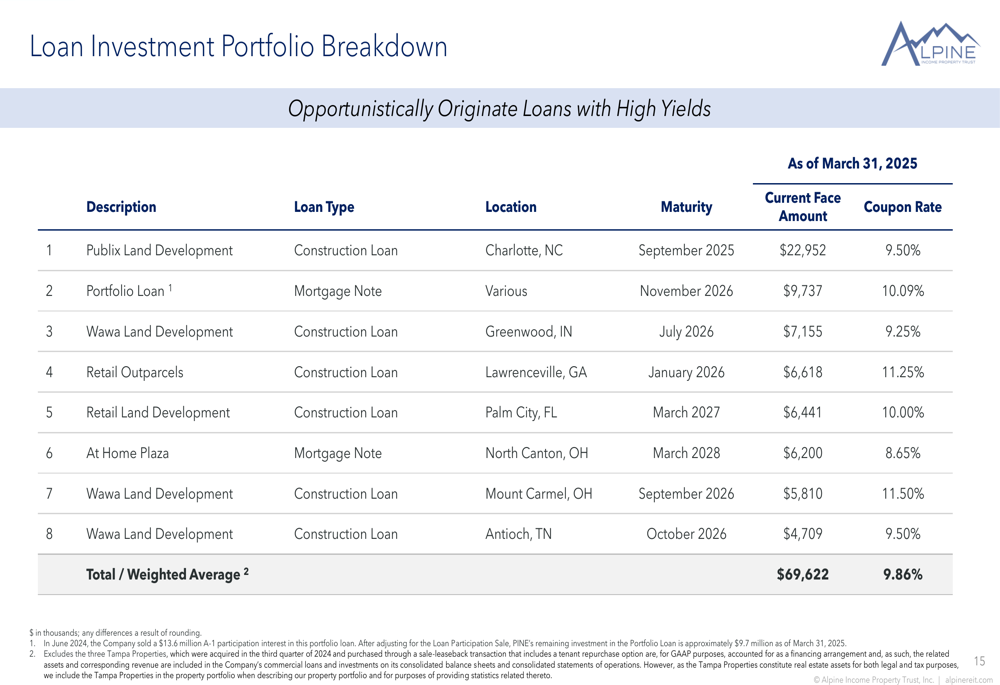
The company has also expanded its loan investment portfolio to $69.6 million with a weighted average yield of 9.86%, providing an additional high-yielding income stream. These loans are primarily focused on retail development projects and are secured by real estate.
Valuation and Peer Comparison
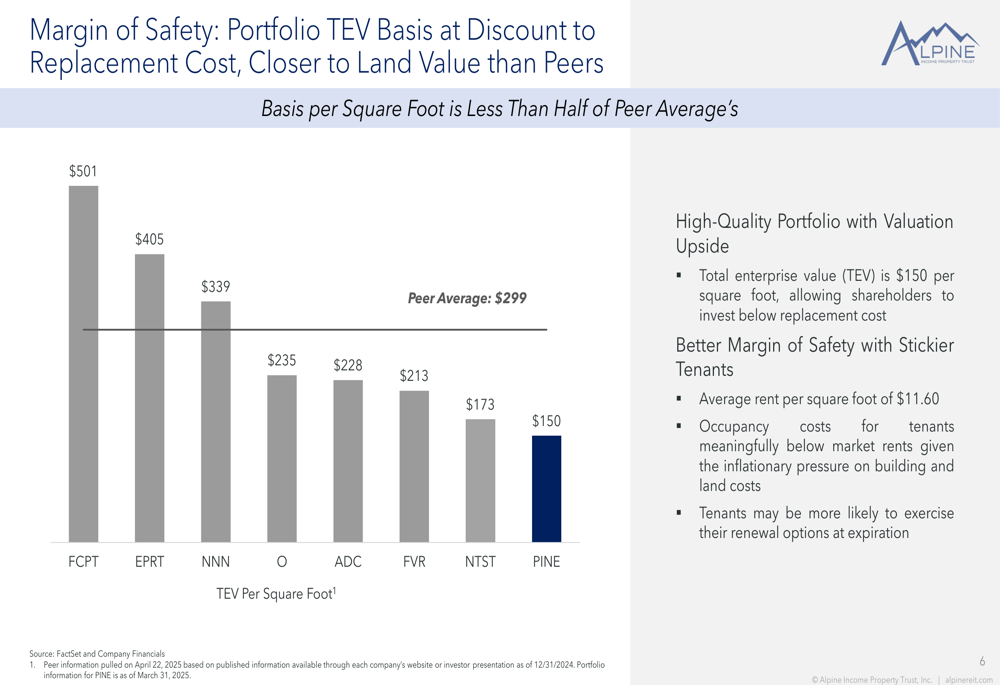
Alpine’s presentation highlights several metrics suggesting the company may be undervalued relative to its peers. Its total enterprise value per square foot of $150 is significantly below the peer average of $299, potentially indicating a margin of safety in the current valuation.
Similarly, the company’s 2025 estimated AFFO multiple of 9.7x is below the peer average of 13.9x, while its dividend yield of 6.8% is among the highest in the peer group. The AFFO payout ratio of 66% is also below the peer average of 70%, suggesting a more conservative dividend policy.
Alpine also compares favorably to peers in terms of tenant credit quality, with 50% of ABR coming from investment grade-rated tenants. This positions the company in the upper half of its peer group for this metric, behind only Agree Realty (NYSE:ADC) (68%), Four Corners Property (NYSE:FCPT) Trust (56%), and Netstreit (56%).
Forward-Looking Statements
Looking ahead, Alpine appears well-positioned to continue its growth trajectory through its balanced investment strategy. The company employs what it calls a "barbell property focus," balancing investment grade tenants for stability with higher-yielding properties for growth.
The minimal lease expirations through 2026 (only 4% of leases expire in 2025-2026) provide near-term stability in cash flows, while the weighted average lease term of 9.0 years offers long-term visibility. The company’s loan portfolio provides additional diversification and higher yields, complementing the core net lease strategy.
Alpine’s focus on retail net lease properties, combined with its active asset management approach and strong tenant credit profile, positions it to potentially continue delivering solid returns for shareholders, particularly if the valuation gap with peers narrows over time.
The company’s presentation emphasizes its transformation since its 2019 IPO into a larger, more diversified, and higher-quality portfolio, suggesting management intends to continue this strategic evolution in the coming years.
Full presentation:
This article was generated with the support of AI and reviewed by an editor. For more information see our T&C.