Oracle stock falls after report reveals thin margins in AI cloud business

Introduction & Market Context
ASML Holding (AS:ASML) NV (NASDAQ:ASML) reported its first quarter 2025 results on April 16, 2025, posting solid performance with €7.7 billion in total net sales and €2.4 billion in net income. The Dutch semiconductor equipment manufacturer maintained its full-year 2025 revenue guidance between €30 billion and €35 billion, consistent with the outlook provided during its Q3 2024 earnings call.
The company continues to navigate a semiconductor market that shows mixed signals, with artificial intelligence applications driving growth while traditional segments like smartphones and PCs experience a slower recovery. This dynamic has been influencing ASML’s performance and outlook since late 2024, when the company first adjusted its expectations for 2025.
Quarterly Performance Highlights
ASML delivered a strong first quarter with total net sales of €7.7 billion, including €5.7 billion in net system sales and €2.0 billion in Installed Base Management sales. The company achieved a gross margin of 54.0%, operating margin of 35.4%, and net income as a percentage of sales of 30.4%, demonstrating solid profitability metrics.
As shown in the following quarterly results summary:
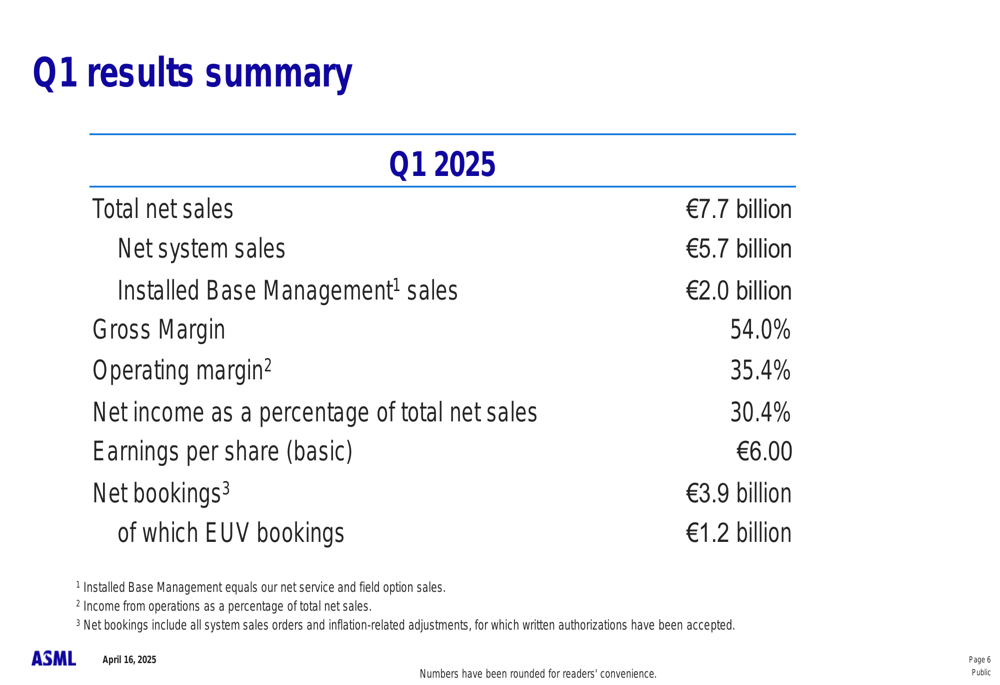
Earnings per share reached €6.00 for the quarter, while net bookings came in at €3.9 billion, including €1.2 billion in EUV bookings. The company sold 77 lithography systems during the quarter, a decrease from the 132 units sold in Q4 2024, reflecting typical seasonal patterns and the ongoing cautious approach from customers.
Technology and End-Market Analysis
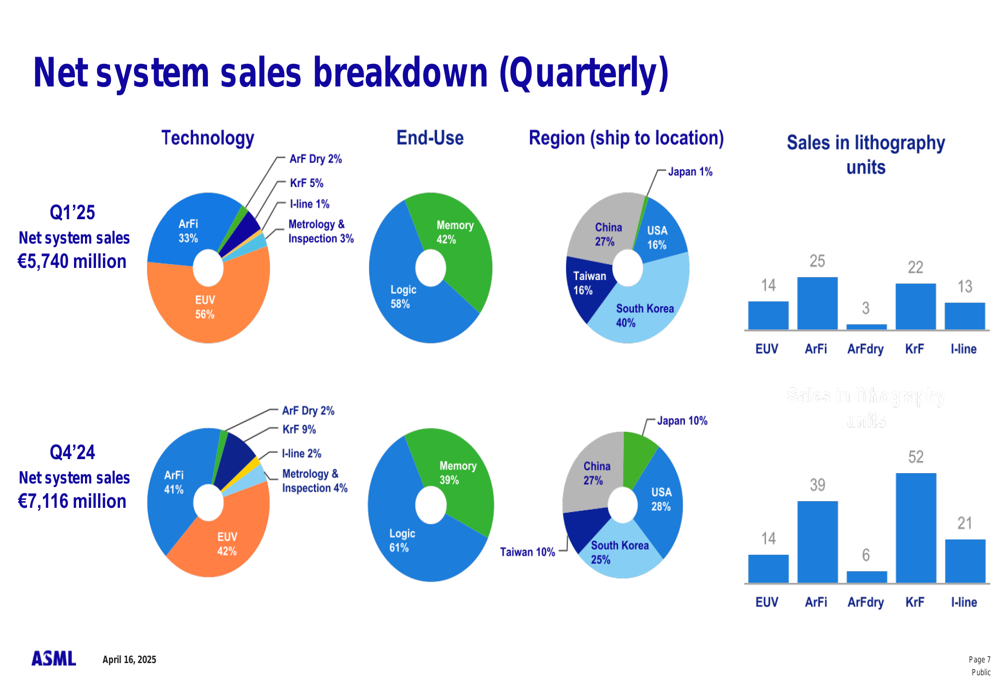
ASML’s Q1 2025 system sales showed a notable shift in technology mix, with EUV systems accounting for 56% of net system sales, up from 42% in the previous quarter. This indicates the continued importance of EUV technology in advanced semiconductor manufacturing.
The end-use breakdown reveals a slight shift toward memory applications, which represented 42% of system sales in Q1 2025 compared to 39% in Q4 2024, while logic accounted for 58%. This trend aligns with increasing demand for high-bandwidth memory and other memory solutions required for AI applications.
The following chart illustrates the breakdown of net system sales by technology, end-use, and region for Q1 2025 compared to Q4 2024:
Regional Sales Distribution
A significant shift in regional sales distribution occurred in Q1 2025, with South Korea becoming the largest market at 40% of net system sales, up from 25% in Q4 2024. This increase likely reflects major investments by Korean memory manufacturers.
China represented 27% of net system sales in Q1, unchanged from Q4 2024, despite previous indications that China sales would normalize to around 20% of total revenue. The United States accounted for 16% of sales (down from 28%), Taiwan 16% (up from 10%), and Japan 1% (down from 10%).
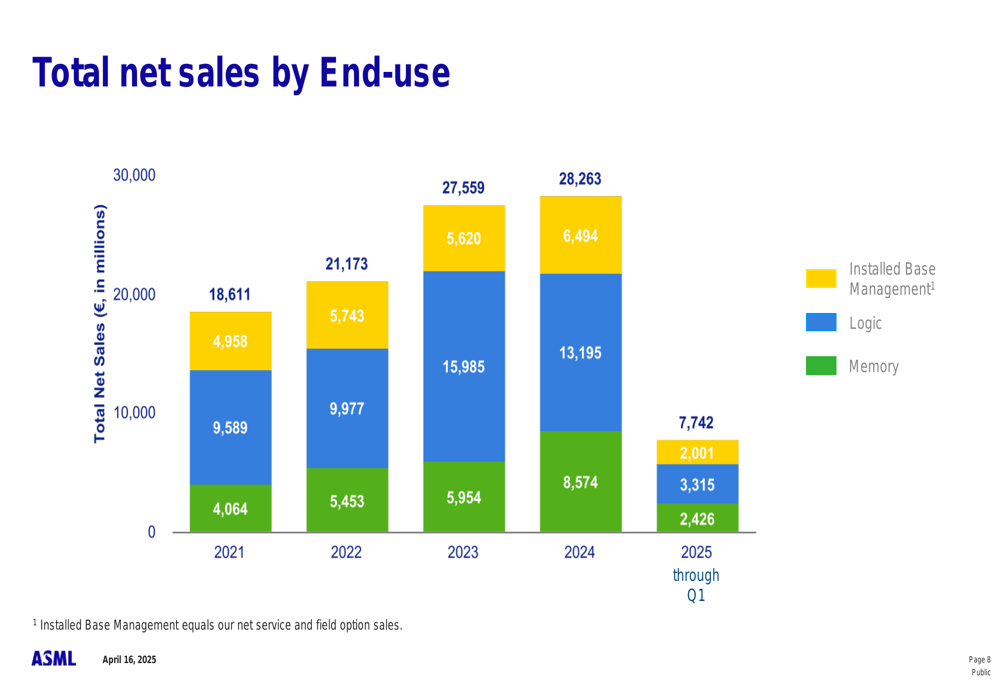
The historical trend of total net sales by end-use from 2021 through Q1 2025 provides additional context for understanding ASML’s business evolution:
Order Trends and Backlog
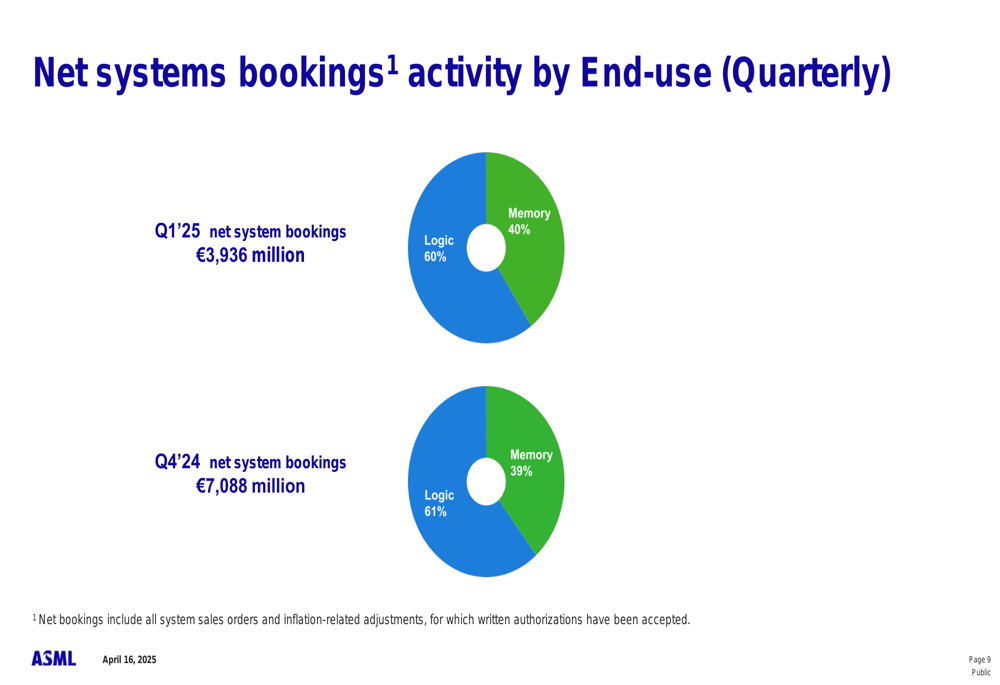
Net system bookings in Q1 2025 came in at €3.9 billion, significantly lower than the €7.1 billion reported in Q4 2024. The breakdown between logic and memory remained relatively stable, with logic accounting for 60% of bookings in Q1 2025 compared to 61% in Q4 2024.
The following chart shows the net systems bookings by end-use for Q1 2025 compared to Q4 2024:
Despite the lower quarterly bookings, ASML maintained a substantial backlog, which provides visibility for future quarters. However, this trend of lower bookings aligns with the cautious outlook that ASML has been signaling since late 2024.
Shareholder Returns
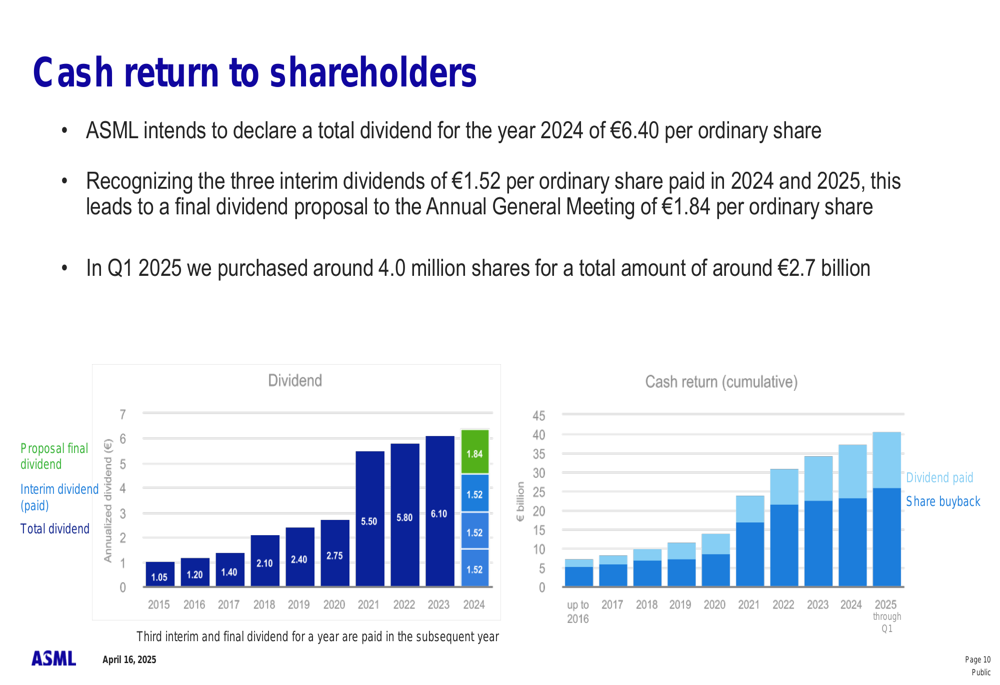
ASML continues to prioritize returning cash to shareholders. The company intends to declare a total dividend for 2024 of €6.40 per ordinary share. After paying three interim dividends of €1.52 per share, ASML is proposing a final dividend of €1.84 per share, subject to approval at the Annual General Meeting.
In addition to dividends, ASML actively repurchased shares in Q1 2025, buying approximately 4.0 million shares for a total of around €2.7 billion. This significant buyback activity contributed to the reduction in cash and cash equivalents from €12.7 billion at the end of Q4 2024 to €9.1 billion at the end of Q1 2025.
The following chart illustrates ASML’s history of cash returns to shareholders:
Outlook and Guidance
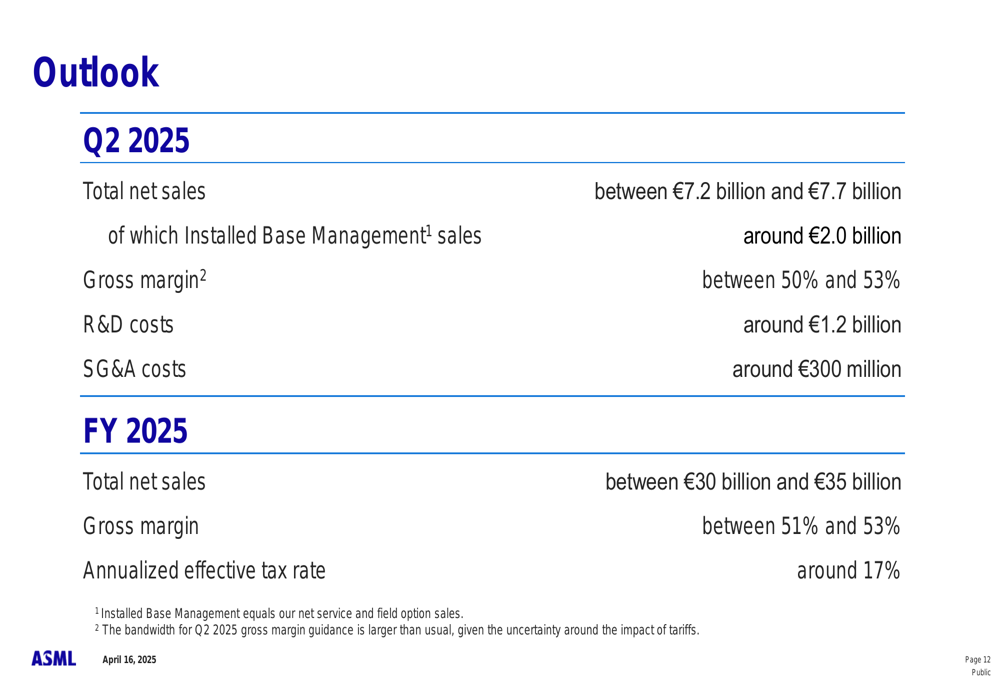
For Q2 2025, ASML expects total net sales between €7.2 billion and €7.7 billion, with Installed Base Management sales of around €2.0 billion. The gross margin is projected to be between 50% and 53%, slightly lower than Q1 due to product mix effects.
Looking at the full year 2025, ASML maintains its revenue guidance between €30 billion and €35 billion, with a gross margin between 51% and 53%. This outlook is consistent with the revised expectations provided during the Q3 2024 earnings call, reflecting the company’s assessment of ongoing market dynamics.
The following slide details ASML’s outlook for Q2 and full-year 2025:
Long-term Industry Perspective
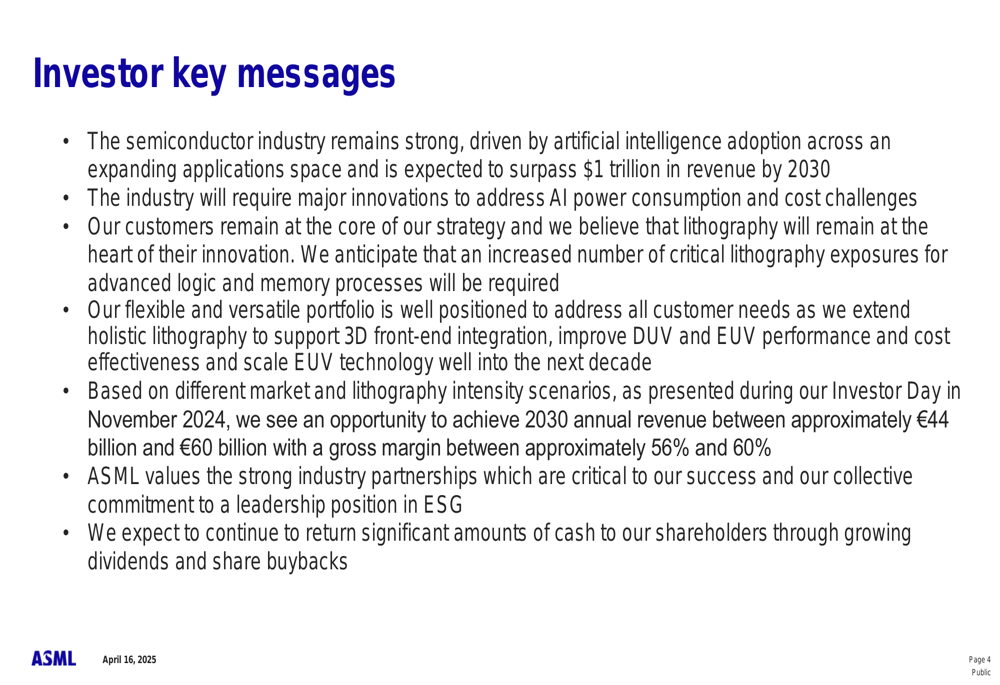
Despite near-term caution, ASML remains optimistic about the semiconductor industry’s long-term trajectory. The company expects the industry to surpass $1 trillion in revenue by 2030, driven primarily by artificial intelligence adoption.
Based on different market scenarios, ASML sees an opportunity to achieve 2030 annual revenue between approximately €44 billion and €60 billion with a gross margin between approximately 56% and 60%. This long-term outlook reflects the company’s confidence in the structural growth drivers of the semiconductor industry, including AI, energy transition, and electrification.
As highlighted in the investor key messages:
Financial Position
ASML maintains a strong financial position despite the significant cash returned to shareholders. The company’s consolidated statements of operations show consistent profitability across recent quarters, with Q1 2025 net income as a percentage of sales reaching 30.4%, the highest level in the past five quarters.
The company’s balance sheet remains robust, with total assets of €45.5 billion as of Q1 2025, down slightly from €48.6 billion at the end of Q4 2024, primarily due to the reduction in cash from share buybacks.
Conclusion
ASML’s Q1 2025 results demonstrate solid performance with strong margins, even as the company navigates a complex market environment. The shifting regional and end-market mix, particularly the increased importance of South Korea and memory applications, reflects the evolving dynamics of the semiconductor industry.
While maintaining a cautious outlook for 2025, consistent with previous guidance, ASML continues to invest in its long-term capabilities and return significant cash to shareholders. The company’s strategic positioning in critical semiconductor manufacturing technologies, particularly EUV lithography, supports its confidence in long-term growth opportunities despite near-term market uncertainties.
Full presentation:
This article was generated with the support of AI and reviewed by an editor. For more information see our T&C.