Capstone Holding Corp. lowers convertible note conversion price to $1.00

Introduction & Market Context
Autodesk Inc (NASDAQ:ADSK) reported its first-quarter fiscal 2026 earnings on May 22, 2025, delivering strong financial results that exceeded market expectations. The design software giant saw its shares jump 5.43% in after-hours trading to $311.01, building on a modest 0.65% gain during the regular session.
The positive market reaction came as Autodesk reported double-digit growth across key metrics and maintained its full-year guidance despite macroeconomic uncertainties. The company’s performance demonstrates continued momentum following its strong fourth-quarter results from the previous fiscal year.
Quarterly Performance Highlights
Autodesk reported impressive financial results for Q1 FY26, with revenue reaching $1.633 billion, up 15% year-over-year. Billings showed even stronger growth at $1.434 billion, representing a 29% increase compared to the same period last year.
As shown in the following financial summary:
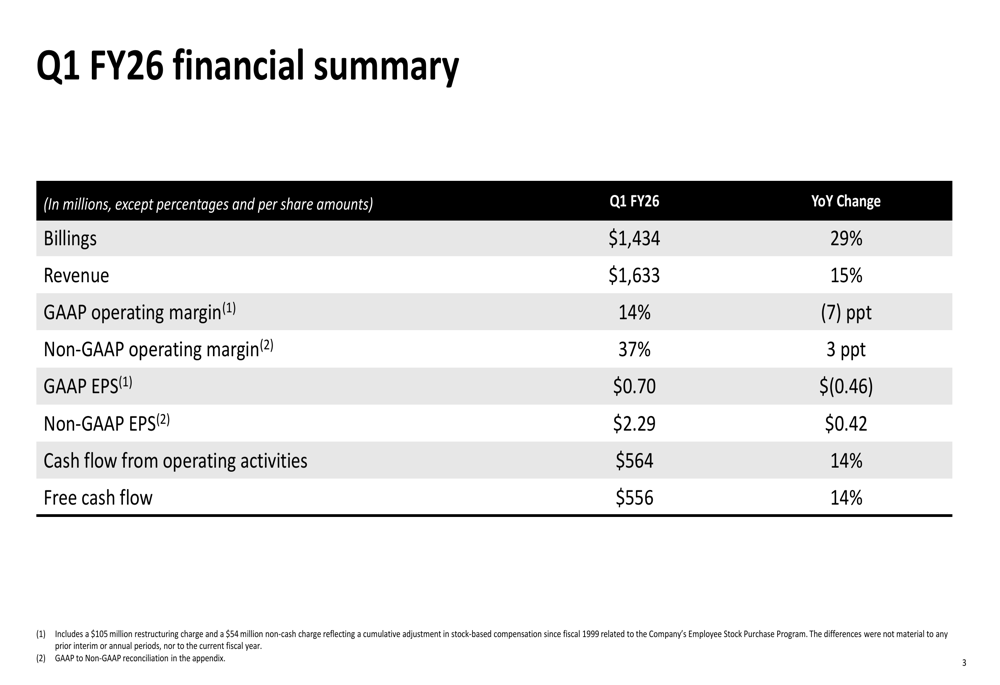
The company’s non-GAAP operating margin improved by 3 percentage points to 37%, while non-GAAP earnings per share increased by $0.42 to $2.29. Cash flow from operating activities grew 14% to $564 million, with free cash flow also up 14% to $556 million.
It’s worth noting that GAAP operating margin decreased by 7 percentage points to 14%, and GAAP EPS fell by $0.46 to $0.70, primarily due to a one-time non-cash charge of $54 million related to the company’s Employee Stock Purchase Program (ESPP).
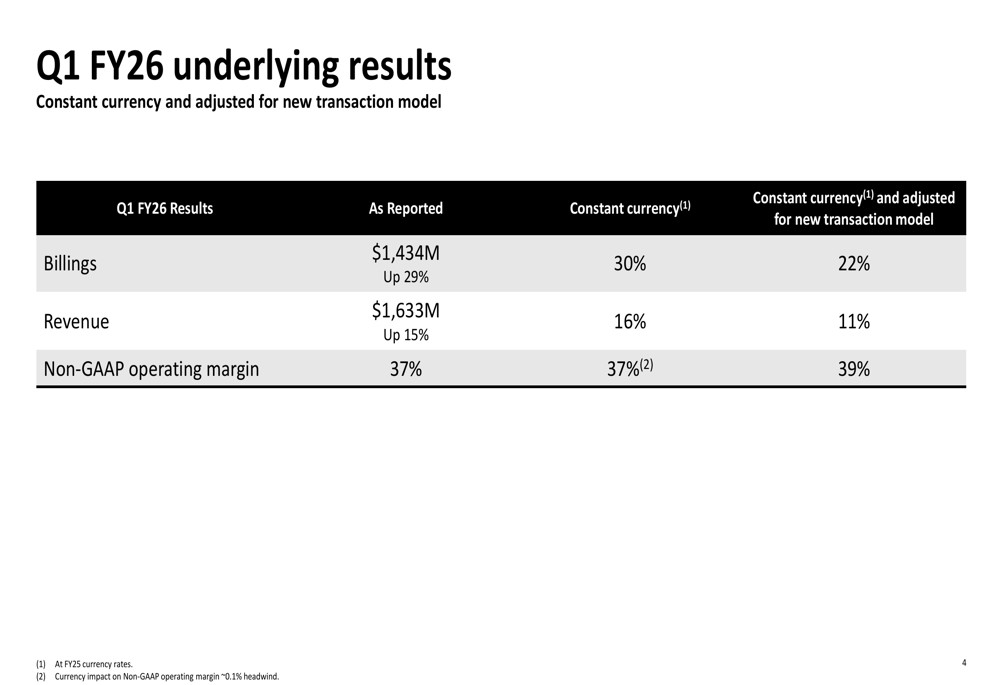
When adjusting for constant currency and the company’s new transaction model, the underlying performance shows billings growth of 22% and revenue growth of 11%, as illustrated in this chart:
Detailed Financial Analysis
Autodesk’s revenue growth was broad-based across product categories and geographic regions. The company’s core Design business generated $1.361 billion in revenue, up 14% year-over-year, while the faster-growing Make segment contributed $179 million, increasing 23% from the previous year.
The following breakdown shows performance by product type, geographic area, and product family:
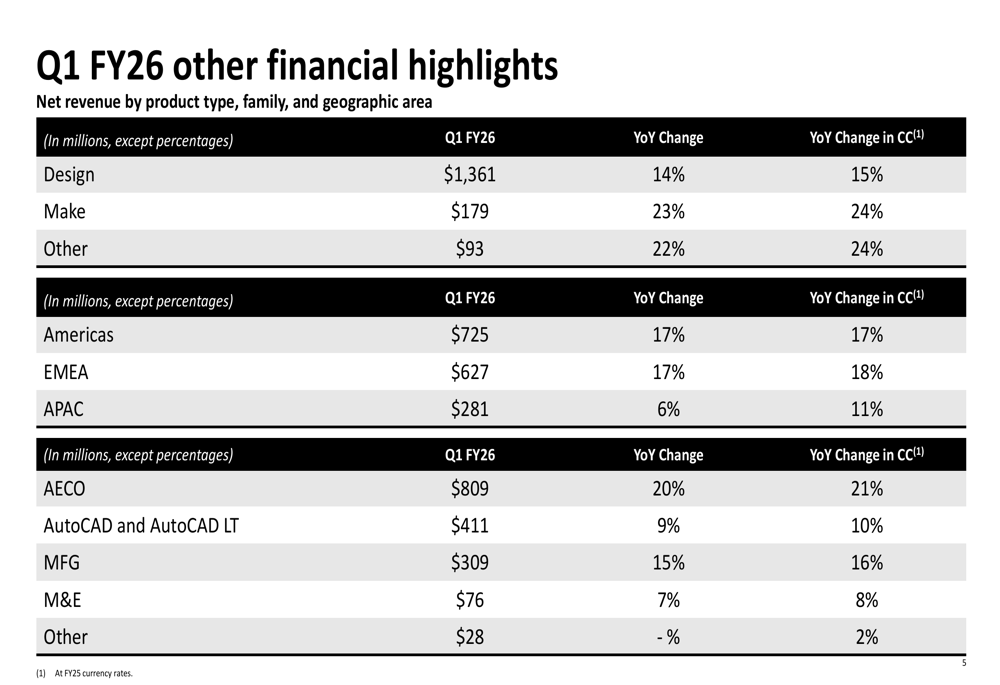
Geographically, both the Americas and EMEA (Europe, Middle East, and Africa) regions showed strong growth of 17% year-over-year, while the APAC (Asia-Pacific) region grew at a more modest 6%, or 11% in constant currency.
Among product families, the Architecture, Engineering, Construction, and Operations (AECO) segment led with 20% growth, generating $809 million in revenue. Manufacturing (MFG) grew 15% to $309 million, while AutoCAD and AutoCAD LT contributed $411 million, up 9% year-over-year.
Other financial metrics also showed positive trends, with remaining performance obligations (RPO) increasing 21% to $7.157 billion and unbilled deferred revenue surging 67% to $3.228 billion. The company’s net revenue retention rate remained slightly above 110% in constant currency, partly due to the impact of the new transaction model.
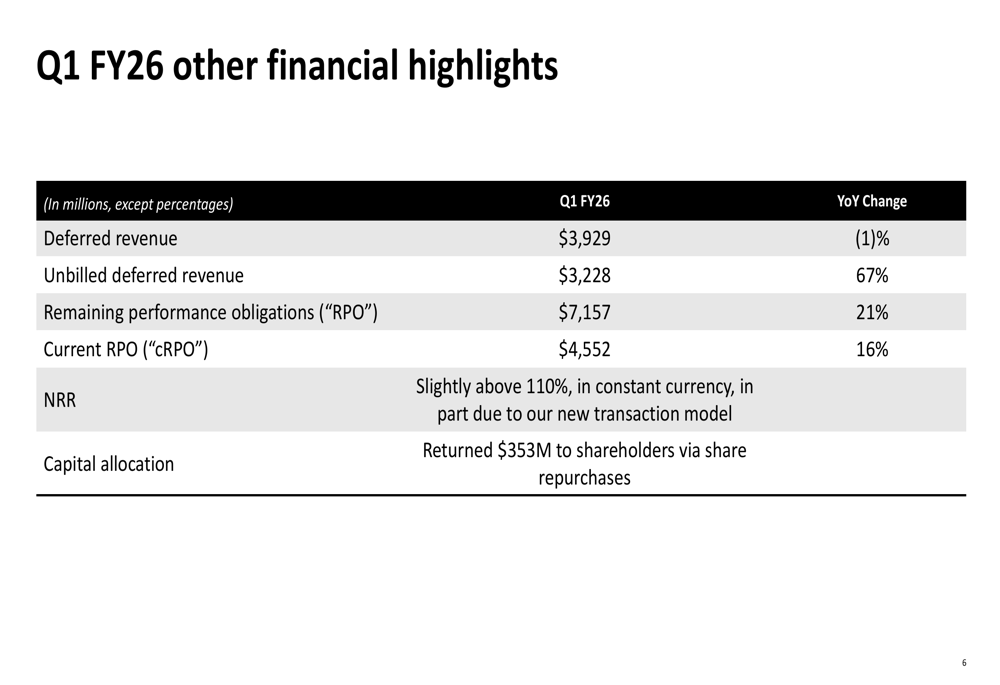
Autodesk continued its shareholder return program, repurchasing $353 million worth of shares during the quarter.
Forward-Looking Statements
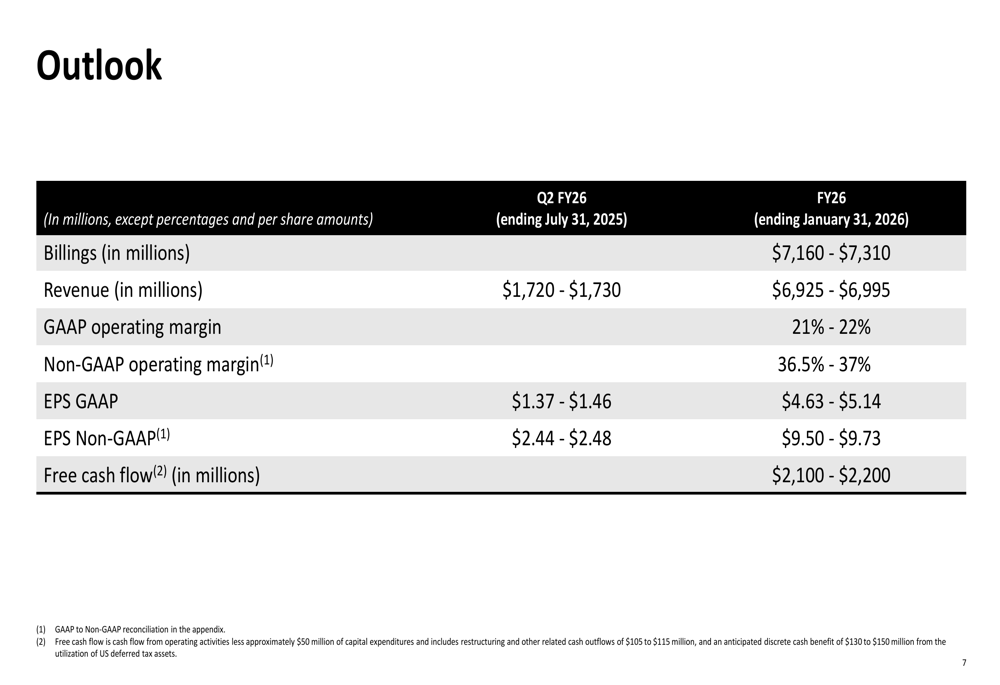
Looking ahead, Autodesk provided a strong outlook for both the second quarter and full fiscal year 2026. The company expects full-year revenue between $6.925 billion and $6.995 billion, representing growth of 13-14%.
The detailed financial outlook is presented in the following table:
On an underlying basis, adjusting for constant currency and the new transaction model, Autodesk projects revenue growth of 8-9% and billings growth of 16-18% for fiscal 2026:
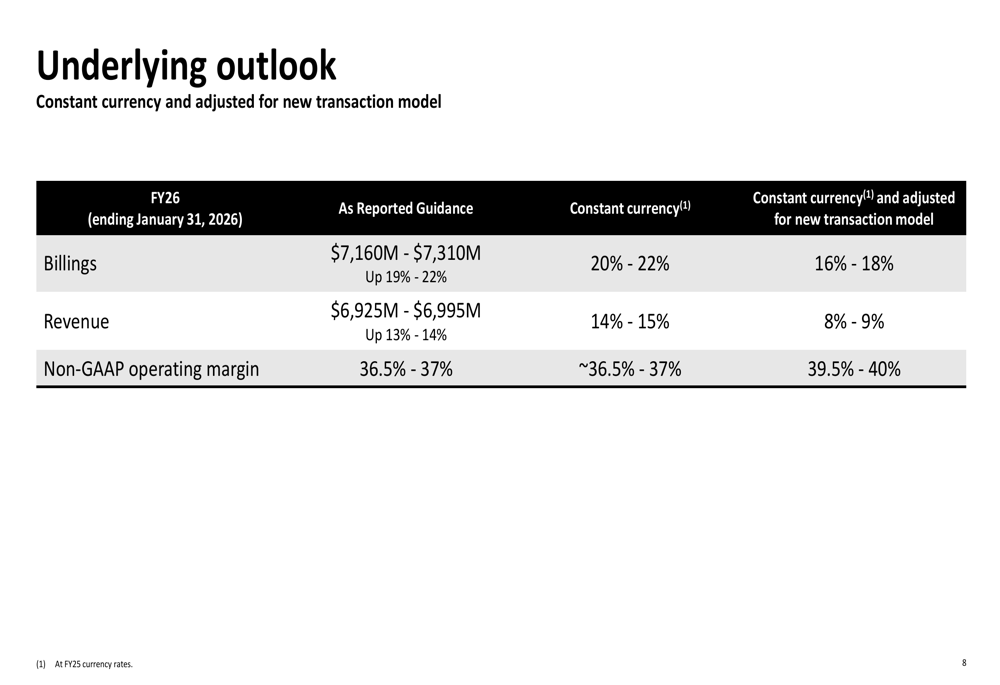
The company expects non-GAAP operating margin to be between 36.5% and 37% for the full year, or 39.5-40% when adjusted for currency and the new transaction model. Free cash flow is projected to be between $2.1 billion and $2.2 billion, with nearly two-thirds expected in the second half of the year.
Strategic Initiatives
During the quarter, Autodesk implemented a change to its Employee Stock Purchase Program (ESPP) in Australia, which led to a global assessment of its stock-based compensation practices. This review identified adjustments dating back to fiscal 1999, resulting in a one-time non-cash charge of $54 million in Q1 FY26.
The company emphasized that this charge was immaterial to prior periods and to the current fiscal year, and does not affect the trajectory of stock-based compensation expense for future years. Autodesk remains focused on bringing stock-based compensation expense as a percentage of revenue to below 10% and has incorporated this metric into its long-term executive incentive plans.
Autodesk’s new transaction model, referenced throughout the presentation, appears to be impacting several financial metrics, including billings growth and net revenue retention rate. While specific details about this model were not extensively covered in the slides, it seems to be a strategic initiative that is positively affecting the company’s financial performance.
The strong market reaction to Autodesk’s Q1 results suggests investor confidence in the company’s strategy and execution. With consistent growth across product categories and geographic regions, combined with improving margins and strong cash flow, Autodesk appears well-positioned to continue its momentum throughout fiscal 2026.
Full presentation:
This article was generated with the support of AI and reviewed by an editor. For more information see our T&C.