Intel stock spikes after report of possible US government stake

Introduction & Market Context
BankUnited, Inc. (NYSE:BKU) released its second quarter 2025 earnings presentation on July 23, 2025, highlighting significant improvements in profitability and continued progress on its strategic transformation. The bank reported net income of $68.8 million, representing an 18% increase from the first quarter’s $58.5 million, while earnings per share rose to $0.91 from $0.78 in Q1.
The stock has shown resilience in recent trading, with shares closing at $38.72 on July 22, up 2.41% on the day. This represents a significant recovery from its 52-week low of $28.21, though still below the 52-week high of $44.45. The positive quarterly results come after a mixed first quarter where the bank beat earnings expectations but missed revenue forecasts.
Quarterly Performance Highlights
BankUnited’s second quarter results demonstrated meaningful improvement across key financial metrics. Net interest income increased to $246 million, up 6% from $233 million in the first quarter. The net interest margin expanded by 12 basis points to 2.93%, continuing its upward trajectory from 2.81% in Q1 and 2.72% a year ago.
As shown in the following comprehensive financial data table, the bank’s return on equity improved to 9.4%, while maintaining strong capital ratios with CET1 at 12.2%:
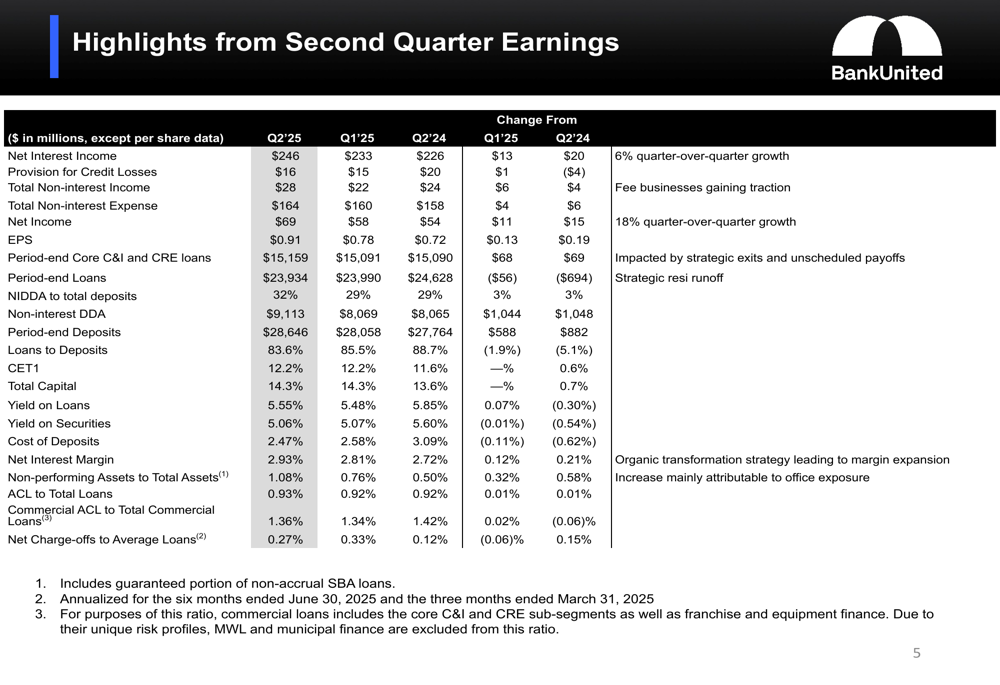
Non-interest income rose to $28 million from $22 million in Q1, with management noting that fee businesses are gaining traction. Non-interest expenses increased modestly to $164 million from $160 million in the previous quarter. The provision for credit losses remained relatively stable at $16 million compared to $15 million in Q1.
Deposit and Funding Strategy
A key driver of BankUnited’s improved performance was its successful deposit gathering strategy. Non-interest-bearing demand deposits (NIDDA) grew by $1.0 billion (13%) to $9.1 billion, representing 32% of total deposits, up from 29% in the previous quarter. This shift in deposit mix helped reduce the bank’s overall cost of deposits to 2.47% from 2.58% in Q1 and 3.09% a year ago.
The following chart illustrates the positive trend in deposit composition over recent quarters, with non-interest-bearing deposits reaching their highest proportion since December 2021:
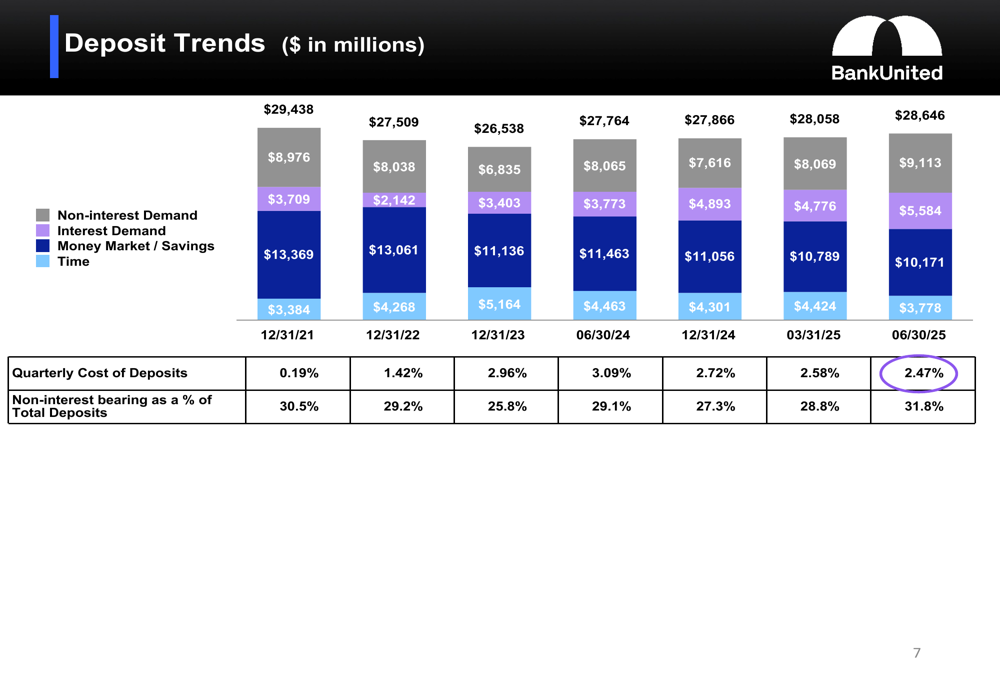
This improvement in deposit mix has allowed BankUnited to reduce its reliance on wholesale funding, which decreased by $749 million during the quarter. The loan-to-deposit ratio improved to 83.6% from 85.5% in Q1 and 88.7% a year ago, reflecting a more stable funding base.
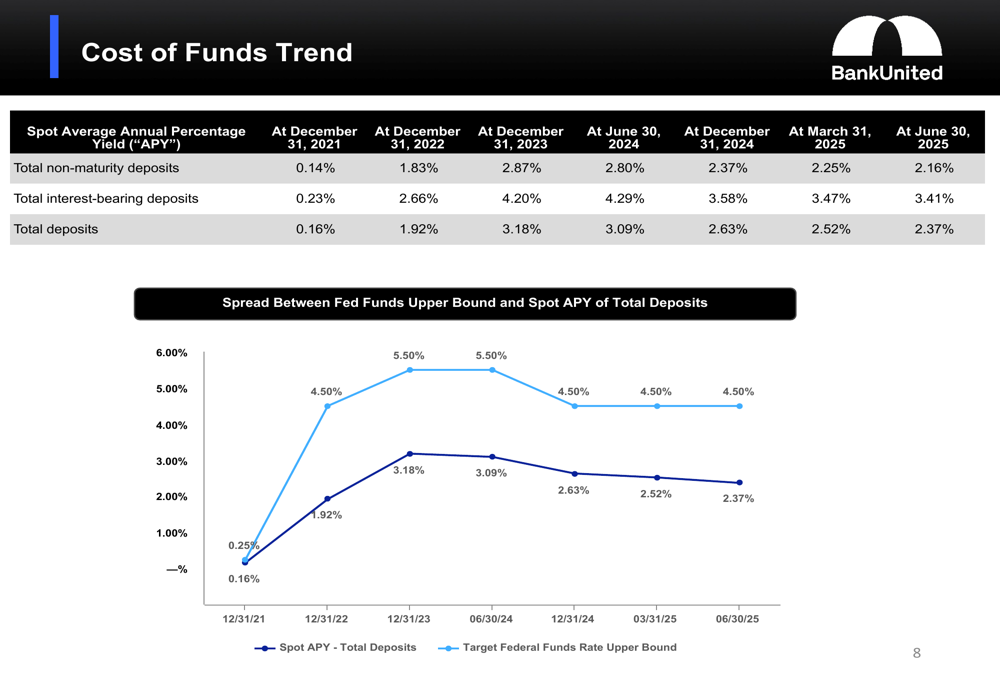
The bank’s cost of funds has continued to decline despite the elevated interest rate environment, as shown in this trend chart comparing deposit costs to the Federal Funds rate:
Loan Portfolio Analysis
BankUnited’s loan portfolio reflects its strategic shift toward commercial lending, with core C&I and CRE loans growing by $68 million during the quarter. This growth was offset by a $171 million decline in lower-yielding residential, franchise, equipment, and municipal finance loans, resulting in a slight decrease in the overall loan portfolio to $23.9 billion.
The following chart shows the evolution of the bank’s loan portfolio composition over time:
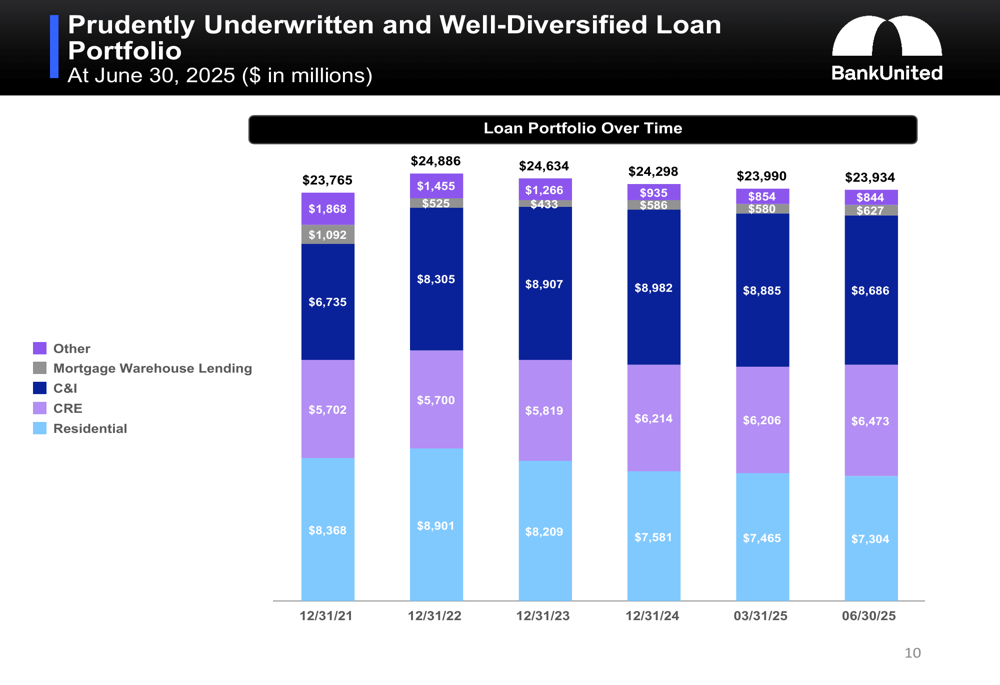
The bank’s commercial real estate exposure remains well-diversified and conservatively underwritten. At 27% of total loans, BankUnited’s CRE concentration is below the peer median of 35%, positioning the bank favorably from a risk perspective.
The CRE portfolio is spread across various property types and geographic regions, with strong weighted average debt service coverage ratios and moderate loan-to-value ratios:
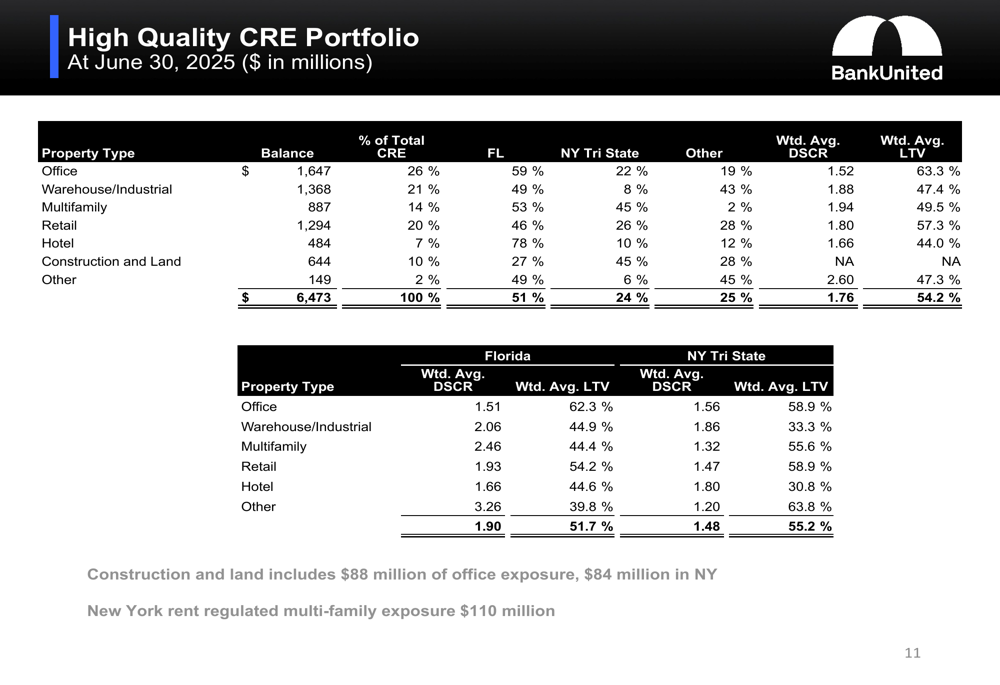
Management highlighted that only 16% of the total CRE portfolio consists of fixed-rate loans maturing in the next 12 months, limiting near-term repricing risk. The office portfolio, which has been an area of concern for many banks, represents 26% of the CRE book, with 20% ($337 million) being medical office space that has shown resilience in the current market.
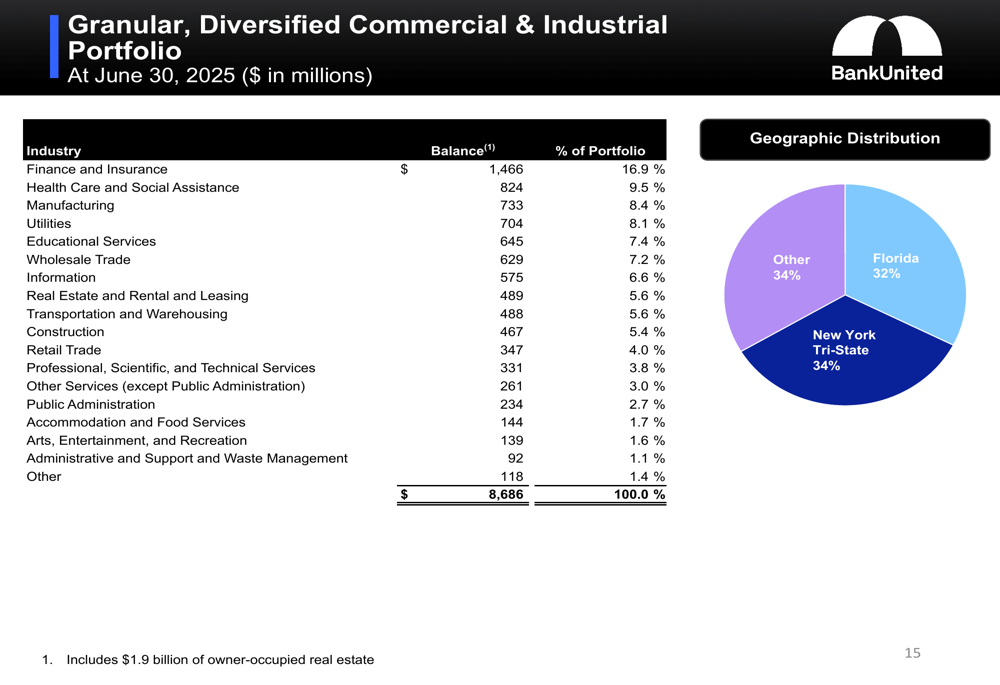
The bank’s commercial and industrial portfolio is similarly well-diversified across industries and regions:
Credit Quality and Allowance
Despite the overall positive financial performance, BankUnited reported an increase in non-performing assets to 1.08% of total assets, up from 0.76% in Q1 and 0.50% a year ago. This trend warrants monitoring, though the bank maintains that its allowance for credit losses is appropriate at 0.93% of total loans.
The drivers of change in the allowance for credit losses during the quarter are illustrated in the following bridge chart:
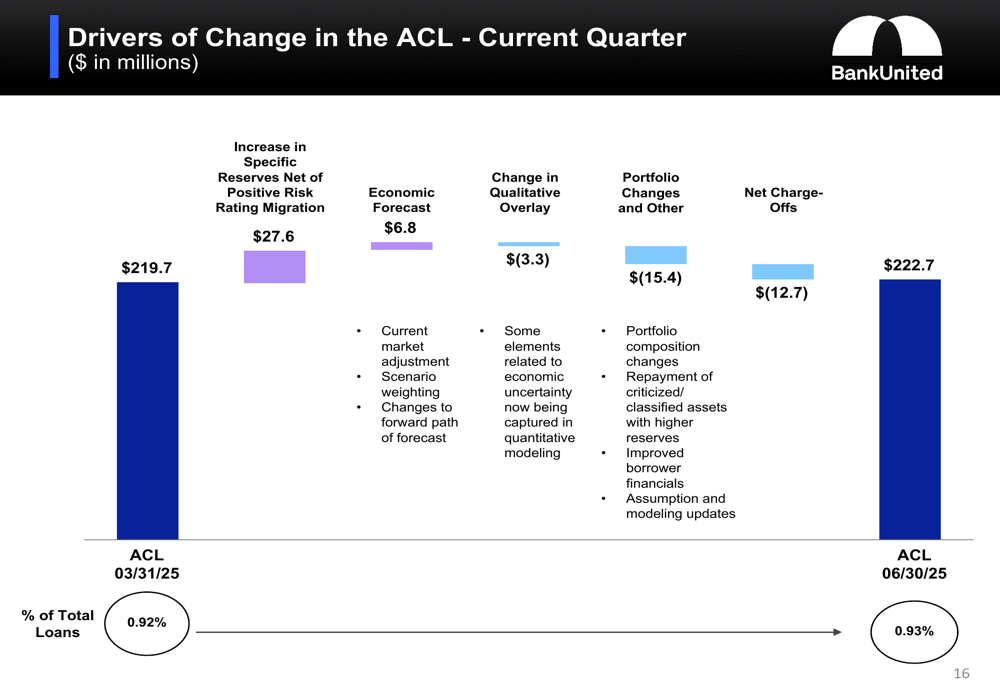
The increase in specific reserves was partially offset by portfolio changes and net charge-offs, resulting in a modest net increase in the allowance. Commercial loans maintain higher coverage ratios, with the allowance for commercial loans at 1.36% compared to just 0.18% for residential and mortgage warehouse lending.
Strategic Initiatives and Outlook
BankUnited continues to execute on its organic transformation strategy, with several initiatives highlighted in the presentation. The bank launched new wholesale banking offices in Morristown, New Jersey, and Charlotte, North Carolina, expanding its geographic footprint and growth opportunities.
The board approved a new $100 million share repurchase authorization, reflecting confidence in the bank’s financial position and future prospects. Tangible book value per share increased to $38.23, representing 9% year-over-year growth.
In the Q1 earnings call, CEO Raj Singh had noted the uncertain economic landscape, stating that "the cone of uncertainty is much bigger than it was even a month ago." The Q2 results suggest that despite this uncertainty, BankUnited has been able to execute effectively on its strategic priorities, improving its funding profile, expanding margins, and maintaining strong capital levels.
While the presentation did not provide specific forward guidance, the continued improvement in net interest margin (now at 2.93%) suggests the bank is on track to achieve its previously stated goal of expanding NIM to over 3% by year-end 2025. The strategic shift away from residential lending toward commercial business continues to progress, with the improved deposit mix providing a more stable funding base for future growth.
Full presentation:
This article was generated with the support of AI and reviewed by an editor. For more information see our T&C.