S&P 500 slips, but losses kept in check as Nvidia climbs ahead of results

Braze Inc. (NASDAQ:BRZE) reported its first quarter fiscal 2026 results on June 5, 2025, beating revenue expectations and raising its full-year guidance despite signs of slowing growth. The customer engagement platform provider’s shares rose 1.23% in after-hours trading following the announcement.
Quarterly Performance Highlights
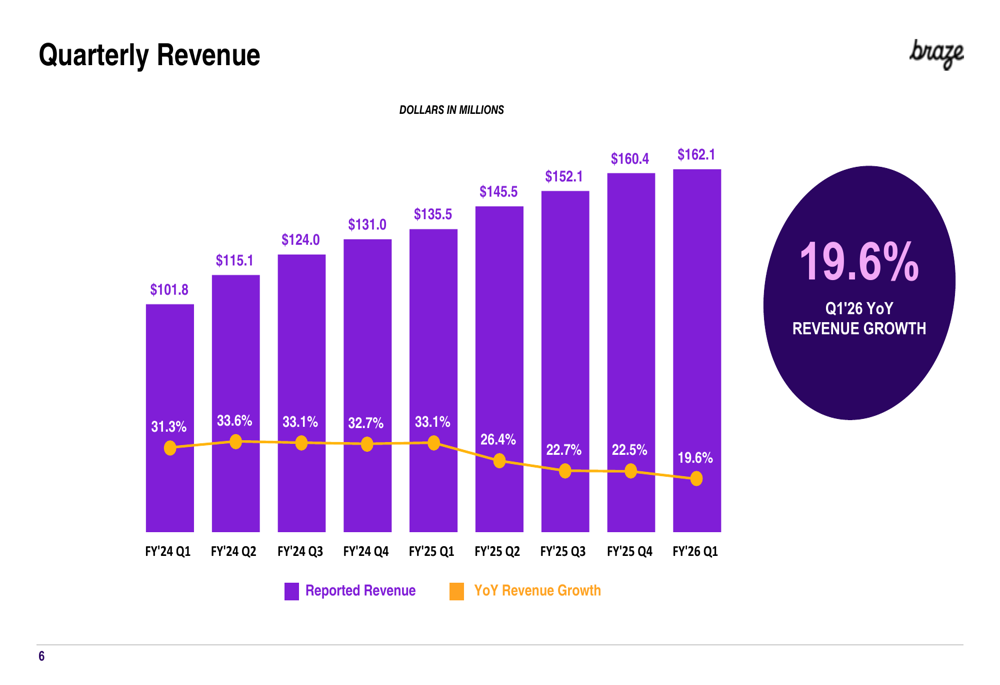
Braze reported Q1 revenue of $162.1 million, representing a 19.6% year-over-year increase and a 1% sequential gain from the previous quarter. This performance exceeded the company’s previous guidance of $158-159 million and translated to a quarterly revenue run rate of $648 million.
The company continued its transition toward profitability, posting a non-GAAP operating income of $2.8 million, compared to a loss of $10.0 million in the prior year quarter. Non-GAAP net income per share was $0.07, based on 108.0 million weighted average shares, a significant improvement from the $0.05 loss per share reported a year earlier.
As shown in the following chart of quarterly revenue growth, Braze has maintained consistent revenue expansion, though the pace has moderated from earlier periods:
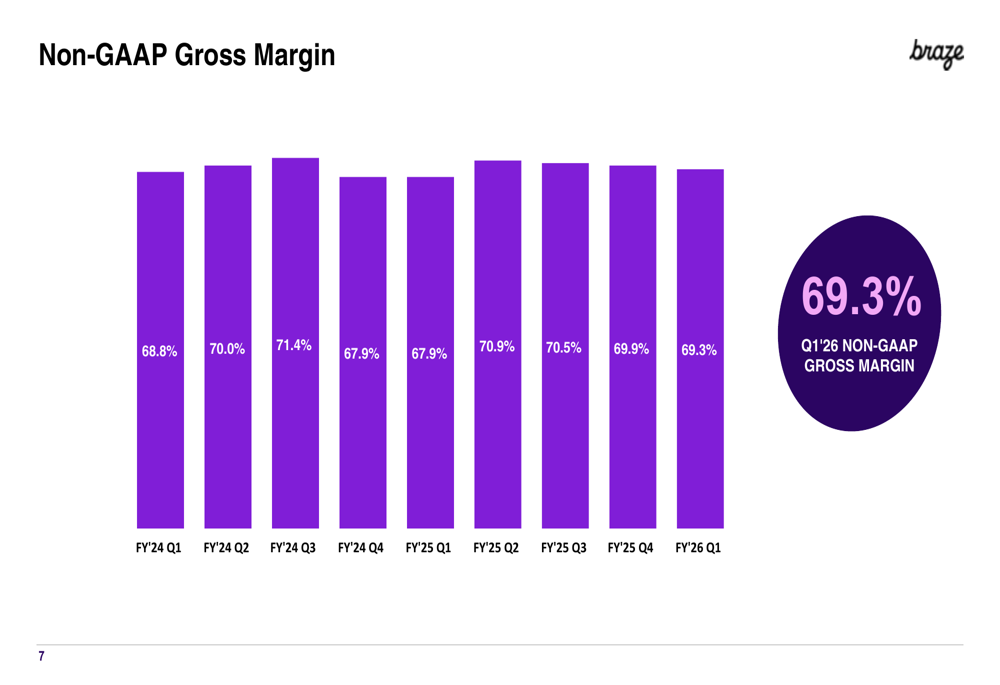
Braze’s gross margin performance showed improvement, with GAAP gross margin reaching 68.6%, up 150 basis points year-over-year, while non-GAAP gross margin hit 69.3%, up 140 basis points from the prior year period.
The following chart illustrates Braze’s non-GAAP gross margin trend over recent quarters:
Detailed Financial Analysis
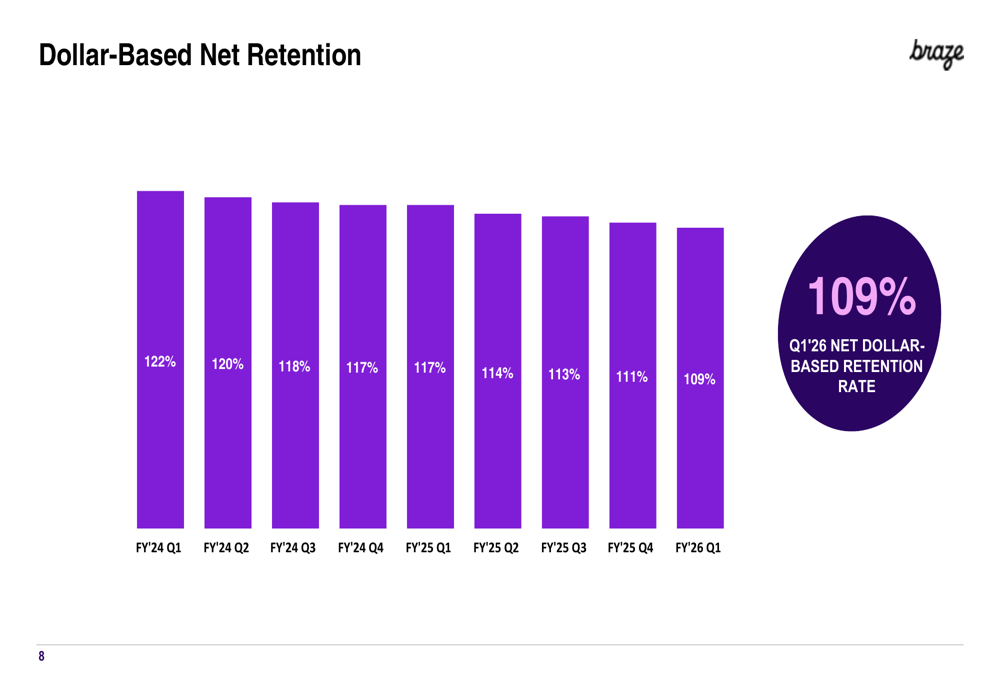
While Braze’s top-line growth remained solid, the company’s dollar-based net retention rate continued its downward trend, reaching 109% in Q1 FY2026 compared to 117% in the prior year quarter and 111% in Q4 of FY2025. This metric, which measures the company’s ability to expand revenue from existing customers, has declined steadily over the past nine quarters.
The following chart shows the progression of Braze’s dollar-based net retention rate:
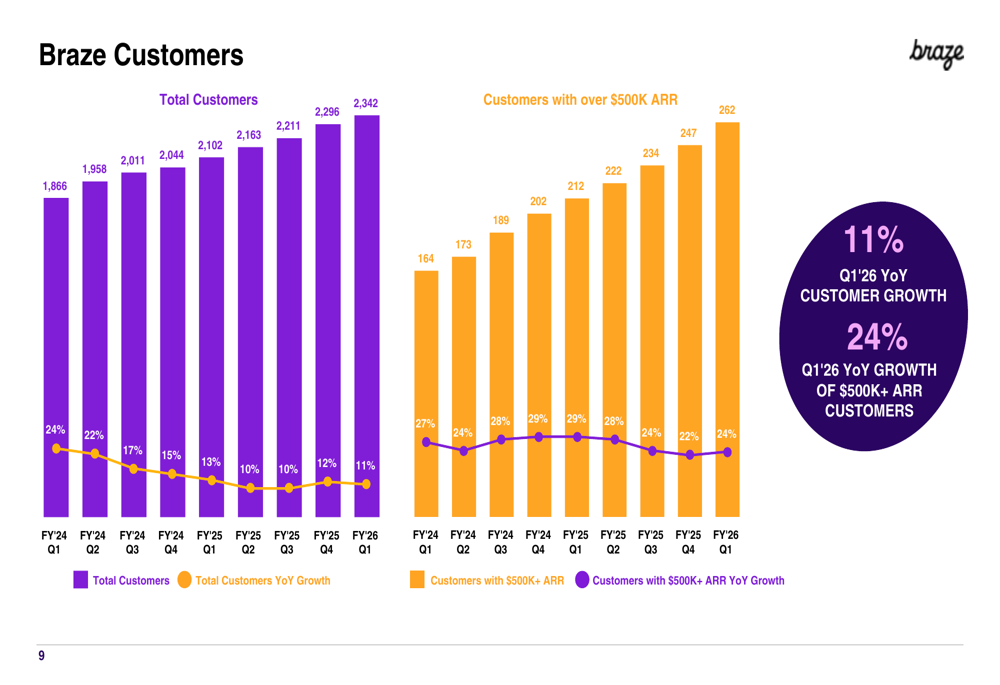
Despite the declining retention rate, Braze’s customer acquisition remained positive. The company reported 2,342 customers as of April 30, 2025, an 11% increase from 2,102 in the prior year. More importantly, customers contributing over $500,000 in annual recurring revenue (ARR) grew to 262, indicating the company’s success in landing larger accounts.
The following chart details Braze’s customer growth metrics:
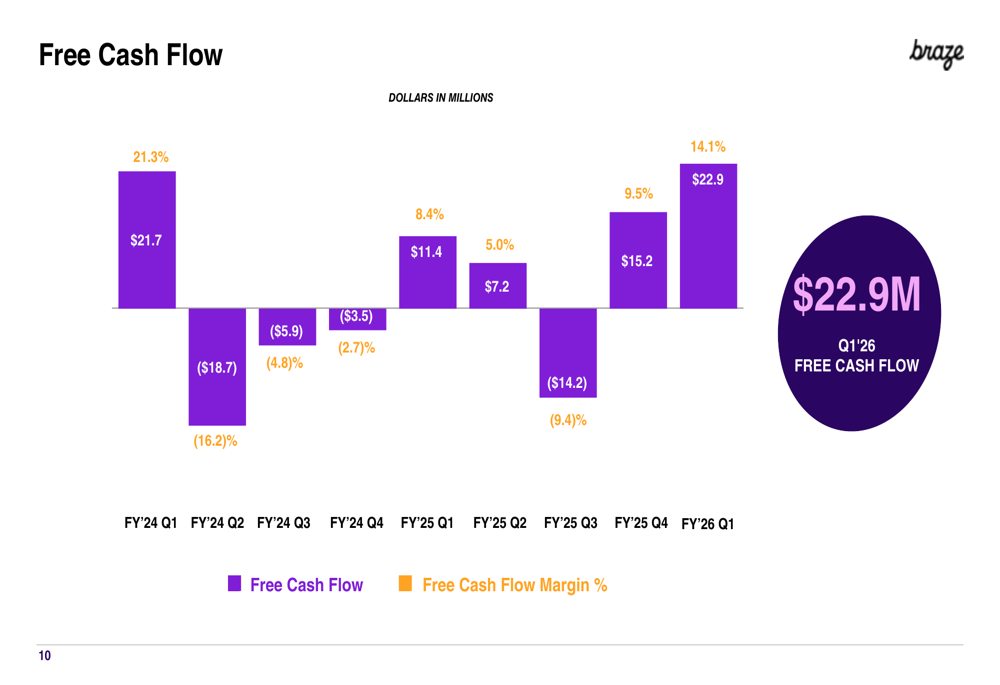
A notable bright spot in Braze’s financial performance was its free cash flow, which reached $22.9 million in Q1, representing a 14.1% margin and more than doubling from $11.4 million in the prior year quarter. This improvement demonstrates the company’s increasing operational efficiency and financial discipline.
As illustrated in the following free cash flow chart:
Strategic Initiatives
Braze highlighted several strategic developments during the quarter, including the acquisition of AI Decisioning Engine OfferFit, which is expected to enhance the company’s ability to transform customer relationships and deliver value. This acquisition aligns with Braze’s previous statements about integrating AI-driven solutions into its platform.
The company also introduced two new messaging channels – RCS and Banners – and a new Canvas step, expanding its product capabilities. Additionally, Braze appointed Ed McDonnell as Chief Revenue Officer, filling a key leadership position that had been mentioned in the previous earnings call.
On the environmental front, Braze received approval from the Science Based Target (NYSE:TGT) Initiative for its near-term emissions reduction targets, underscoring the company’s commitment to sustainability.
Forward-Looking Statements
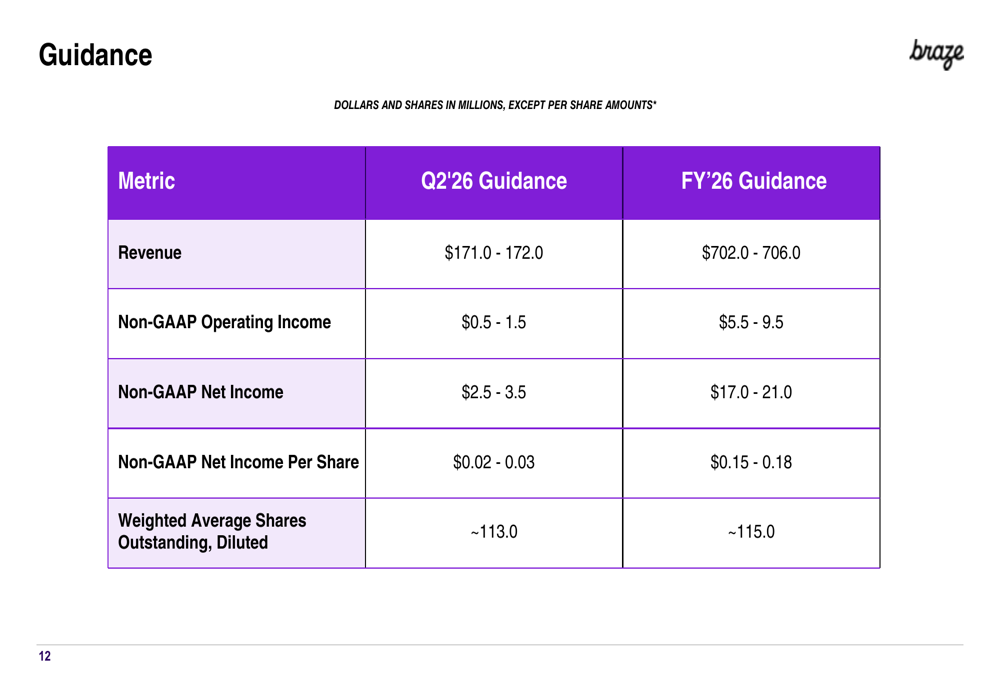
Braze provided an optimistic outlook for both the upcoming quarter and the full fiscal year, raising its previous guidance. For Q2 FY2026, the company expects:
- Revenue between $171.0-172.0 million
- Non-GAAP operating income of $0.5-1.5 million
- Non-GAAP net income of $2.5-3.5 million
- Non-GAAP net income per share of $0.02-0.03
For the full fiscal year 2026, Braze projects:
- Revenue of $702.0-706.0 million, up from its previous guidance of $686-691 million
- Non-GAAP operating income of $5.5-9.5 million
- Non-GAAP net income of $17.0-21.0 million
- Non-GAAP net income per share of $0.15-0.18
The following guidance chart provides a comprehensive view of Braze’s financial projections:
This raised guidance suggests management confidence in the company’s growth trajectory despite the declining retention rate. The projected full-year revenue growth of approximately 16% represents a further moderation from the 19.6% growth achieved in Q1, indicating that Braze is entering a more mature phase of its business development.
While Braze continues to demonstrate strong execution in terms of profitability improvements and cash flow generation, investors will likely focus on the company’s ability to reverse the downward trend in customer retention and reaccelerate growth in the coming quarters.
Full presentation:
This article was generated with the support of AI and reviewed by an editor. For more information see our T&C.