BigBear.ai appoints Sean Ricker as chief financial officer

Introduction & Market Context
Brighthouse Financial Inc. (NASDAQ:BHF) released its second quarter 2025 earnings presentation on August 8, showing a significant decline in adjusted earnings despite maintaining a strong capital position. The insurer’s stock, which has been under pressure recently, closed at $46.07 on August 7, down 2.97% and trading closer to its 52-week low of $40 than its high of $64.12.
The presentation follows a disappointing first quarter where the company missed EPS expectations, and continues to reflect challenges in investment yields and underwriting margins that have impacted the company’s financial performance.
Executive Summary
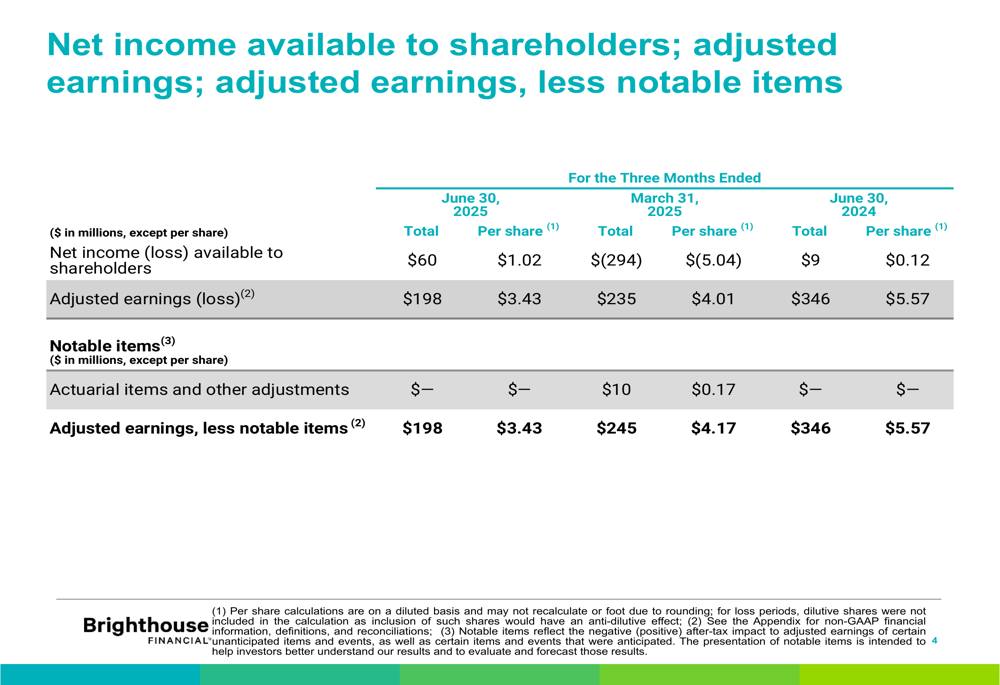
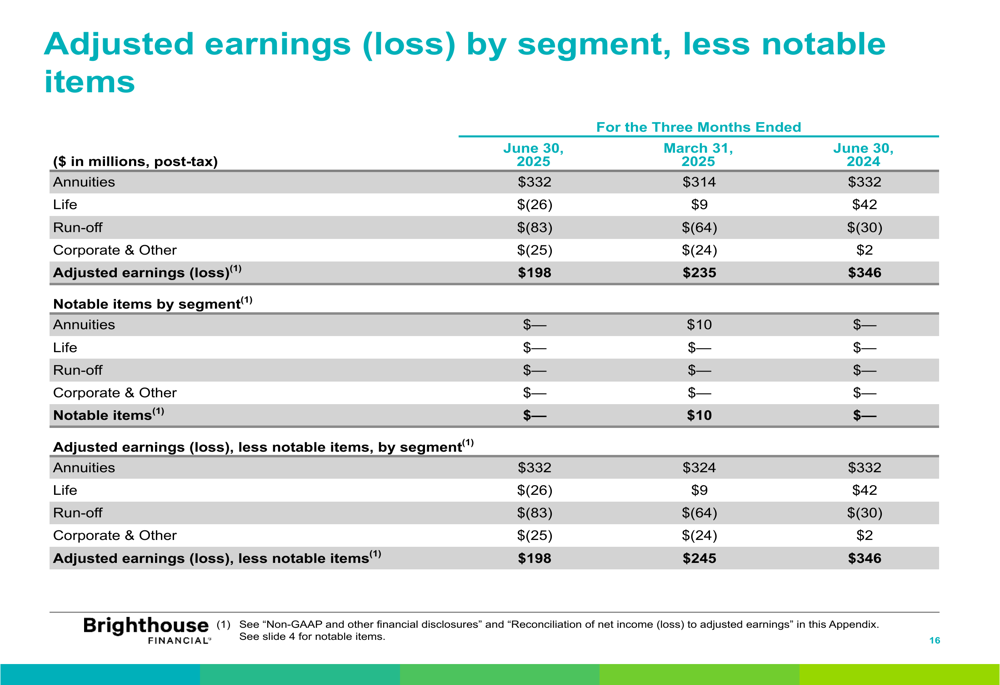
Brighthouse Financial reported adjusted earnings of $198 million ($3.43 per share) for the second quarter of 2025, a substantial 43% decrease from the $346 million ($5.57 per share) reported in the same period last year. The company acknowledged that these results were approximately $60 million below quarterly run rate expectations, primarily due to lower alternative investment income yield of 1.5% and reduced underwriting margins.
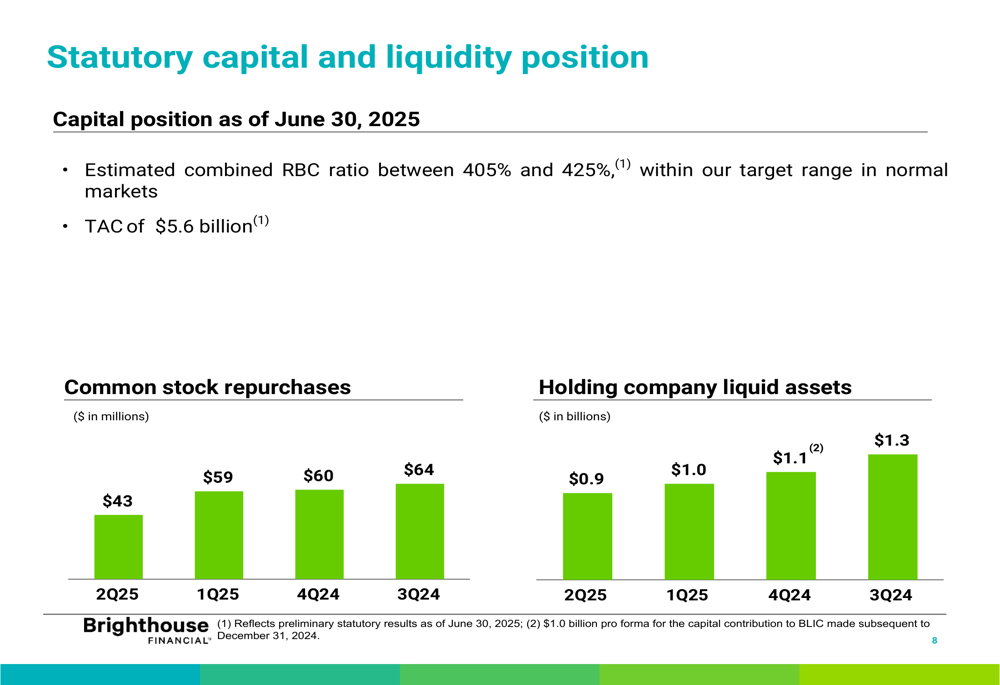
Despite these challenges, the company maintained a solid capital position with an estimated combined risk-based capital (RBC) ratio between 405% and 425%, holding company liquid assets of $0.9 billion, and statutory combined total adjusted capital (TAC) of $5.6 billion.
As shown in the following table comparing net income and adjusted earnings across periods:
Quarterly Performance Highlights
The company’s net income available to shareholders improved to $60 million ($1.02 per share) compared to just $9 million ($0.12 per share) in Q2 2024. However, this improvement in GAAP results was overshadowed by the significant decline in adjusted earnings, which is the metric the company emphasizes for evaluating its operational performance.
Brighthouse Financial repurchased $43 million of common stock during the quarter but noted there were no additional repurchases following the expiration of the company’s 10b5-1 repurchase plan. This represents a continuation of declining repurchase activity, with $59 million in Q1 2025, $60 million in Q4 2024, and $64 million in Q3 2024.
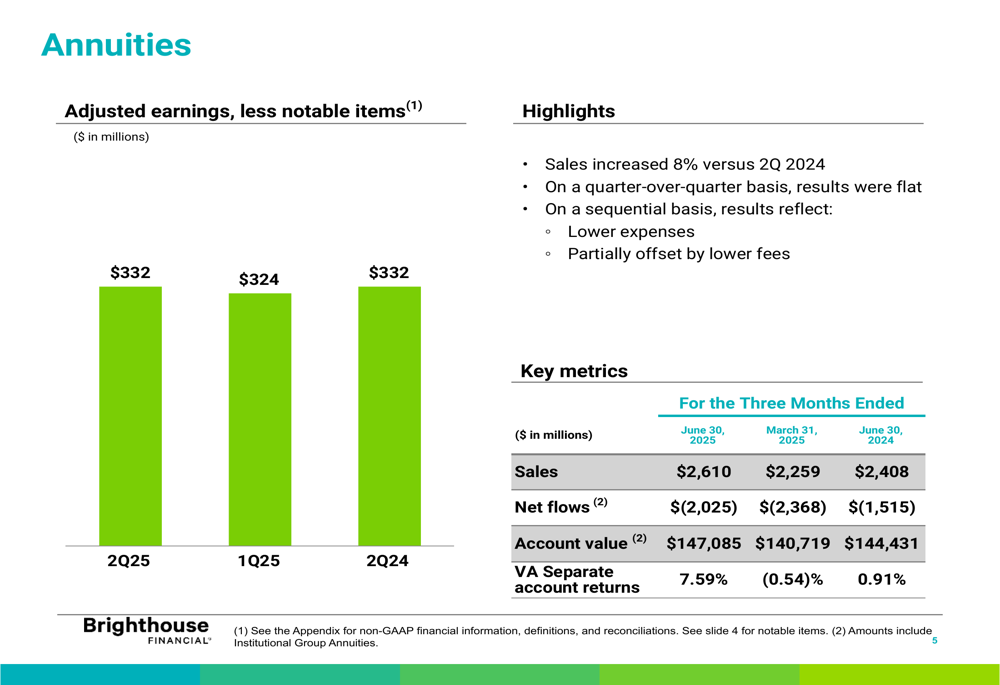
The annuities segment, which remains the company’s strongest performer, showed positive sales momentum with an 8% increase compared to Q2 2024. The segment’s detailed performance is illustrated below:
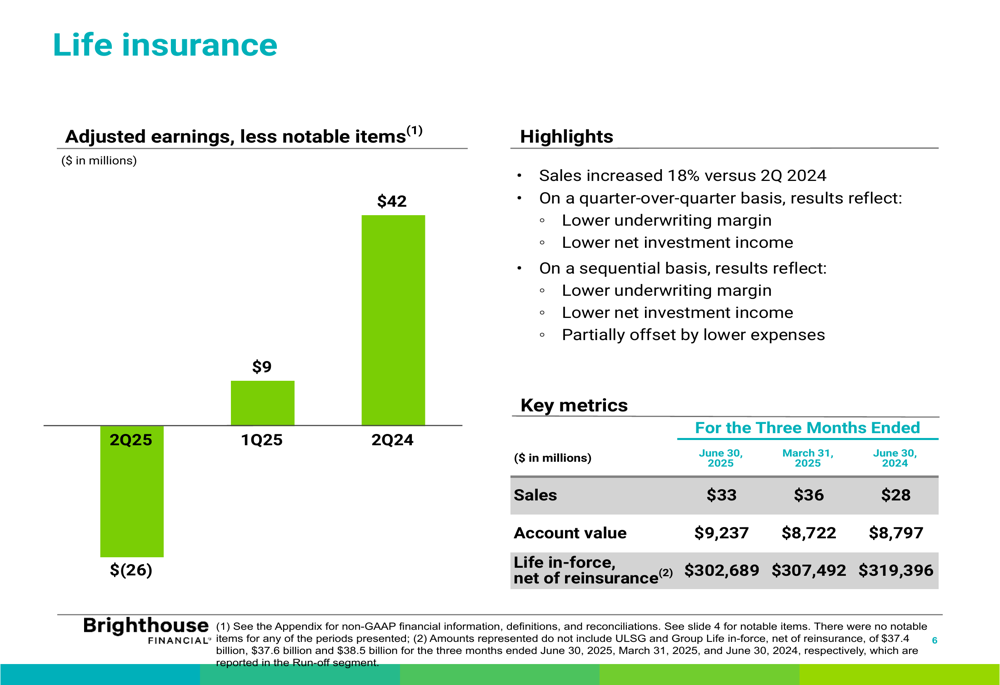
The life insurance segment also demonstrated sales growth of 18% versus the prior year, but reported an adjusted loss of $26 million compared to a $42 million profit in Q2 2024. This significant deterioration in segment performance reflects the broader challenges facing the company:
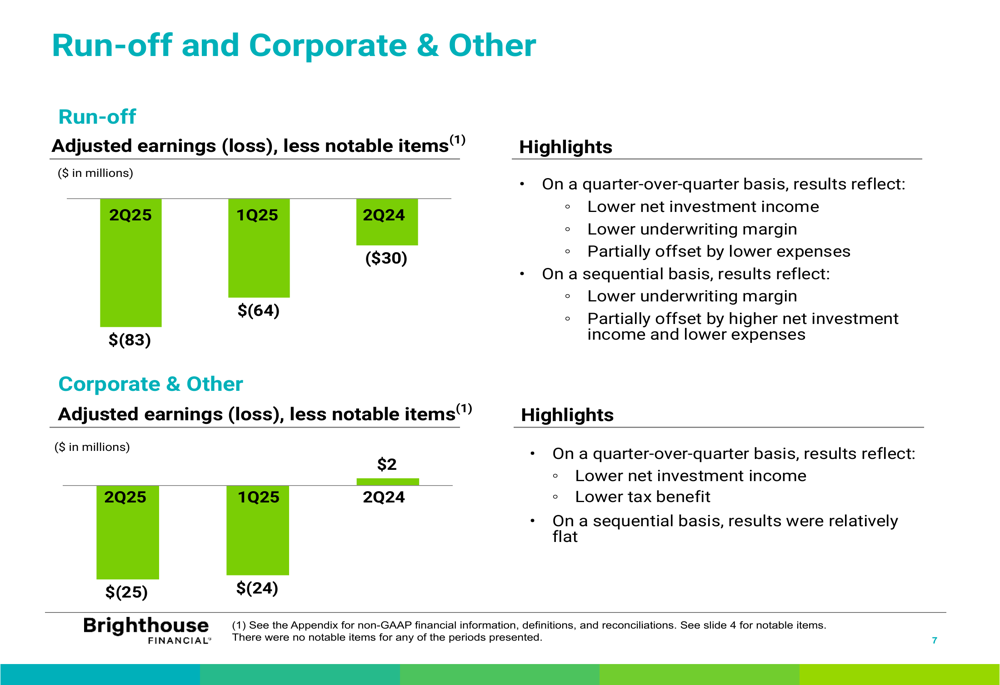
The run-off and corporate segments also experienced performance declines, with the run-off segment reporting a loss of $83 million compared to a $30 million loss in Q2 2024, primarily due to lower net investment income and underwriting margins:
Detailed Financial Analysis
Brighthouse Financial’s financial results reflect several underlying trends. The company’s capital position remains strong, but there has been a gradual decline in holding company liquid assets from $1.3 billion in Q3 2024 to $0.9 billion in Q2 2025. Similarly, stock repurchases have been decreasing quarter over quarter.
The company’s statutory results show a year-to-date normalized statutory loss of $0.1 billion, which contrasts with the positive adjusted earnings reported under GAAP accounting. This divergence highlights the complex accounting considerations in the insurance industry and the challenges Brighthouse faces in generating statutory profits.
The following chart illustrates the company’s capital and liquidity position over recent quarters:
A comprehensive breakdown of adjusted earnings by segment further illustrates the performance challenges across the business:
Investment Portfolio Overview
Brighthouse Financial maintains a $127 billion investment portfolio, with 97% of its $87 billion in fixed maturity securities rated as investment grade. The company has significantly de-risked its portfolio since Q4 2021, reducing below investment grade credit by 39%.
The investment portfolio composition, which is critical to understanding the company’s earnings potential and risk profile, is detailed in the following chart:

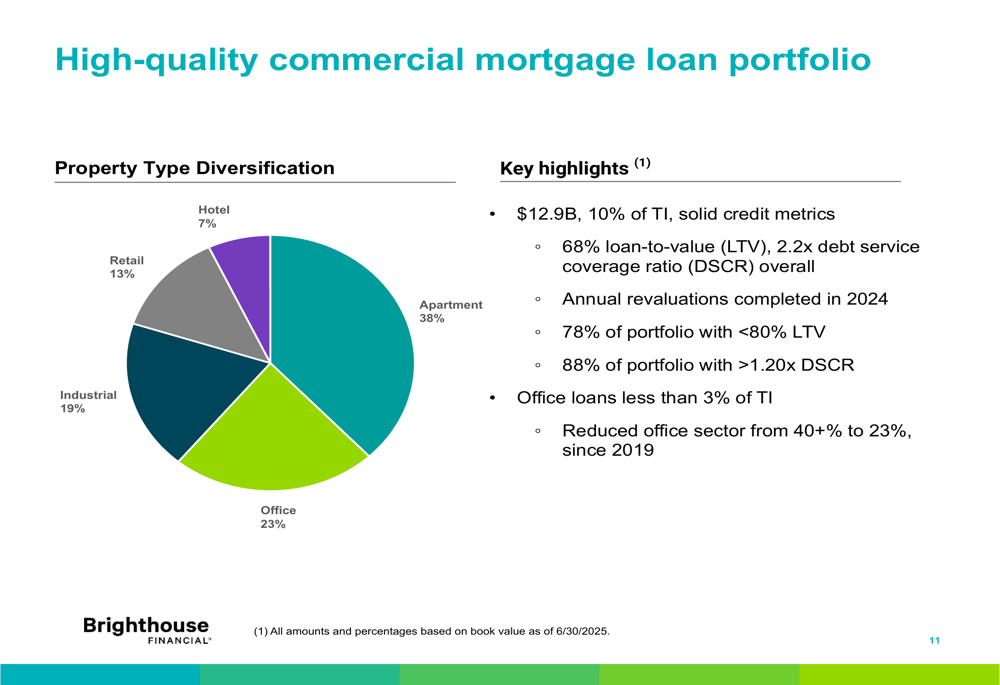
The company’s commercial mortgage loan portfolio, representing $12.9 billion or 10% of total investments, maintains solid credit metrics with a 68% loan-to-value ratio and 2.2x debt service coverage ratio. The portfolio is diversified across property types, with apartments comprising the largest portion at 38%:
Forward-Looking Statements
While Brighthouse Financial faces significant challenges with lower investment yields and underwriting margins, the company’s sales growth in both annuities (8% year-over-year) and life insurance (18% year-over-year) provides some positive indicators for future revenue potential.
The company’s decision to pause stock repurchases following the expiration of its 10b5-1 plan suggests a more conservative approach to capital management in the face of earnings pressure. This aligns with the gradual reduction in holding company liquid assets observed over recent quarters.
The significant gap between current performance and quarterly run rate expectations indicates that Brighthouse Financial may need to adjust market expectations or implement strategic changes to improve profitability. The company’s continued focus on maintaining a strong capital position provides flexibility to navigate these challenges, but investors will likely look for signs of earnings stabilization in coming quarters.
Full presentation:
This article was generated with the support of AI and reviewed by an editor. For more information see our T&C.