Gold prices dip as hawkish Fed minutes weigh ahead of Jackson Hole
Introduction & Market Context
CareTrust REIT, Inc. (NYSE:CTRE) has released its first quarter 2025 financial supplement, revealing substantial year-over-year growth across key metrics as the healthcare-focused real estate investment trust continues its strategic expansion. The company, which specializes in seniors housing and healthcare-related properties, has maintained its growth trajectory from 2024, when it completed significant acquisitions in Tennessee and the Northeast.
As of May 1, 2025, CareTrust’s stock closed at $29.27, down slightly by 0.62% for the day, with the stock trading within a 52-week range of $24.35 to $33.15. The company’s market capitalization stands at approximately $5.4 billion, reflecting its continued growth in the healthcare real estate sector.
Quarterly Performance Highlights
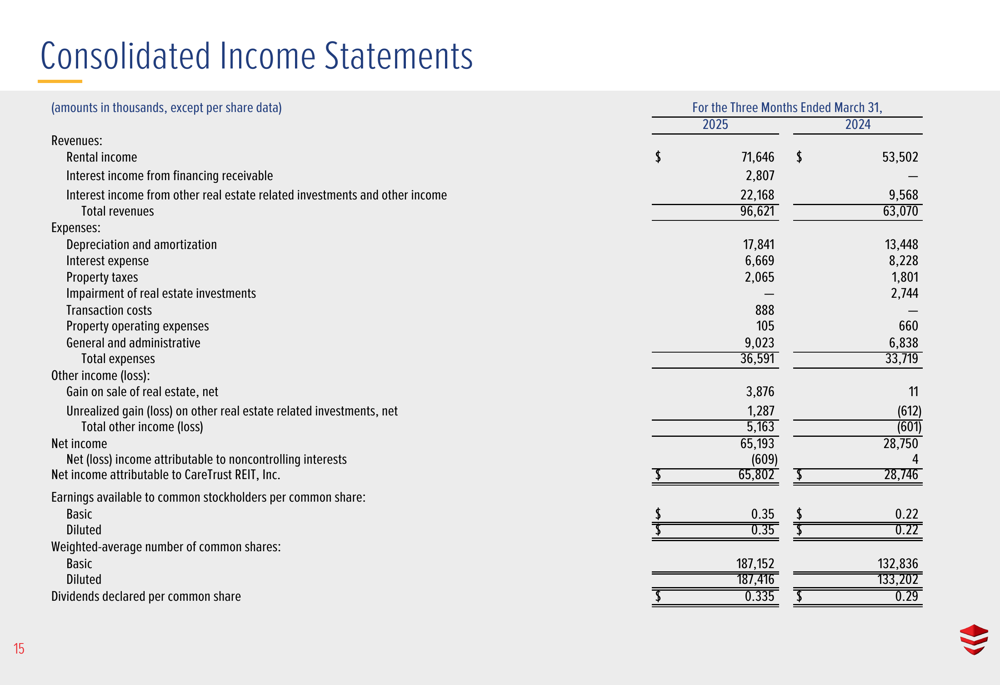
CareTrust delivered impressive financial results for the first quarter of 2025, with total revenues reaching $96.6 million, a 53% increase compared to $63.1 million in the same period last year. Net income more than doubled to $65.2 million from $28.8 million in Q1 2024, representing a 127% year-over-year increase.
The company’s performance in normalized funds from operations (FFO) and earnings before interest, taxes, depreciation, amortization, and rent (EBITDAR) also showed substantial improvement, demonstrating the effectiveness of CareTrust’s investment strategy.
As shown in the following consolidated income statement, both revenues and net income saw significant growth compared to the prior year:
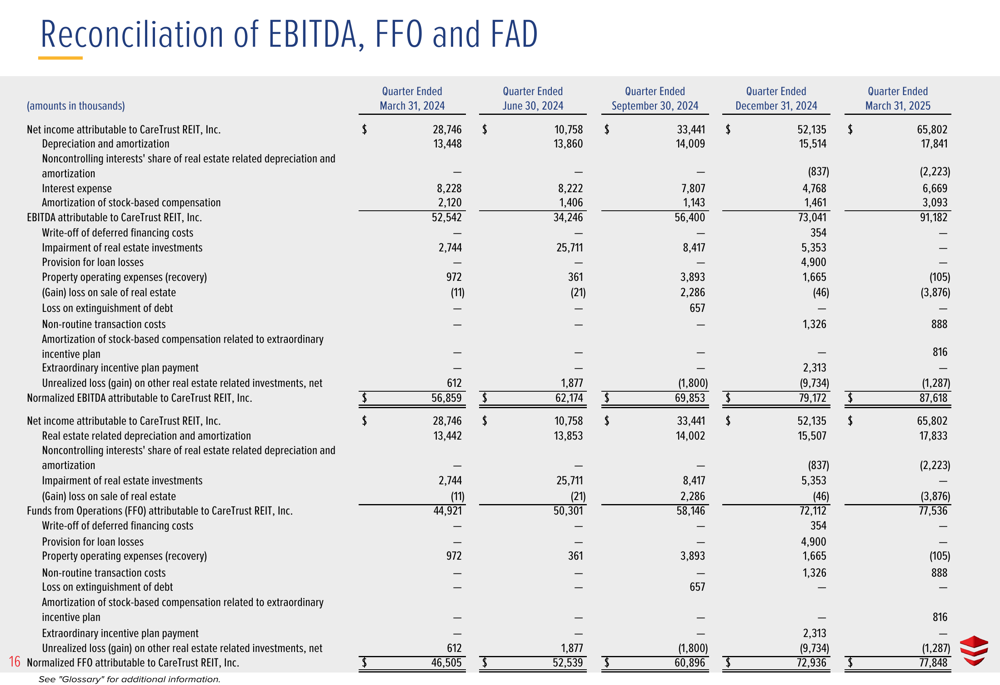
The company’s normalized EBITDA increased to $87.6 million in Q1 2025 from $56.9 million in Q1 2024, while normalized FFO grew to $77.8 million from $46.5 million during the same period. These metrics are particularly important for REITs as they provide a clearer picture of operational performance by excluding certain non-cash expenses.
The following reconciliation highlights the consistent growth in these key metrics over the past five quarters:
Portfolio and Investment Strategy
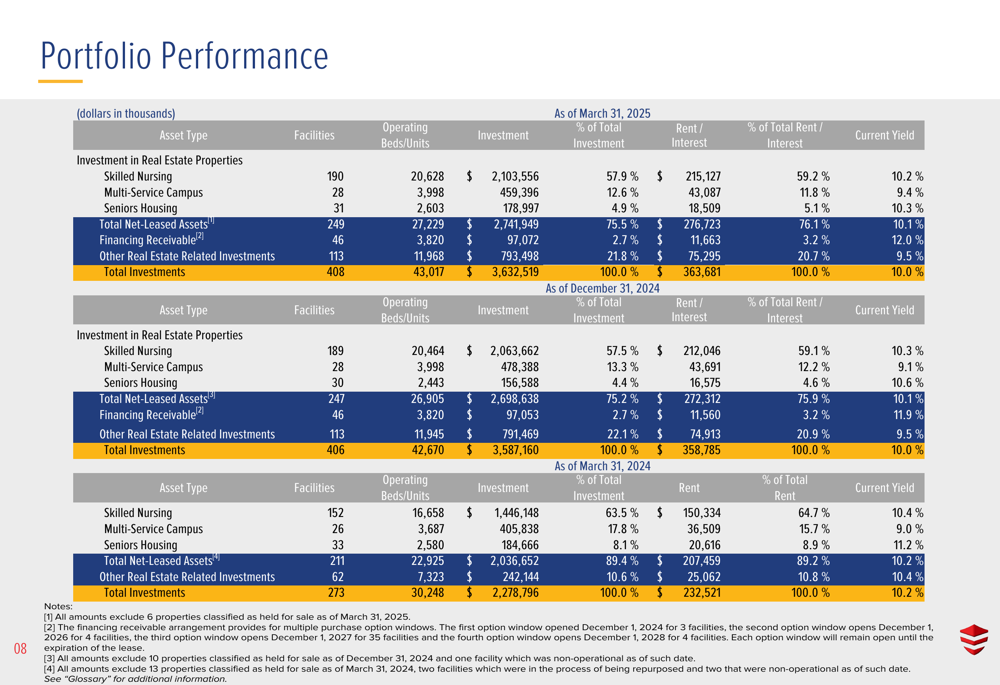
As of March 31, 2025, CareTrust’s portfolio included 249 net-leased healthcare properties across 32 states with 27,229 beds/units, along with 21 other real estate related investments connected to 113 healthcare properties across 17 states with 11,968 operating beds/units. The company also maintains one financing receivable related to 46 properties in one state consisting of 3,820 operating beds/units.
The company’s total investments amount to $3.63 billion across 408 properties, generating $363.7 million in annual rent and interest at a current yield of 10.0%. This performance represents the culmination of a strategic expansion that began in earnest during 2024.
The following portfolio performance table provides a comprehensive overview of CareTrust’s investments and returns:
CareTrust maintains a diversified tenant base, though with some concentration among its top operators. The Ensign Group (NASDAQ:ENSG) represents the largest tenant at 27.2% of total rent, followed by PACS Group (14.4%) and Priority Management Group (11.5%). The top 10 tenants collectively account for 82.9% of total rent, highlighting the importance of these key relationships.
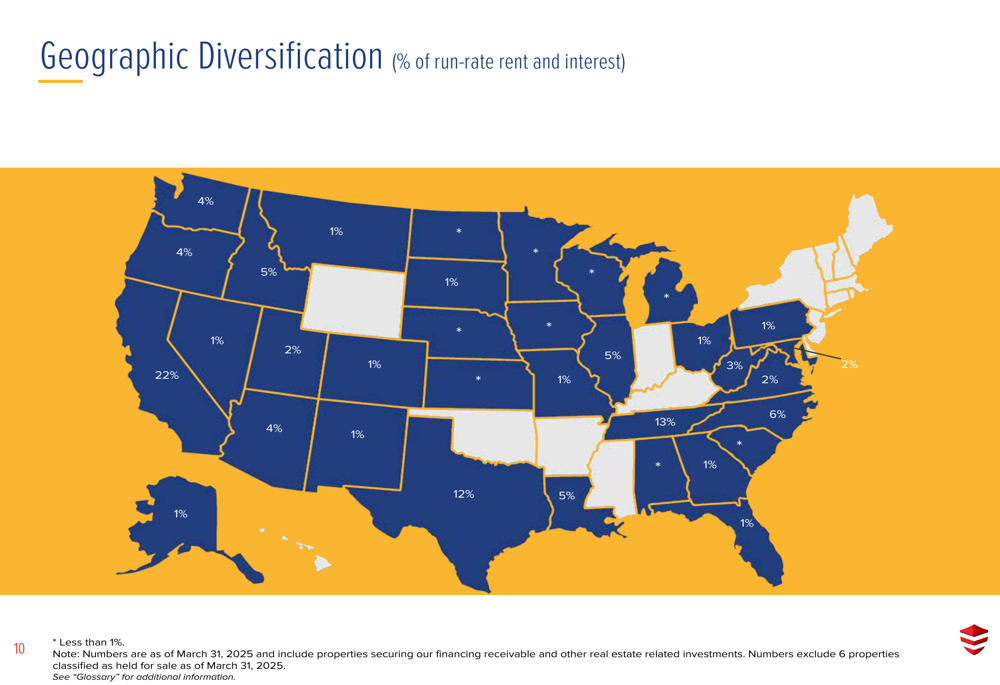
Geographic diversification remains a priority for CareTrust, with properties spread across 34 states. California represents the largest concentration at 22.1% of rent and interest, followed by Tennessee (12.6%) and Texas (12.0%). This geographic spread helps mitigate regional risks while allowing the company to capitalize on favorable demographics in key markets.
The following map illustrates CareTrust’s geographic diversification based on run-rate rent and interest:
Balance Sheet and Financial Position
CareTrust maintains a conservative financial profile with manageable debt levels and strong liquidity. As of March 31, 2025, the company’s debt consisted primarily of $400 million in senior unsecured notes (3.875% interest rate, maturing in 2028) and $425 million drawn on its unsecured revolving credit facility (5.472% interest rate, maturing in 2029).
The company’s key debt metrics show a decreasing trend in leverage, positioning CareTrust well for future growth opportunities:
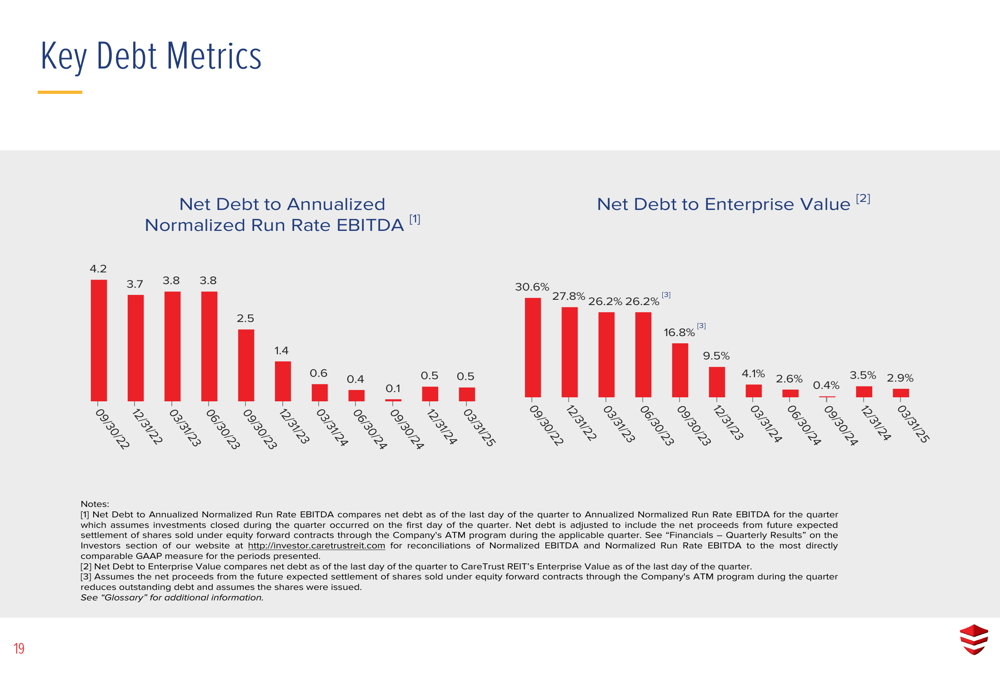
CareTrust’s compliance with debt covenants remains strong, with actual metrics well within required thresholds. The consolidated leverage ratio stands at 20.9% versus a maximum requirement of 60%, while the consolidated fixed charge coverage ratio is 11.85x compared to a minimum requirement of 1.50x.
This conservative approach to leverage, combined with the company’s strong operational performance, has enabled CareTrust to maintain its investment-grade credit profile. The company currently holds credit ratings of BB+ (stable) from S&P, Ba1 (stable) from Moody’s, and BB+ (positive) from Fitch.
2025 Guidance and Outlook
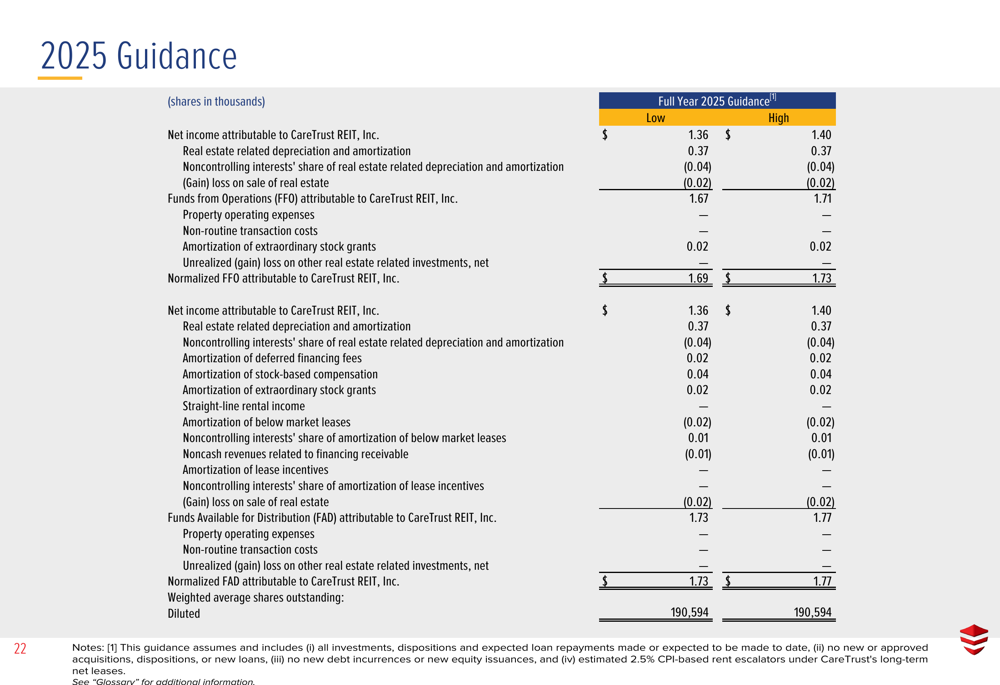
Looking ahead, CareTrust has provided full-year 2025 guidance that reflects management’s confidence in continued growth. The company expects net income attributable to CareTrust REIT to range between $1.36 and $1.40 per share, with normalized FFO projected between $1.69 and $1.73 per share.
The following guidance summary outlines CareTrust’s expectations for key financial metrics in 2025:
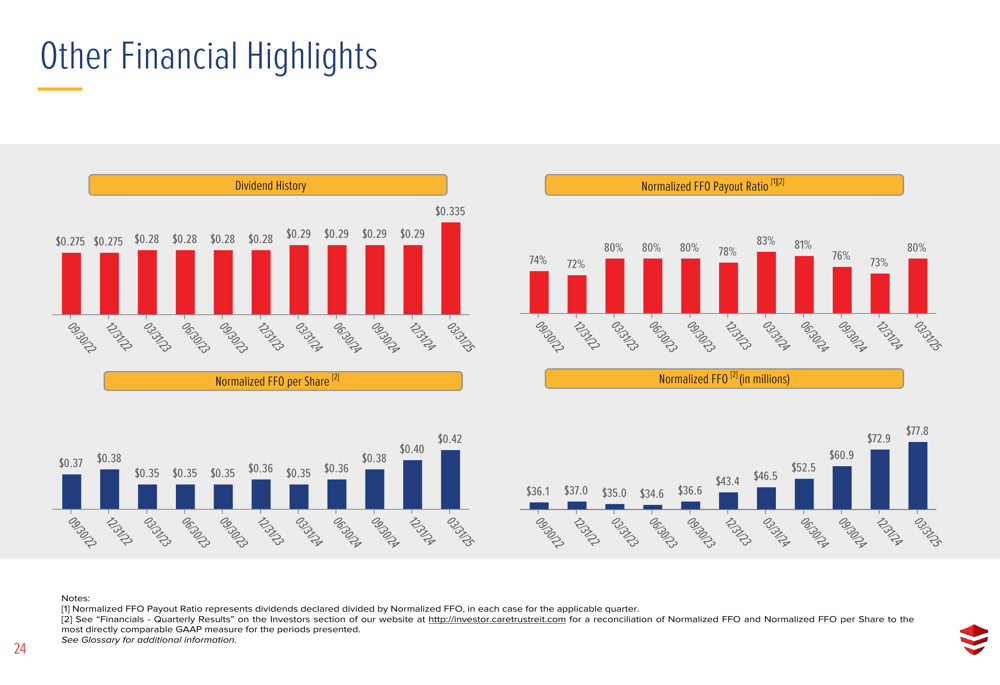
CareTrust has also maintained its commitment to shareholder returns through a consistent dividend policy. The quarterly dividend has steadily increased over time, reaching $0.335 per share as of March 31, 2025. The normalized FFO payout ratio stands at 80%, reflecting a balanced approach to returning capital to shareholders while retaining funds for future growth.
The following chart illustrates CareTrust’s dividend history and normalized FFO performance:
CareTrust REIT’s Q1 2025 results demonstrate the company’s successful execution of its growth strategy in the healthcare real estate sector. With strong year-over-year financial performance, a diversified portfolio, conservative balance sheet management, and positive guidance for 2025, CareTrust appears well-positioned to continue delivering value to shareholders while expanding its presence in the healthcare property market.
Full presentation:
This article was generated with the support of AI and reviewed by an editor. For more information see our T&C.