Fannie Mae, Freddie Mac shares tumble after conservatorship comments

Introduction & Market Context
Carvana Co. (NYSE:CVNA) has released its Q1 2025 supplemental financial tables on May 7, 2025, revealing continued strong performance with significant growth in retail unit sales and improved operational efficiency. The online used car retailer has maintained its momentum from previous quarters, building on the record-setting financial performance seen throughout 2024.
The company’s stock closed at $258.81 on the day of the presentation, with after-market trading pushing the price up 2.82% to $266.48, reflecting positive investor sentiment. Carvana’s shares have been trading near their 52-week high of $292.84, significantly above the 52-week low of $97.55.
Quarterly Performance Highlights
Carvana’s Q1 2025 results show remarkable growth in unit sales across all segments. Retail units sold reached 133,898, representing a substantial 46% increase from the 91,878 units sold in Q1 2024. This acceleration builds upon the 34% year-over-year growth reported in Q3 2024, indicating Carvana’s continued market share expansion in the used car retail space.
As shown in the following quarterly units sold data, the company has maintained consistent growth across all sales channels:
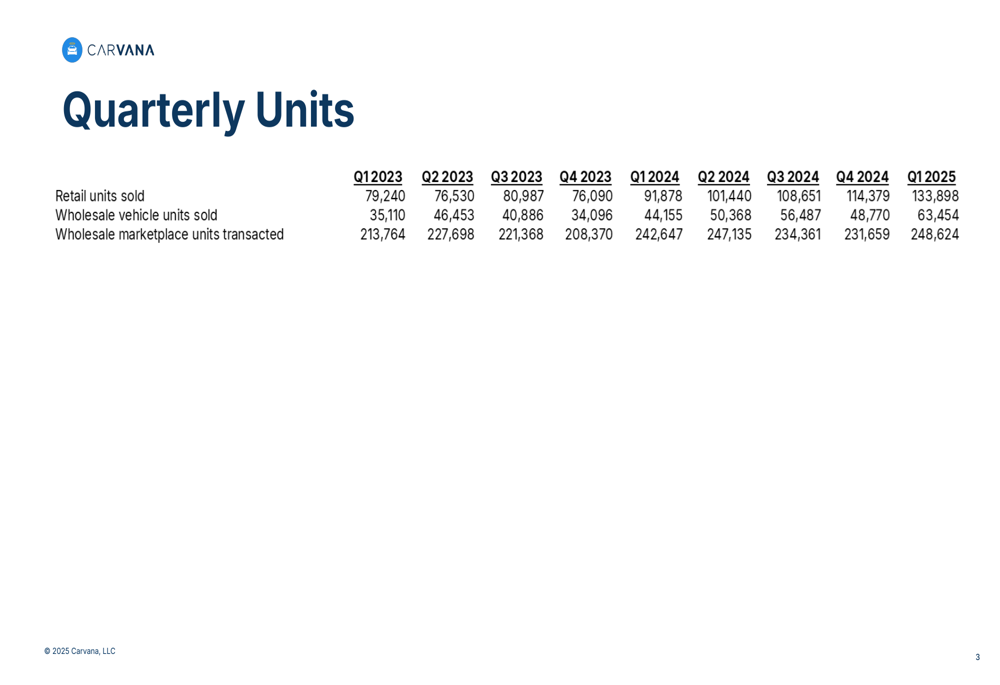
Wholesale vehicle units sold also saw significant growth, reaching 63,454 in Q1 2025, up 44% from 44,155 in Q1 2024. Meanwhile, wholesale marketplace units transacted increased to 248,624, a more modest 2.5% growth from 242,647 in Q1 2024.
Detailed Financial Analysis
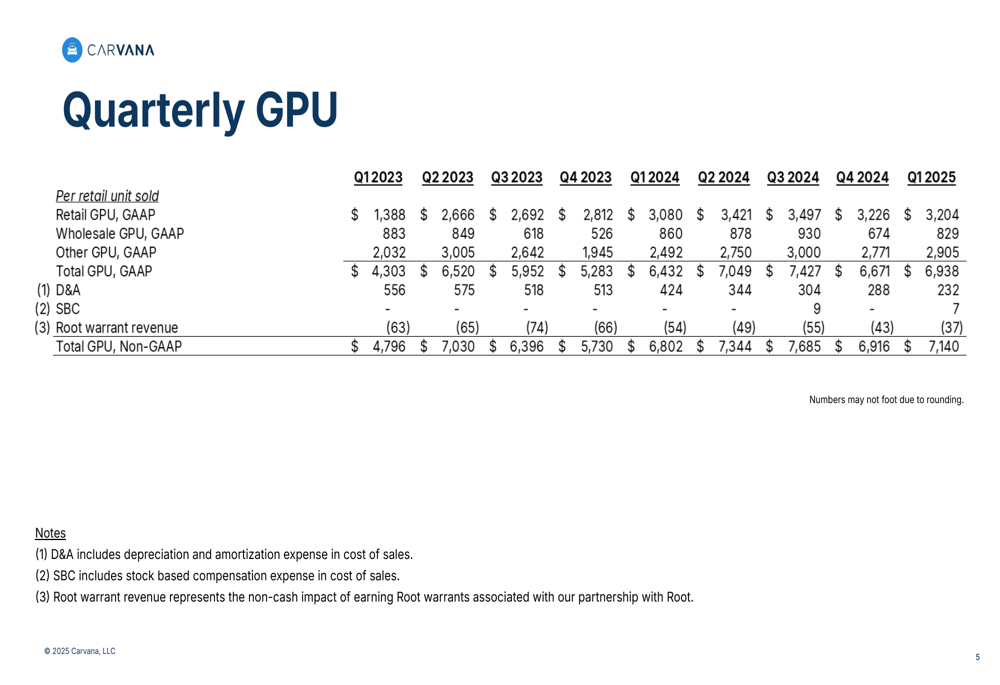
Carvana’s gross profit per unit (GPU) metrics showed improvement across most segments. Total (EPA:TTEF) GPU on a GAAP basis increased to $6,938 in Q1 2025, up $506 from $6,432 in Q1 2024. On a non-GAAP basis, total GPU rose to $7,140, a $338 increase from $6,802 in the same period last year.
The following breakdown illustrates the year-over-year changes in GPU and the key drivers behind these improvements:
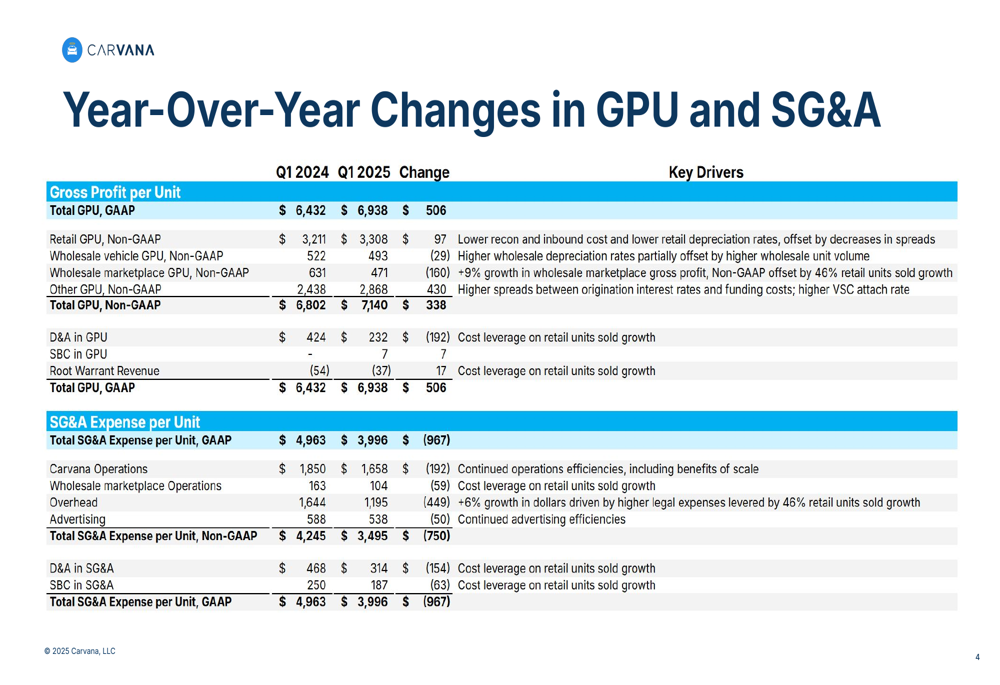
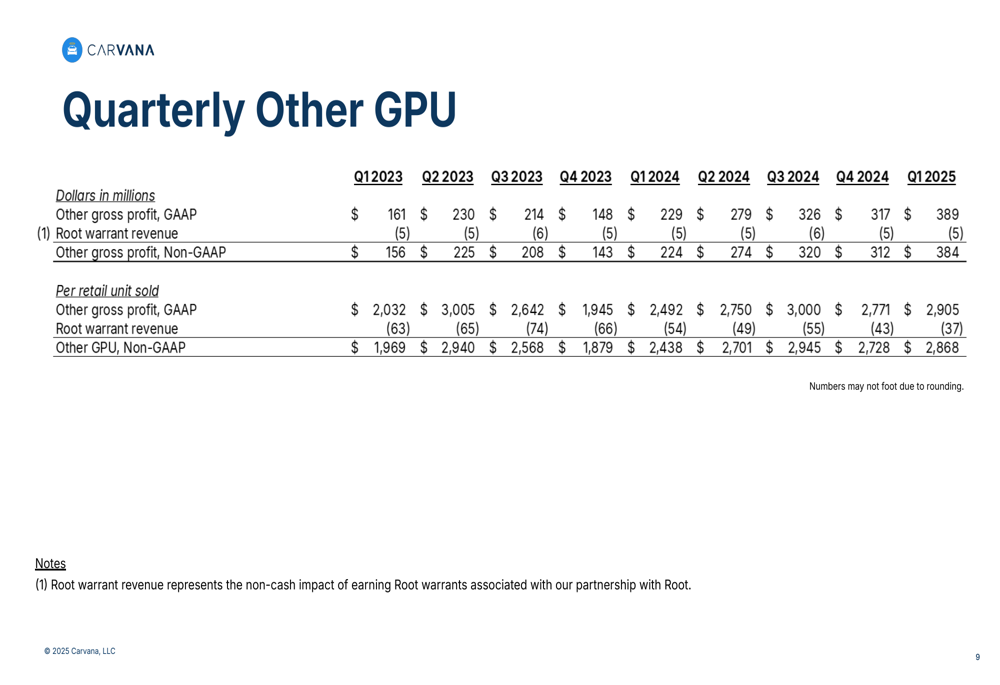
Retail GPU on a non-GAAP basis increased slightly to $3,308 in Q1 2025 from $3,211 in Q1 2024, driven by lower reconditioning and inbound costs, as well as lower retail depreciation rates, partially offset by decreases in spreads. Other GPU showed the most significant improvement, rising to $2,868 from $2,438, primarily due to higher spreads between origination interest rates and funding costs, as well as higher vehicle service contract (VSC) attach rates.
The quarterly GPU trend across all segments shows consistent performance with some seasonal fluctuations:
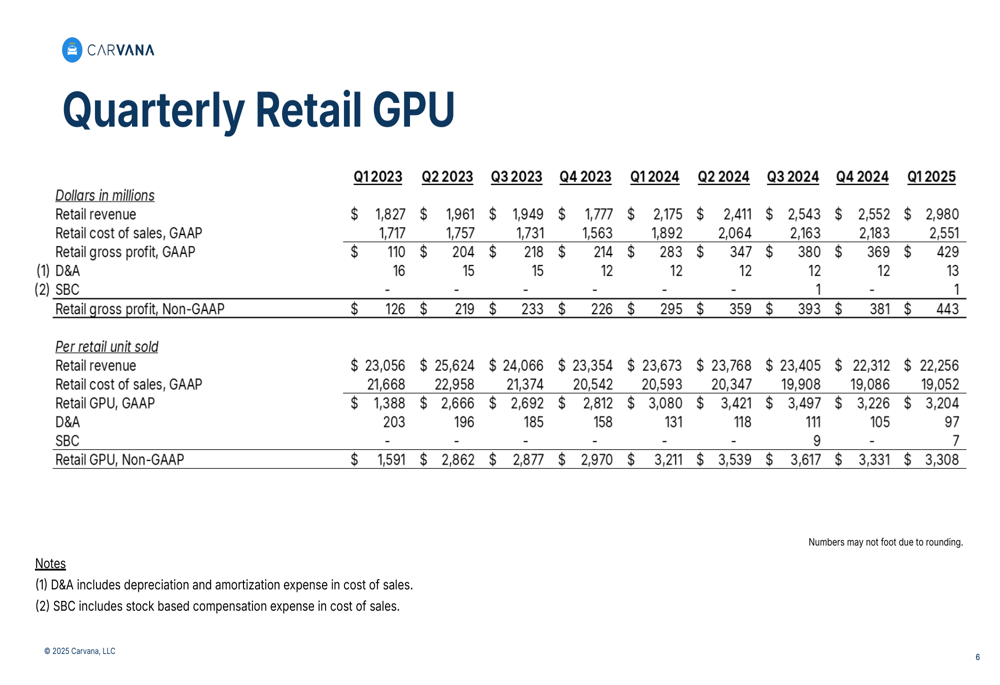
Retail revenue grew substantially to $2,980 million in Q1 2025, up 37% from $2,175 million in Q1 2024, while retail cost of sales increased to $2,551 million from $1,892 million. The detailed breakdown of retail GPU components is shown below:
Operational Efficiency
One of the most impressive aspects of Carvana’s Q1 2025 performance was the significant improvement in operational efficiency, as evidenced by the substantial reduction in SG&A expenses per retail unit. Total SG&A expenses per unit on a GAAP basis decreased to $3,996 in Q1 2025, down $967 or 19.5% from $4,963 in Q1 2024.
The following table provides a detailed breakdown of the year-over-year changes in SG&A expenses per retail unit and the key drivers behind these improvements:
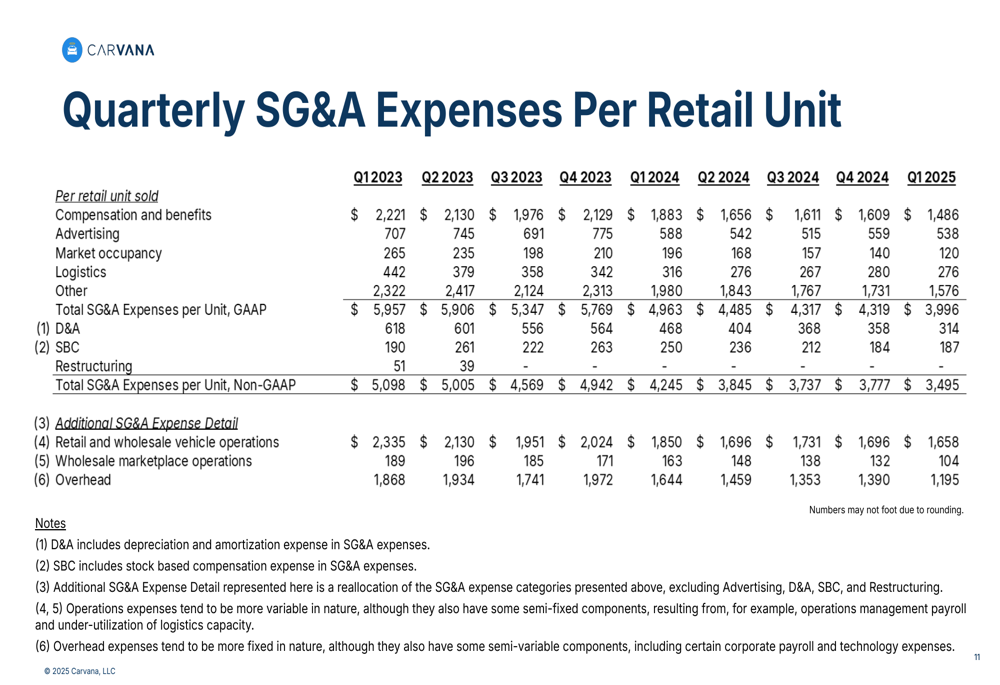
On a non-GAAP basis, SG&A expenses per unit decreased to $3,495, down $750 or 17.7% from $4,245 in Q1 2024. This reduction was driven by continued operational efficiencies, including benefits of scale across multiple expense categories:
1. Compensation and benefits per unit decreased by $397 to $1,486
2. Advertising expenses per unit decreased by $50 to $538
3. Market occupancy costs per unit decreased by $76 to $120
4. Logistics expenses per unit decreased by $40 to $276
5. Other expenses per unit decreased by $404 to $1,576
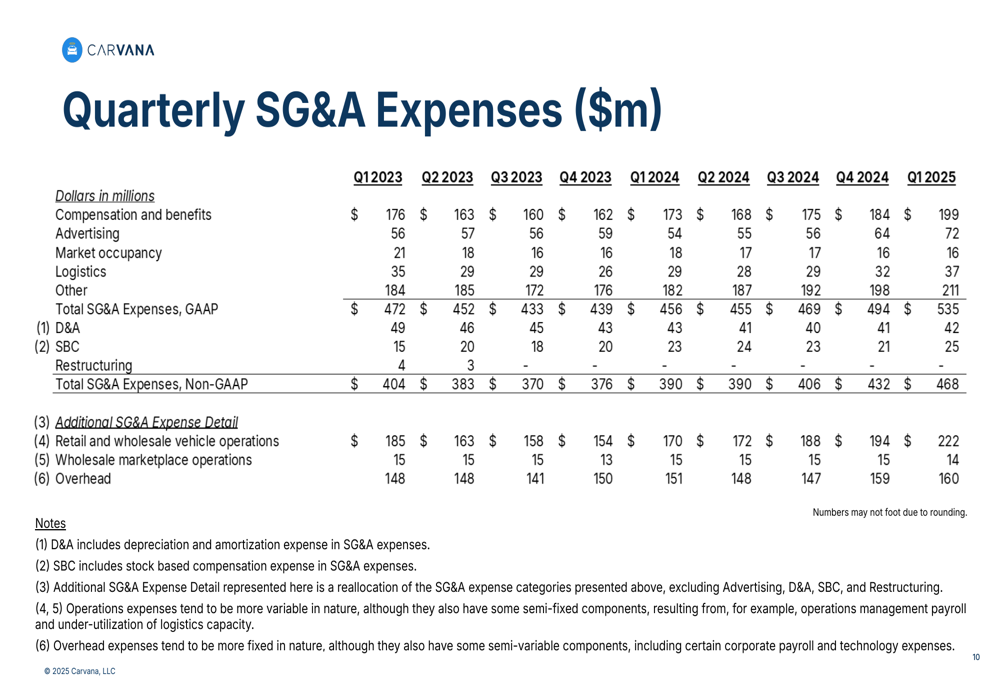
In absolute terms, total SG&A expenses increased to $535 million in Q1 2025 from $456 million in Q1 2024, reflecting the company’s growth, but the per-unit metrics demonstrate significant operational leverage as Carvana scales its business:
Wholesale and Other Business Segments
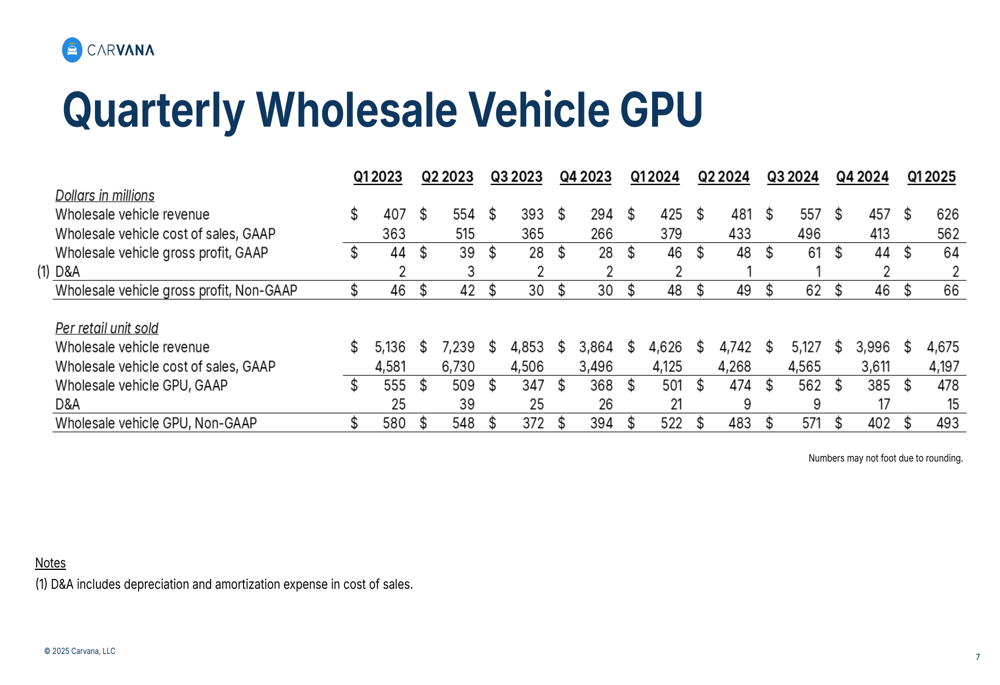
Carvana’s wholesale vehicle business also showed strong performance in Q1 2025. Wholesale vehicle revenue increased to $626 million from $425 million in Q1 2024, while gross profit rose to $64 million from $46 million. However, wholesale vehicle GPU on a non-GAAP basis decreased slightly to $493 from $522, primarily due to higher wholesale depreciation rates, partially offset by higher wholesale unit volume.
The detailed breakdown of wholesale vehicle GPU components is shown below:
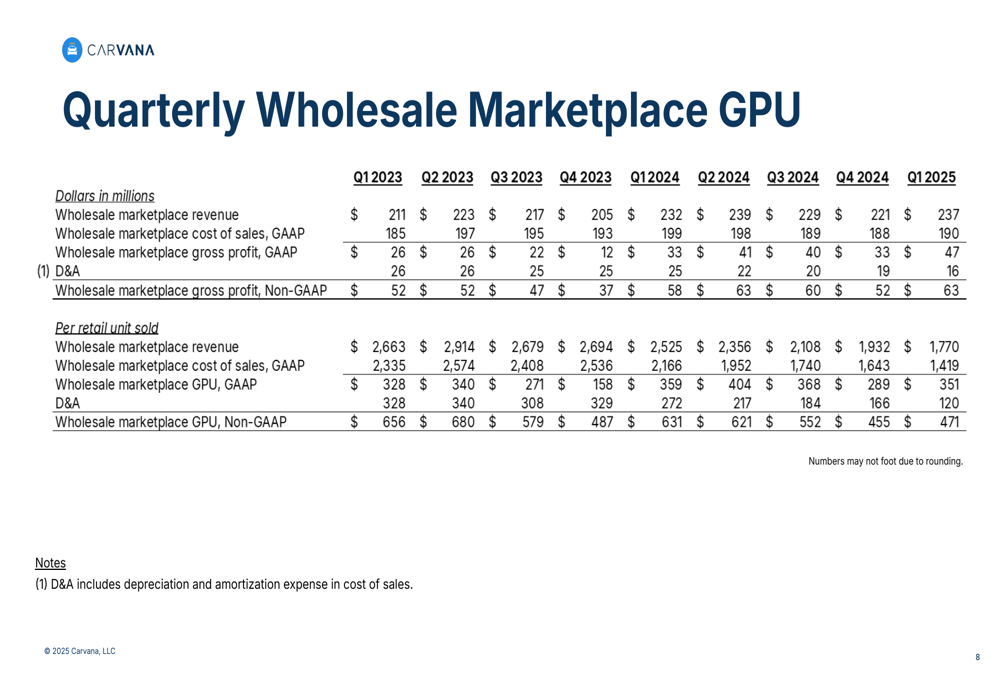
The wholesale marketplace segment, which facilitates transactions between dealers, generated $237 million in revenue in Q1 2025, up from $232 million in Q1 2024. Gross profit increased to $47 million from $33 million, though GPU on a non-GAAP basis decreased to $471 from $631, primarily due to the dilutive effect of the 46% growth in retail units sold.
Other revenue sources, which include financing and vehicle service contracts, continued to be a significant contributor to Carvana’s profitability. Other gross profit on a GAAP basis increased to $389 million in Q1 2025 from $229 million in Q1 2024, while other GPU on a non-GAAP basis rose to $2,868 from $2,438.
Forward-Looking Implications
Carvana’s Q1 2025 results demonstrate the company’s continued execution of its strategy focused on operational excellence and growth. The significant improvements in SG&A efficiency suggest that Carvana is successfully leveraging its scale to drive down costs per unit, which should support sustained profitability.
The 46% growth in retail units sold indicates that Carvana continues to gain market share in the used car market. Based on previous earnings information, the company has sold over 2 million cars to date but has captured only about 1% of the $1 trillion used car market, suggesting substantial room for continued expansion.
The company’s infrastructure is reportedly capable of supporting over 1 million retail units annually, with plans to scale operations to handle up to 3 million units per year, which would represent approximately 7.5% market share. With the current growth trajectory and operational improvements, Carvana appears well-positioned to continue its expansion in the used car retail space.
As Carvana continues to integrate ADESA assets and improve its logistics network, further efficiency gains could be realized through reduced shipping distances and improved delivery processes, potentially driving additional improvements in both GPU and SG&A expenses per unit in future quarters.
Full presentation:
This article was generated with the support of AI and reviewed by an editor. For more information see our T&C.