U.S. stocks surge; investors buoyed by progress towards ending government shutdown

Introduction & Market Context
CGI Inc. (NYSE:GIB) presented its third-quarter fiscal 2025 results on July 30, 2025, showcasing strong revenue growth despite facing some profitability challenges. The IT and business consulting services provider reported an 11.4% increase in revenue while experiencing pressure on several margin metrics. CGI’s stock closed at $87.10 on October 31, 2025, with a slight 0.11% decline, though it showed modest gains of 0.78% in aftermarket trading.
The company, which employs 93,000 consultants and professionals globally, continues to leverage its diversified business model across multiple geographies and industry sectors as it navigates a competitive landscape increasingly focused on AI implementation and managed services.
Quarterly Performance Highlights
CGI delivered revenue of $4.09 billion in Q3 fiscal 2025, representing an 11.4% year-over-year increase, with constant currency growth of 7.0%. While top-line growth remained robust, the company faced some profitability challenges, with earnings before income taxes declining 7.1% to $552 million, representing a margin of 13.5% (down 270 basis points from Q3 2024).
As shown in the following financial highlights chart:
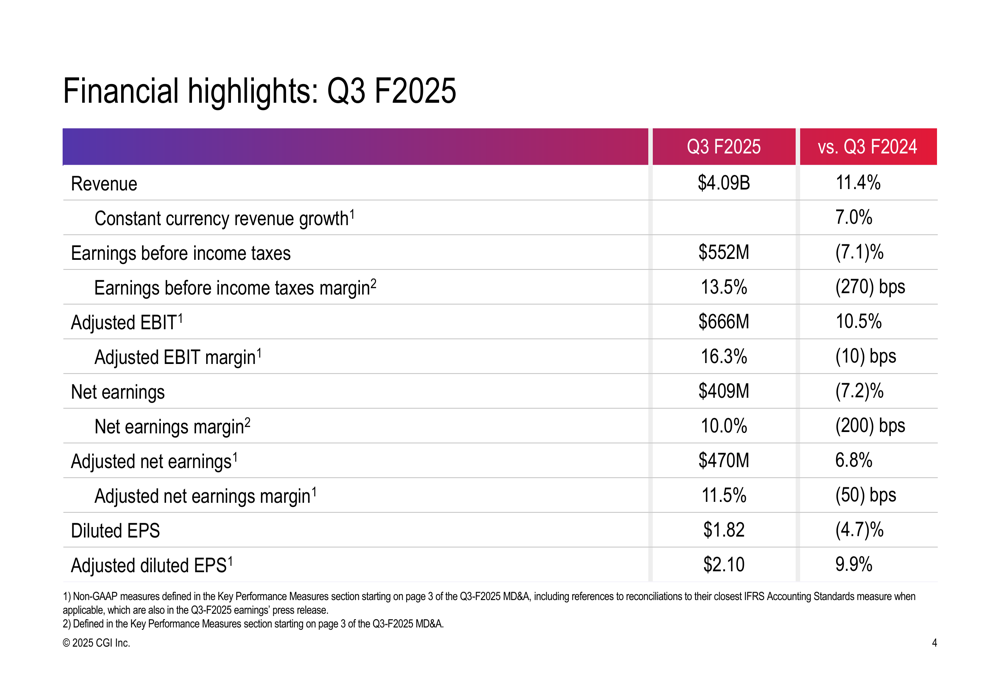
The company’s adjusted EBIT increased 10.5% to $666 million, though the adjusted EBIT margin contracted slightly by 10 basis points to 16.3%. Diluted earnings per share decreased 4.7% to $1.82, while adjusted diluted EPS grew 9.9% to $2.10.
François Boulanger, CGI’s President and Chief Executive Officer, emphasized the company’s strong revenue performance and its focus on AI initiatives: "CGI delivered double-digit revenue growth in the third quarter. We remain focused on managing business fundamentals to deepen resilience and continued profitable growth as a trusted transformation partner."
Detailed Financial Analysis
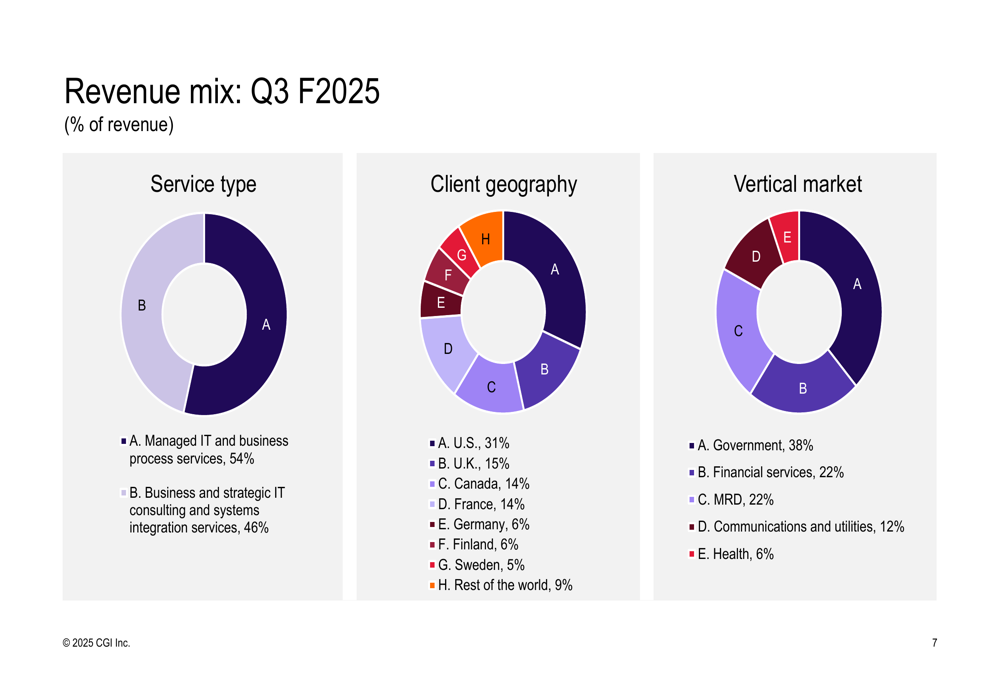
CGI’s revenue mix demonstrates the company’s diversified business model, with 54% of revenue coming from managed IT and business process services, while 46% is derived from business and strategic IT consulting and systems integration services. Geographically, the United States remains CGI’s largest market at 31% of revenue, followed by the United Kingdom (15%), Canada (14%), and France (14%).
The following chart illustrates CGI’s revenue diversification:
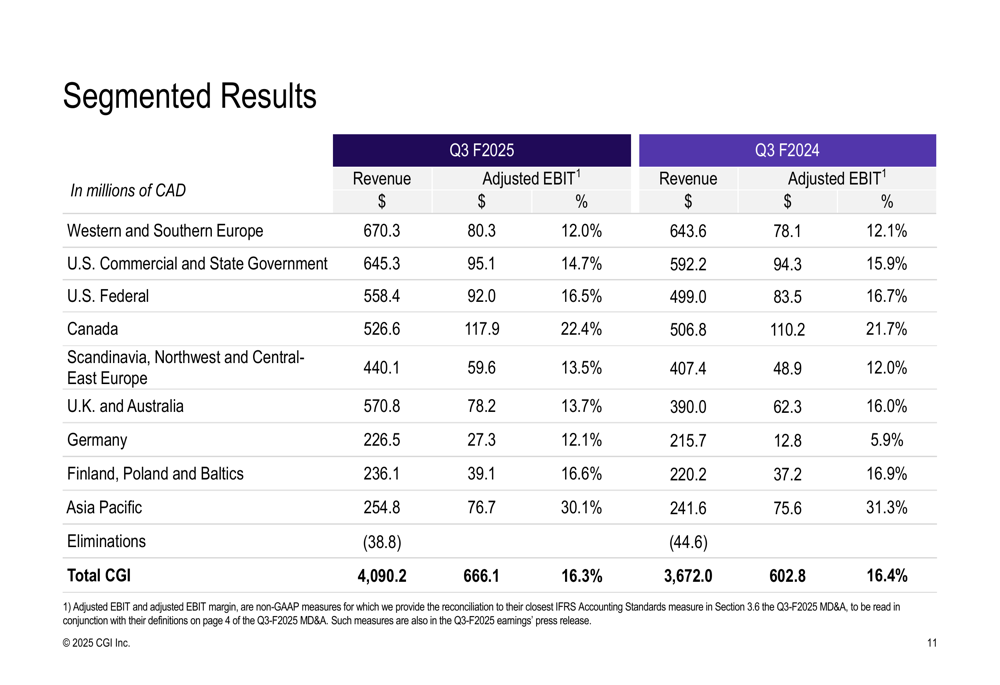
When examining performance by segment, most regions showed revenue growth, though with varying profitability outcomes. The U.K. and Australia segment demonstrated particularly strong revenue growth of 46.4%, while Germany showed significant margin improvement, increasing its adjusted EBIT margin from 5.9% to 12.1%.
The detailed segmented results provide insight into regional performance:
The company’s book-to-bill ratio stood at 101.4% for the quarter and 106.7% for the trailing twelve months, indicating a healthy pipeline of future business. Of the $4.1 billion in new bookings during Q3, 70% came from extensions, renewals, and add-ons, while 30% represented new business.
Strategic Initiatives and Outlook
CGI continues to position itself as a leader in digital transformation, with particular emphasis on AI-related solutions. According to the earnings call transcript, AI initiatives now account for approximately 40% of CGI’s IP base revenue, highlighting the company’s commitment to emerging technologies.
The company’s global delivery model remains a strategic advantage, with its workforce distributed across client proximity (64%), nearshore/onshore delivery centers (13%), and global delivery centers (23%) including locations in India, Philippines, and Morocco.
The following chart shows CGI’s global talent distribution:
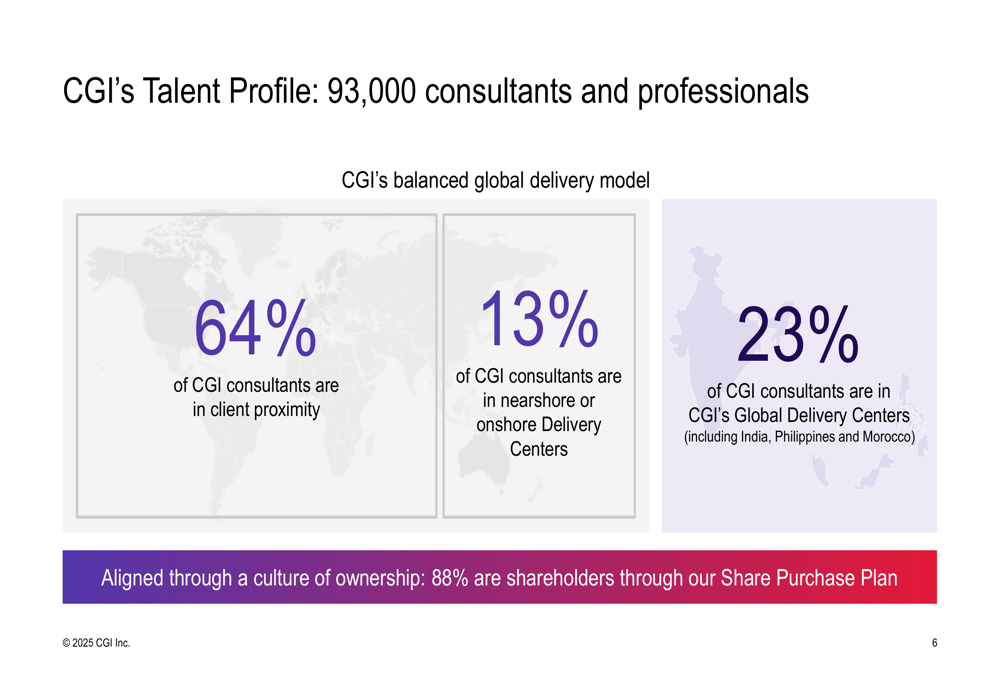
CGI’s strong employee ownership culture continues to be a cornerstone of its business model, with 88% of employees participating as shareholders through the company’s Share Purchase Plan, aligning employee interests with corporate performance.
Debt and Cash Flow Analysis
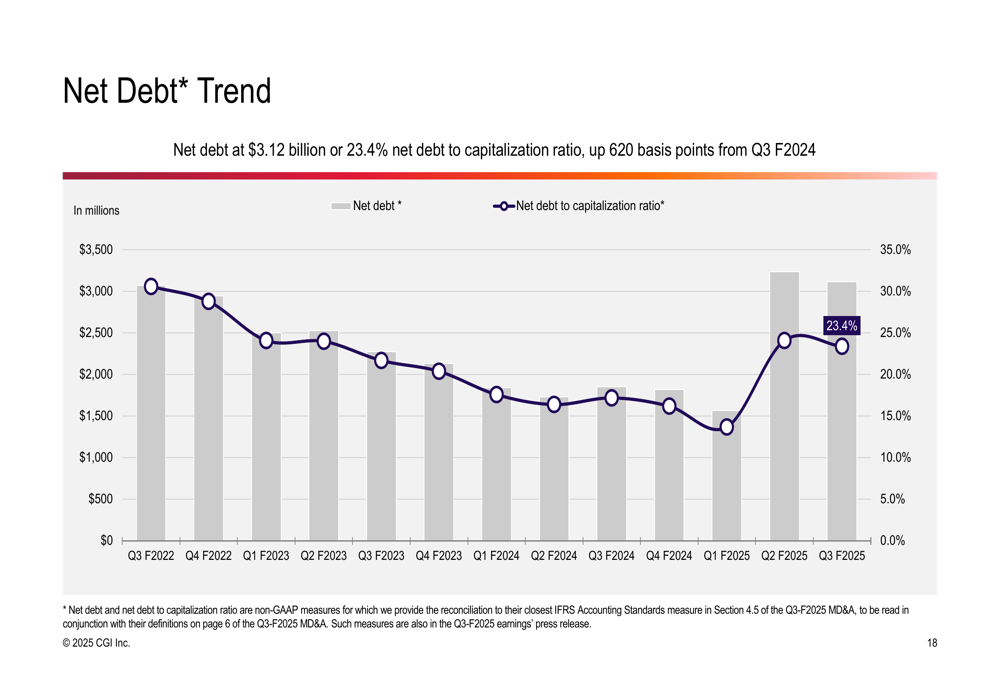
While CGI maintained strong revenue growth, its debt levels have increased substantially. Long-term debt and lease liabilities reached $4.24 billion, up $1.20 billion from Q3 F2024. Net debt stood at $3.12 billion, representing a net debt to capitalization ratio of 23.4%, an increase of 620 basis points from the previous year.
The following chart illustrates CGI’s rising net debt trend:
Despite the increased debt load, CGI generated $487 million in cash from operating activities during the quarter (11.9% of revenue), compared to $497 million in the same period last year. Over the trailing twelve months, cash from operations totaled $2.20 billion, representing 14.1% of revenue.
The company’s return on invested capital declined to 14.6% from 16.1% in the prior year period, reflecting the impact of higher debt levels and recent acquisitions. According to the earnings call transcript, CGI is incurring approximately $100 million in restructuring costs for fiscal 2025 as it integrates recent acquisitions and optimizes operations.
As CGI continues to balance growth investments with profitability, investors will be watching closely to see if the company can translate its strong revenue growth into improved margins and returns in coming quarters, particularly as it further develops its AI capabilities and manages its increasing debt levels.
Full presentation:
This article was generated with the support of AI and reviewed by an editor. For more information see our T&C.