Oracle stock falls after report reveals thin margins in AI cloud business

Chart Industries , Inc. (NYSE:GTLS) reported strong first-quarter results on May 1, 2025, showing significant improvement from the previous quarter’s disappointing performance. The industrial gas equipment manufacturer posted robust order growth, margin expansion, and a record backlog, signaling strong demand across its diverse end markets.
Quarterly Performance Highlights
Chart Industries reported first-quarter orders of $1,315.6 million, representing a 17.3% increase year-over-year, driven by strong demand across multiple sectors. This robust order intake pushed the company’s backlog to a record $5,143.6 million, marking the first time it has exceeded $5 billion.
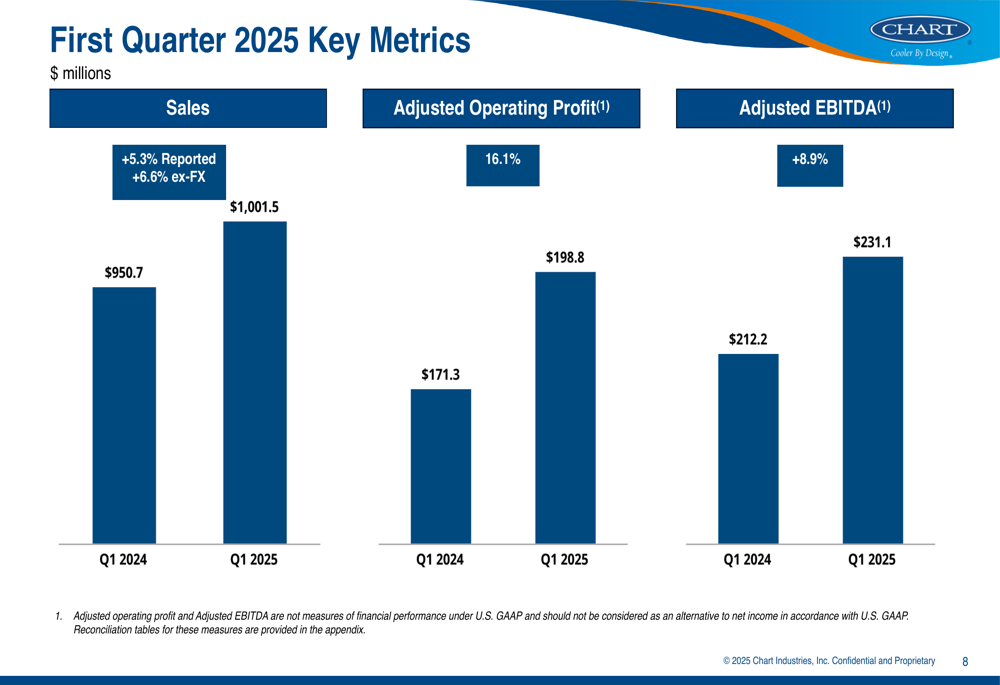
As shown in the following chart of quarterly financial metrics, Chart achieved sales of $1,001.5 million in Q1 2025, a 5.3% increase from the prior year (6.6% excluding foreign exchange impacts):
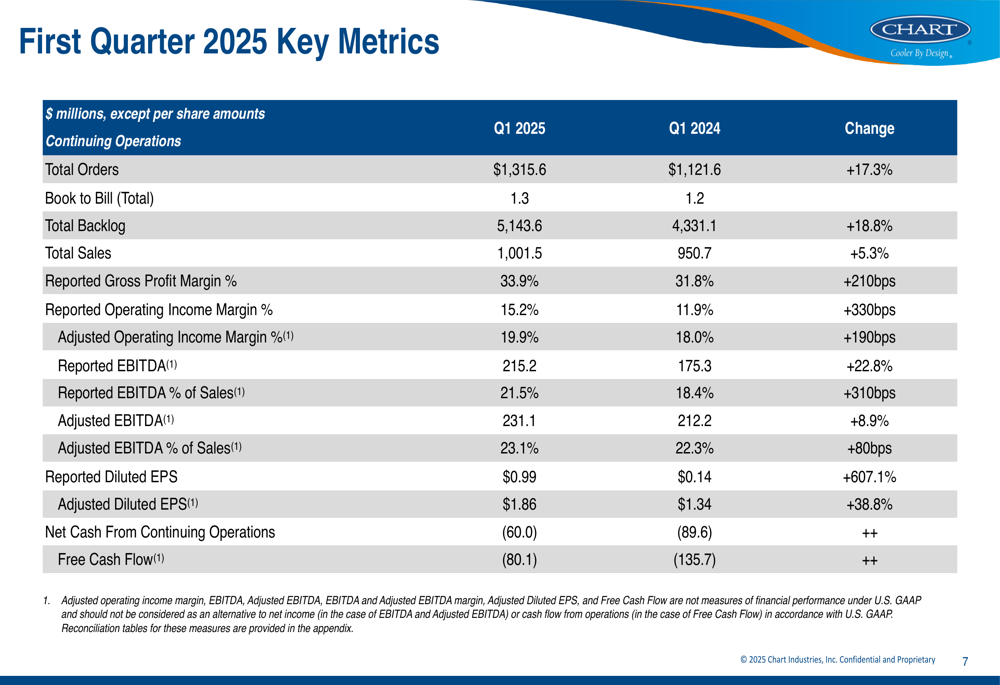
The company’s profitability metrics showed significant improvement, with adjusted operating income margin expanding 190 basis points to 19.9% and adjusted EBITDA increasing 8.9% to $231.1 million. Adjusted EBITDA margin rose 80 basis points to 23.1%.
Chart’s adjusted diluted earnings per share jumped 38.8% to $1.86 compared to $1.34 in Q1 2024, reflecting the company’s operational improvements and stronger margins. This performance represents a notable rebound from Q4 2024, when Chart missed analyst expectations with EPS of $2.66 against a forecast of $3.15.
The following chart illustrates the company’s sales, adjusted operating profit, and adjusted EBITDA growth:
While free cash flow remained negative at -$80.1 million in Q1 2025, it showed substantial improvement from -$135.7 million in the same period last year. The company’s net leverage ratio stood at 2.91x as of March 31, 2025, up slightly from 2.80x at year-end 2024 but down from 3.35x in Q1 2024.
Segment Performance
Chart’s performance varied across its four business segments, with particularly strong results in Heat Transfer Systems and Specialty Products.
The Heat Transfer Systems segment saw sales growth driven by backlog conversion, with margins improving due to manufacturing efficiencies and favorable SG&A leverage. Specialty Products reported strong orders driven by international HLNG (Helium Liquefied Natural Gas (OTC:LNGLF)) and sales growth from backlog conversion with increased efficiency.
The following table details the performance across all segments:
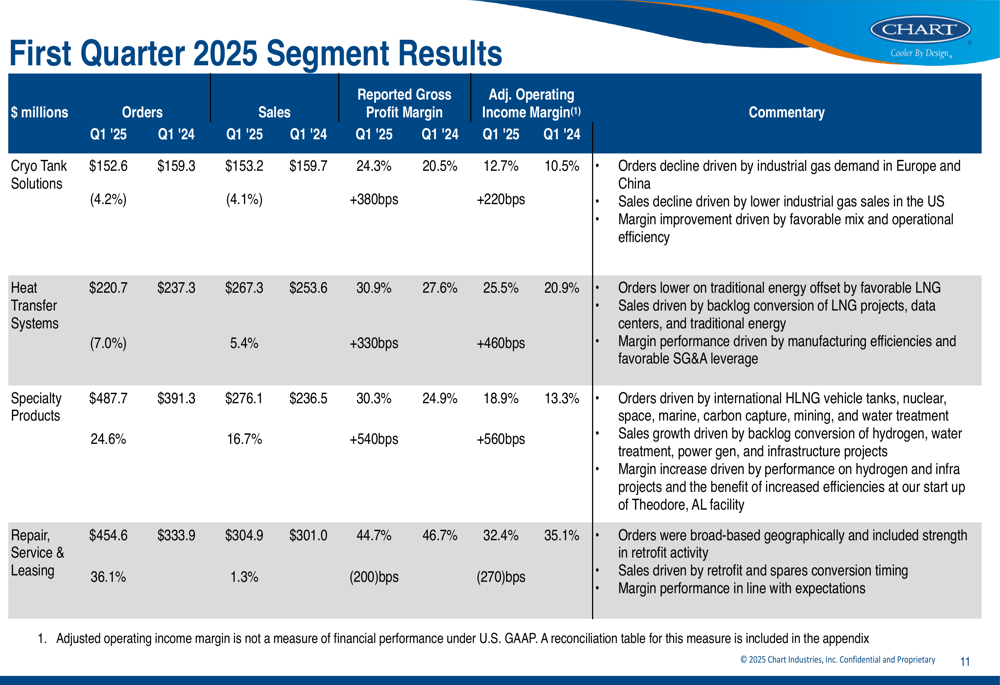
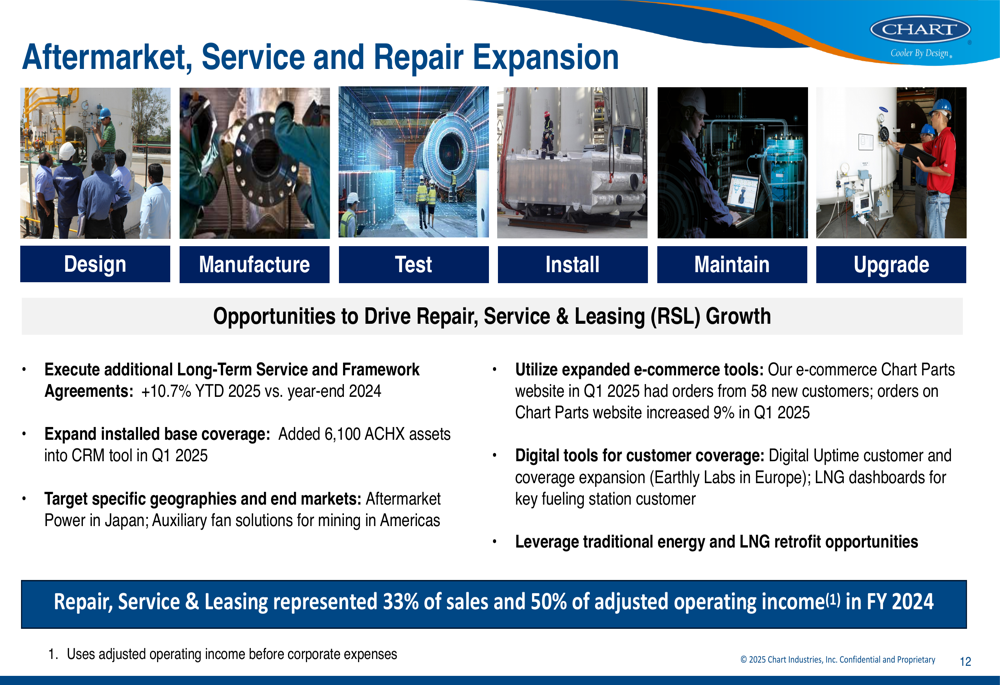
The Repair, Service & Leasing segment continued to be a significant contributor to Chart’s profitability, representing 33% of sales and 50% of adjusted operating income in fiscal year 2024. The company is actively expanding this high-margin business through several initiatives.
As illustrated in the following slide, Chart is pursuing multiple avenues to drive aftermarket growth:
Strategic Initiatives
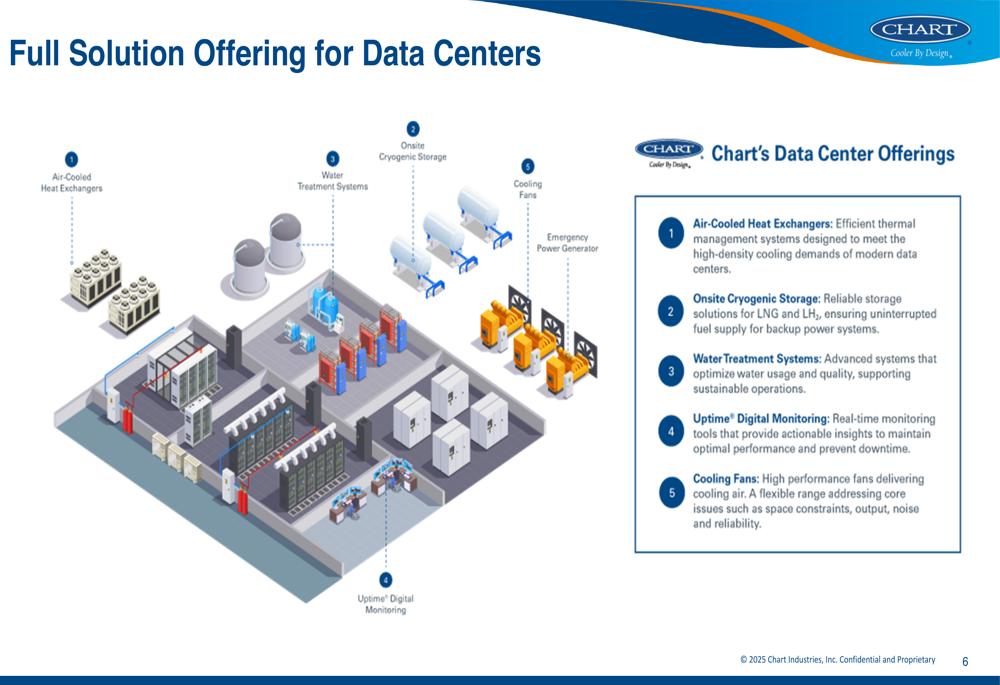
Chart Industries is strategically positioning itself in high-growth markets, with particular focus on data centers. The company’s comprehensive solution offering for data centers includes air-cooled heat exchangers, onsite cryogenic storage, water treatment systems, cooling fans, and digital monitoring tools.
The following image illustrates Chart’s full solution offering for data centers:
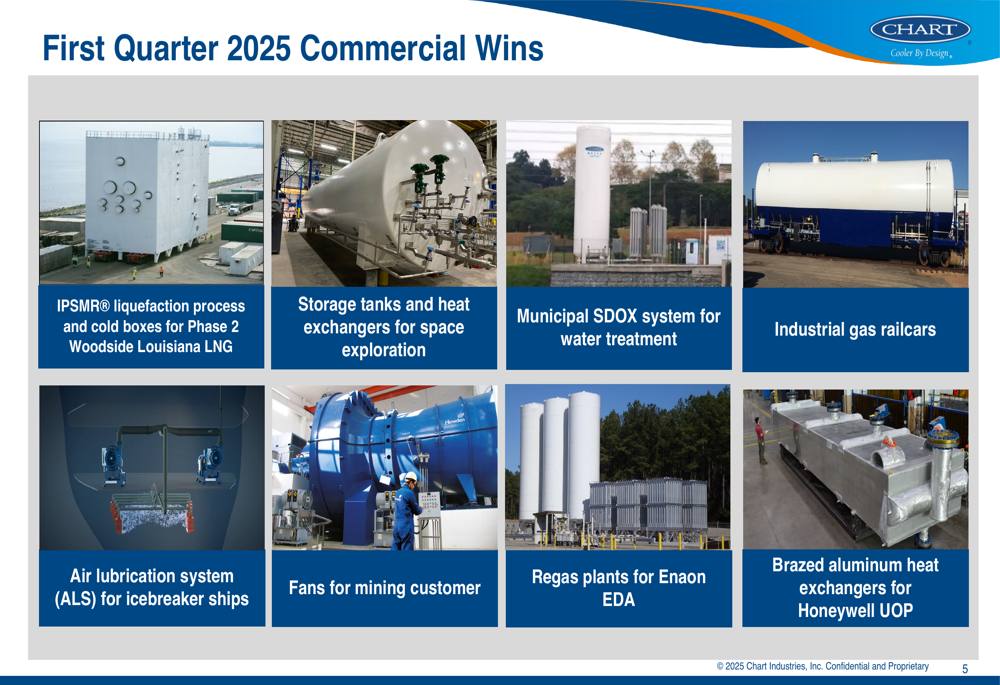
The company also highlighted several commercial wins during the first quarter, demonstrating the diversity of its business across multiple end markets. These wins included IPSMR® liquefaction process and cold boxes for Woodside (OTC:WOPEY) Louisiana LNG, air lubrication systems for icebreaker ships, storage tanks for space exploration, and fans for mining customers.
Chart’s commercial success spans multiple industries as shown here:
The company is also actively addressing tariff challenges, which are estimated to have a total impact of approximately $50 million. Chart is mitigating these impacts through regional and global supply chains, manufacturing products in multiple locations, adjusting long-term agreements, and implementing price increases.
Outlook & Guidance
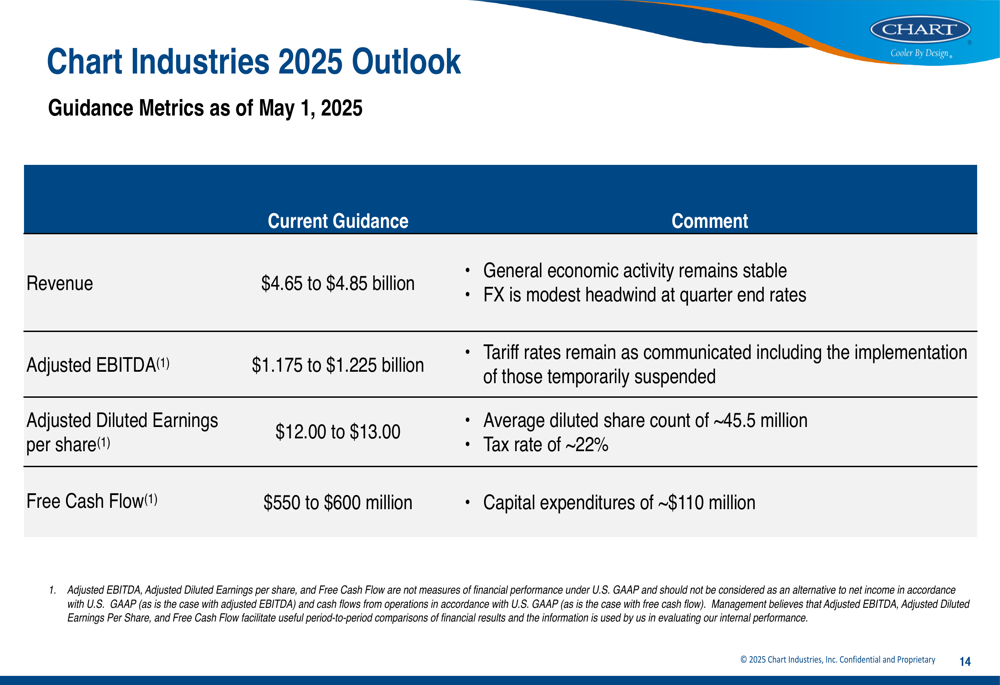
Chart Industries maintained a positive outlook for 2025, projecting revenue between $4.65 billion and $4.85 billion and adjusted EBITDA between $1.175 billion and $1.225 billion. The company expects adjusted diluted earnings per share to range from $12.00 to $13.00, with free cash flow projected at $550 million to $600 million.
The following slide details Chart’s 2025 outlook:
The company’s capital allocation strategy remains focused on debt reduction, with a target of generating over $550 million in free cash flow to achieve its net leverage ratio target of 2.0 to 2.5x. Chart reiterated that until it reaches this target, it will not pursue material cash acquisitions or share repurchases.
"We anticipate growth across each of the four segments in 2025 when compared to 2024," CEO Jill Evankov stated during the earnings call, highlighting the expanding pipeline of LNG opportunities and the company’s increased capacity.
Chart’s stock has shown volatility in recent months, dropping 4.14% following its Q4 2024 earnings miss. However, the stock was up 1.09% in premarket trading following the Q1 2025 results announcement, suggesting a positive reception to the improved performance and outlook.
Full presentation:
This article was generated with the support of AI and reviewed by an editor. For more information see our T&C.