Durable Goods (Jun F) -9.4% vs 9.3% Prior, Ex-Trans 0.2% vs 0.2%

Introduction & Market Context
Colliers International Group (NASDAQ:CIGI) released its second quarter 2025 results on July 31, showcasing strong overall performance with total revenue reaching $1.35 billion, an 18% increase compared to the same period in 2024. The company’s diversified business model appears to be paying dividends, with particularly robust growth in its Engineering segment offsetting more modest performance in other areas.
The real estate services provider closed at $147.76 on July 30, 2025, down 0.57% ahead of the earnings release, but still trading near its 52-week high of $156.96, reflecting investor confidence in the company’s growth trajectory.
Quarterly Performance Highlights
Colliers reported significant growth in key adjusted metrics for Q2 2025, including a 16% increase in adjusted EBITDA to $180.2 million and a 26% jump in adjusted earnings per share to $1.72. However, GAAP operating earnings declined 14% to $99.2 million, and GAAP diluted EPS fell sharply by 89% to $0.08, highlighting a substantial gap between adjusted and GAAP performance measures.
As shown in the following comprehensive financial overview:
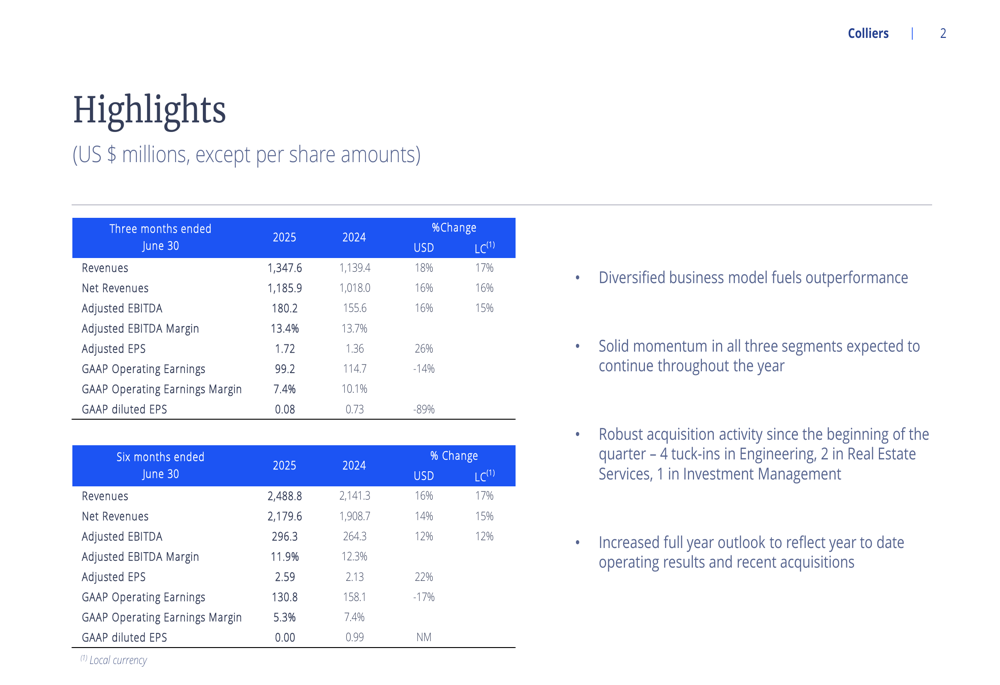
The company’s net revenues (after subtracting subconsultant and other direct costs) grew 16% to $1.19 billion. While adjusted EBITDA margin remained relatively stable at 13.4% compared to 13.7% in the prior year, GAAP operating earnings margin contracted significantly from 10.1% to 7.4%.
Segment Performance Analysis
Colliers’ business is increasingly diversified across three main segments: Real Estate Services, Engineering, and Investment Management. The Engineering segment was the standout performer in Q2 2025, with revenue surging 67% year-over-year to $436.0 million, primarily driven by acquisitions.
The following chart illustrates the consolidated revenue breakdown by segment:
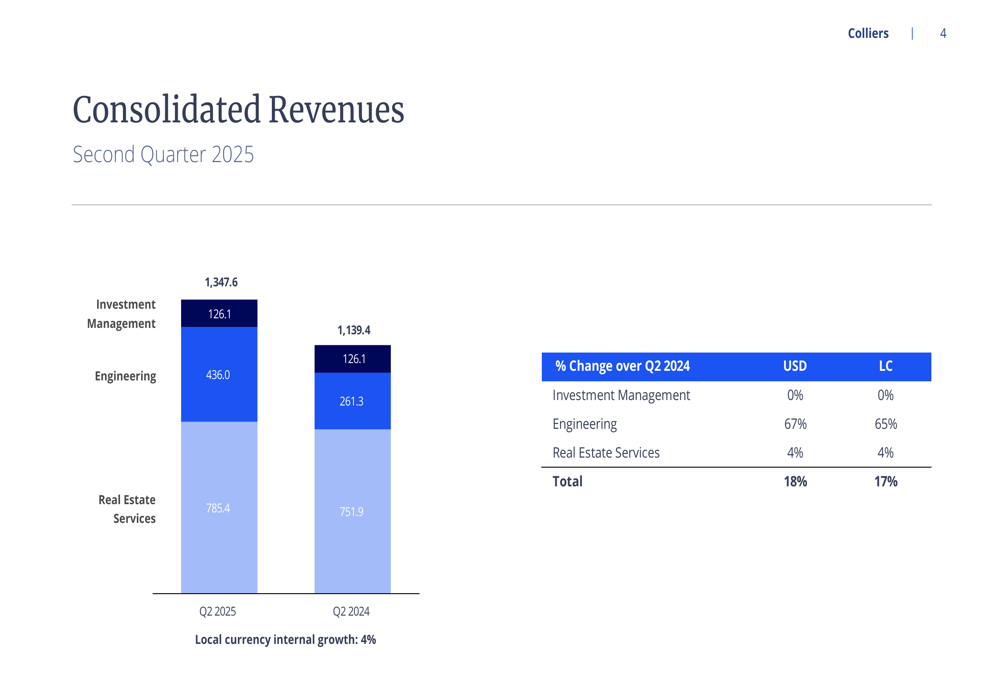
Real Estate Services, still the largest segment at 58% of total revenue, grew modestly at 4% compared to Q2 2024, reaching $785.4 million. Within this segment, Capital Markets revenue increased by 17% to $213.6 million, while Leasing revenue declined slightly to $273.5 million. Outsourcing services grew by 8% to $243.8 million.
The Engineering segment’s detailed performance shows remarkable growth in both revenue and profitability:
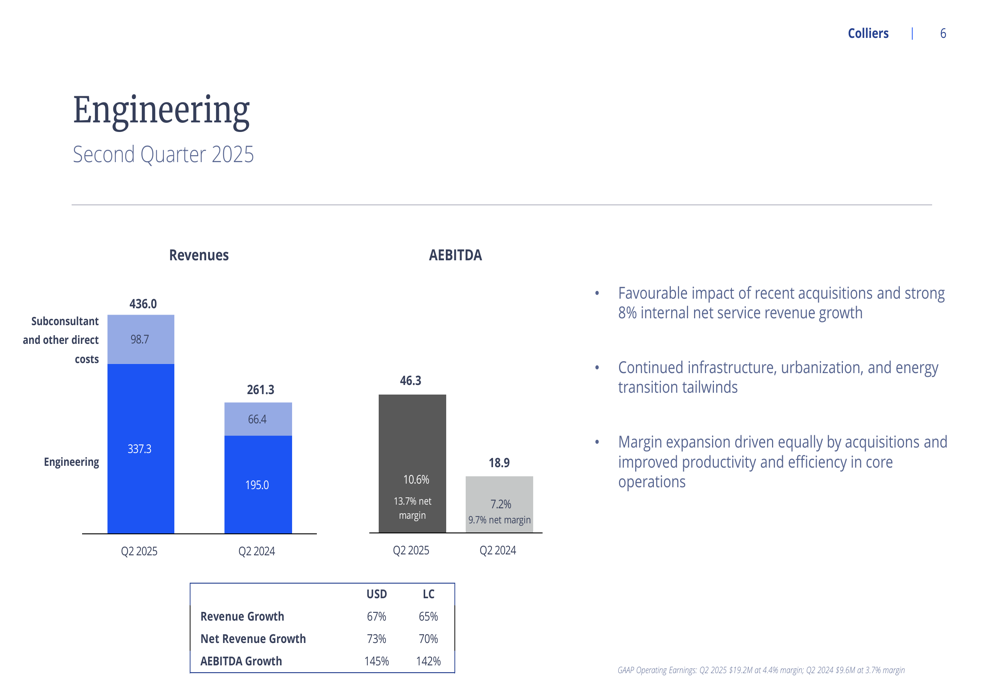
Engineering’s adjusted EBITDA more than doubled, growing 145% to $46.3 million, with margins expanding from 7.2% to 10.6%. The company attributed this growth to recent acquisitions and improved productivity, supported by ongoing infrastructure, urbanization, and energy transition tailwinds.
Meanwhile, the Investment Management segment showed flat revenue at $126.1 million but experienced a 7% decline in net revenue and a 1% decrease in adjusted EBITDA:
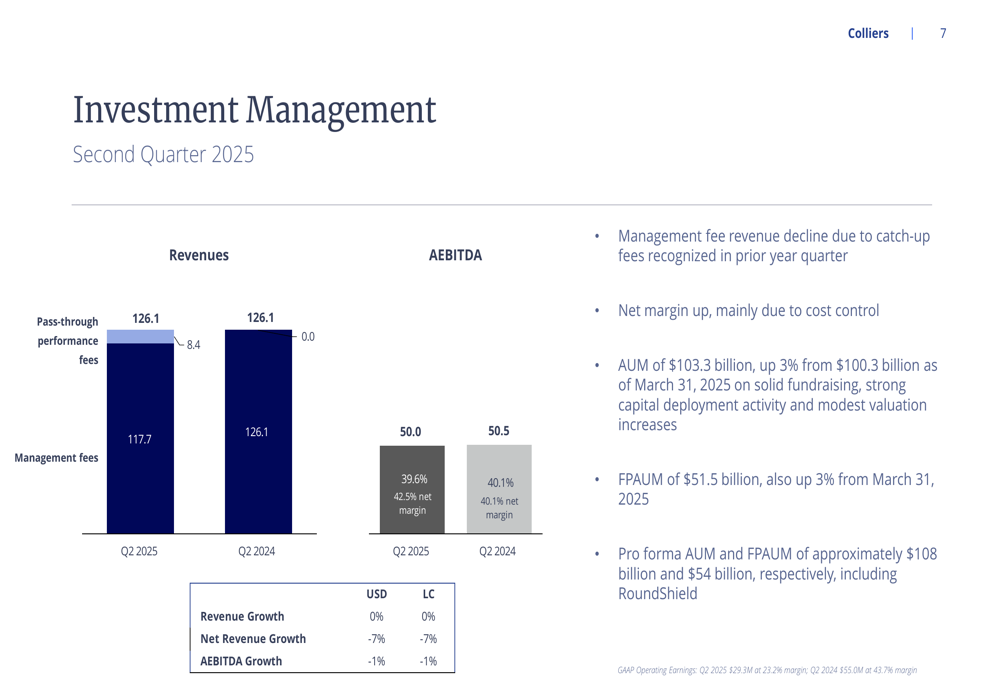
Despite these challenges, the Investment Management segment maintained the highest profit margin among all segments at 39.6%, though slightly down from 40.1% in Q2 2024. Assets under management grew to $103.3 billion, up 3% from the previous quarter.
Business Diversification Strategy
Colliers’ strategic diversification is evident in the changing composition of its revenue and earnings. The company now derives 64% of its revenue and 71% of its adjusted EBITDA from recurring sources, providing greater stability to its business model.
The following pie charts demonstrate how the company’s revenue and EBITDA are distributed across segments:
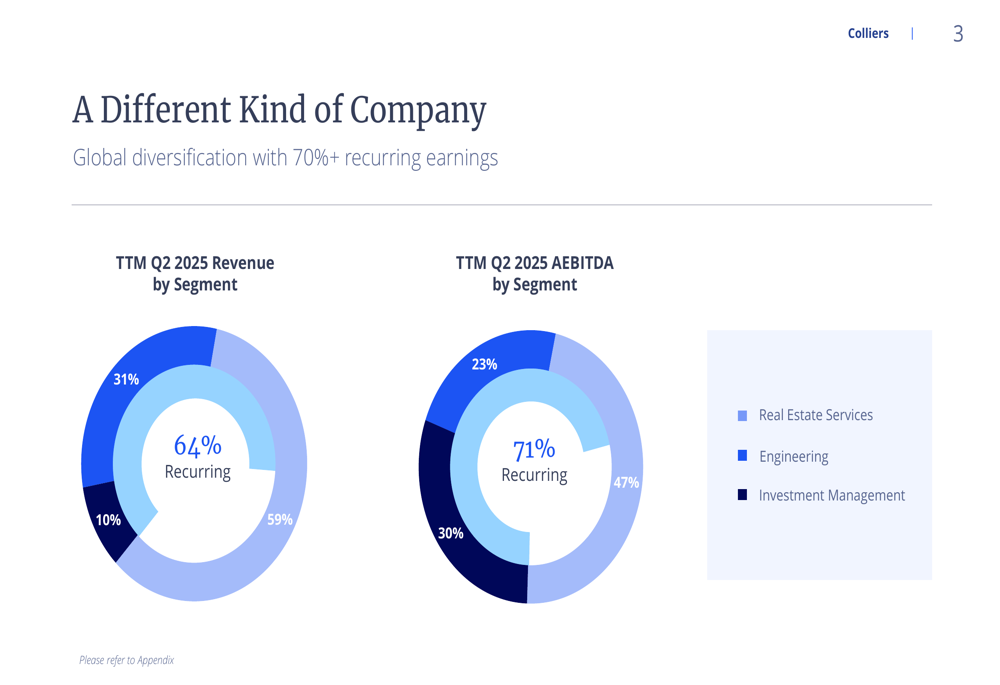
While Real Estate Services remains the largest contributor to revenue at 59%, its share of adjusted EBITDA is proportionally smaller at 47%. Conversely, Investment Management generates just 10% of revenue but contributes 23% of adjusted EBITDA, reflecting its higher-margin nature. The Engineering segment now accounts for 31% of revenue and 30% of adjusted EBITDA, showing significant growth from previous years.
Financial Position
As of June 30, 2025, Colliers reported a net debt of $1.56 billion and a leverage ratio of 2.3x net debt to pro forma adjusted EBITDA. The company maintains approximately $900 million in available liquidity after closing the RoundShield acquisition.
Capital expenditures for the first half of 2025 totaled $31.1 million, with full-year capex expected to be between $100-115 million. Acquisition spending reached $111.0 million in the first six months of 2025, reflecting the company’s continued focus on inorganic growth, particularly in the Engineering segment.
Updated 2025 Outlook
Based on strong first-half performance, Colliers has increased its full-year 2025 outlook across all segments. The company now projects low-teens percentage revenue growth, mid-teens adjusted EBITDA growth, and mid to high-teens adjusted EPS growth for the consolidated business.
The following table details the updated outlook by segment:
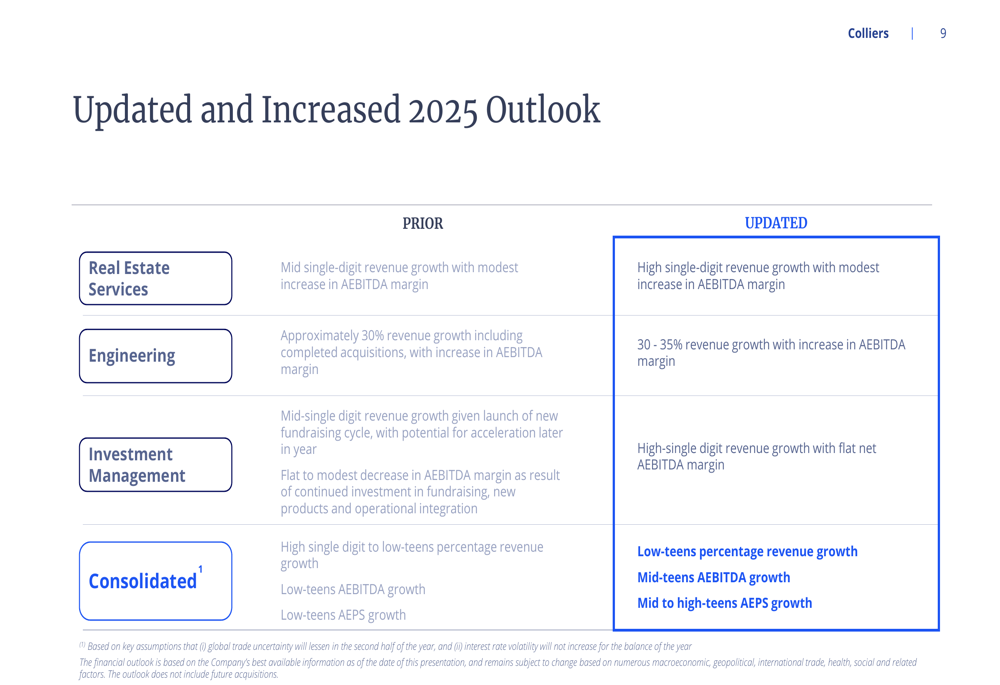
For Real Estate Services, Colliers expects high single-digit revenue growth with a modest increase in adjusted EBITDA margin. The Engineering segment is projected to deliver 30-35% revenue growth with an increase in adjusted EBITDA margin. Investment Management is forecast to achieve high single-digit revenue growth with a flat net adjusted EBITDA margin.
GAAP vs. Adjusted Metrics
The significant divergence between GAAP and adjusted performance metrics warrants closer examination. The reconciliation between GAAP net earnings and adjusted EBITDA reveals several major adjustments:
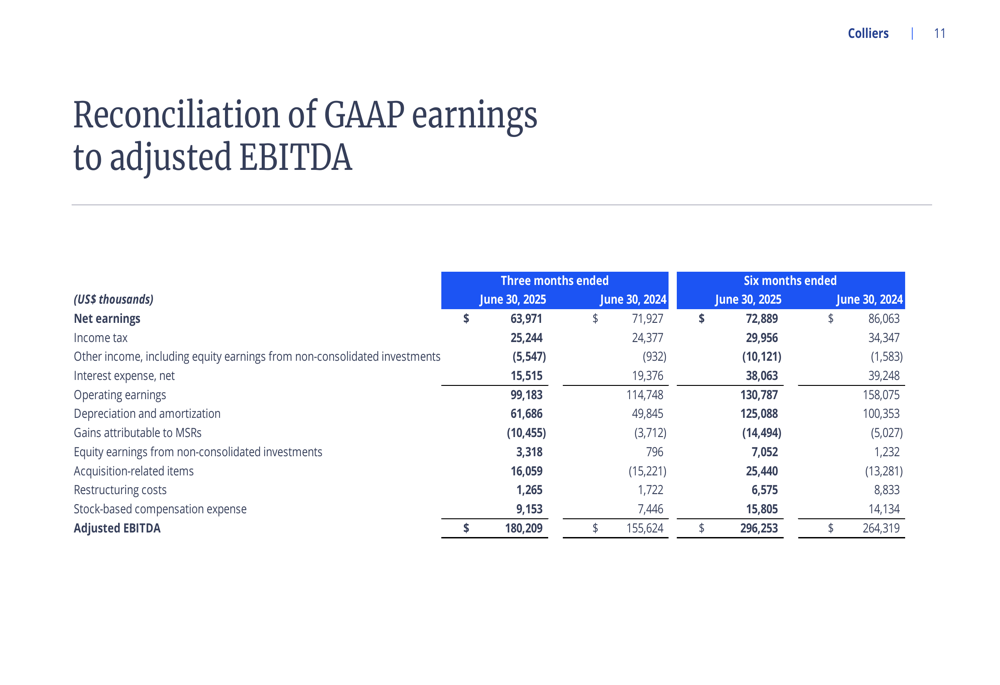
Key adjustments include depreciation and amortization of $46.1 million, acquisition-related items of $22.8 million, and stock-based compensation of $13.0 million for Q2 2025. These adjustments help explain the gap between GAAP operating earnings and adjusted EBITDA.
Similarly, the reconciliation to adjusted net earnings shows substantial adjustments:
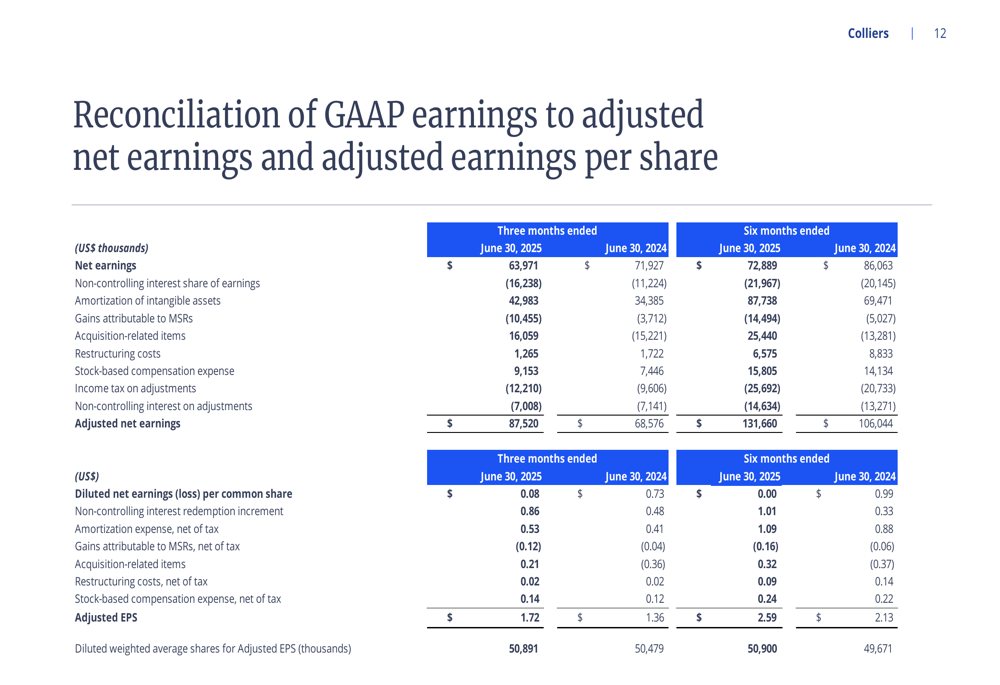
For Q2 2025, amortization of intangible assets ($26.7 million), acquisition-related items ($22.8 million), and stock-based compensation ($13.0 million) were the largest adjustments, resulting in adjusted net earnings of $87.5 million compared to GAAP net earnings attributable to common shareholders of just $4.0 million.
Conclusion
Colliers’ Q2 2025 results demonstrate the effectiveness of its diversification strategy, with the rapidly growing Engineering segment offsetting more modest performance in Real Estate Services and Investment Management. While adjusted metrics show strong growth, the significant gap between adjusted and GAAP figures highlights the impact of acquisition-related costs and other one-time items.
The company’s increased full-year outlook suggests confidence in continued growth across all segments. With a solid balance sheet, ongoing acquisition activity, and increasing recurring revenue, Colliers appears well-positioned to continue its growth trajectory through the remainder of 2025, though investors should monitor the divergence between adjusted and GAAP metrics as an indicator of underlying business performance.
Full presentation:
This article was generated with the support of AI and reviewed by an editor. For more information see our T&C.