S&P 500 slips, but losses kept in check as Nvidia climbs ahead of results

Community Health Systems, Inc. (NYSE:CYH) released its first quarter 2025 earnings presentation on April 23, 2025, showing modest revenue growth and significantly narrowed losses compared to the same period last year. The healthcare provider reported a 0.6% increase in net operating revenues while making progress on its medium-term financial goals focused on margin improvement and debt reduction.
Quarterly Performance Highlights
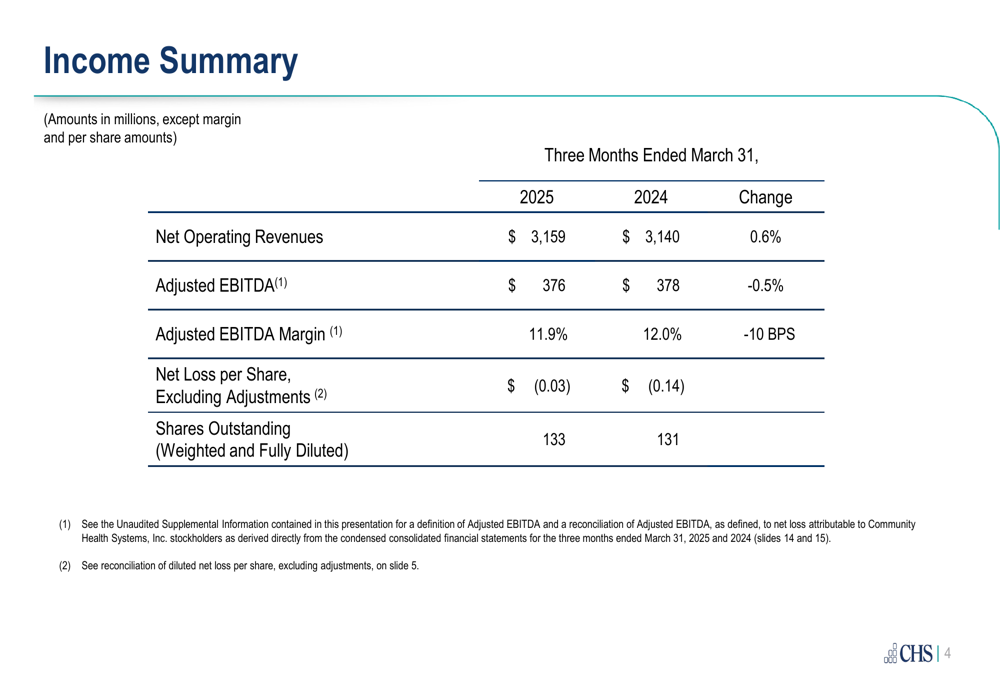
CHS reported net operating revenues of $3,159 million for Q1 2025, a slight increase of 0.6% compared to $3,140 million in Q1 2024. Adjusted EBITDA was $376 million, representing a minor decrease of 0.5% from $378 million in the prior-year period. The company’s adjusted EBITDA margin contracted slightly to 11.9% from 12.0% a year ago.
A key positive was the significant improvement in net loss per share, excluding adjustments, which narrowed to $(0.03) in Q1 2025 from $(0.14) in Q1 2024, representing a 78.6% improvement.
As shown in the following income summary chart:
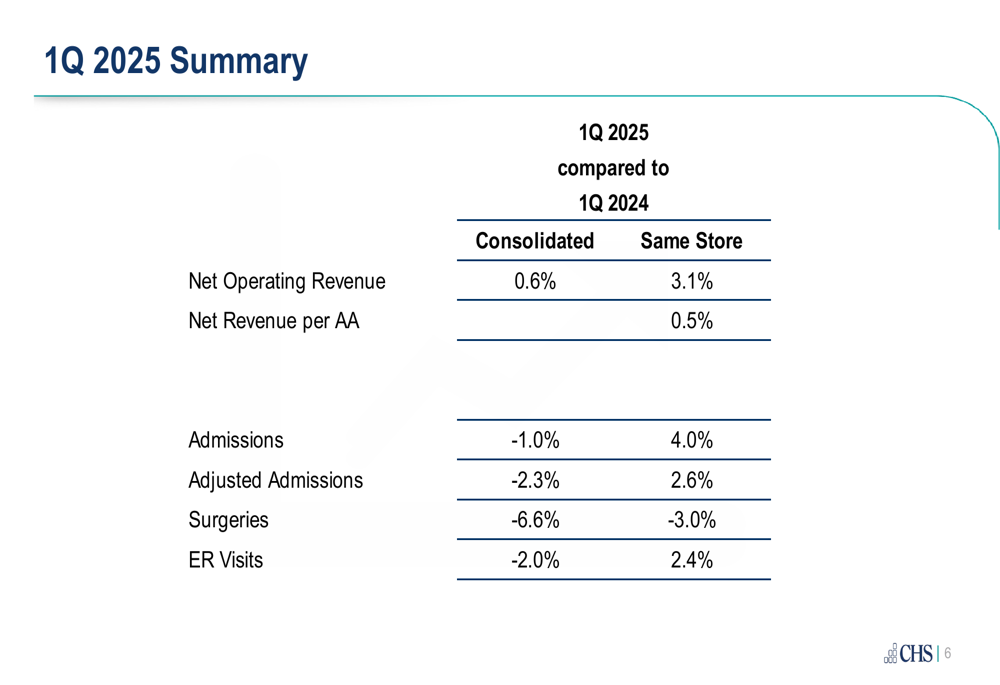
The company’s same-store performance metrics were notably stronger than consolidated results, indicating that existing facilities are performing well. Same-store net operating revenue increased by 3.1% compared to Q1 2024, while same-store admissions grew by 4.0% and adjusted admissions increased by 2.6%. However, surgeries declined by 3.0% on a same-store basis.
The following chart illustrates these operational metrics:
Detailed Financial Analysis
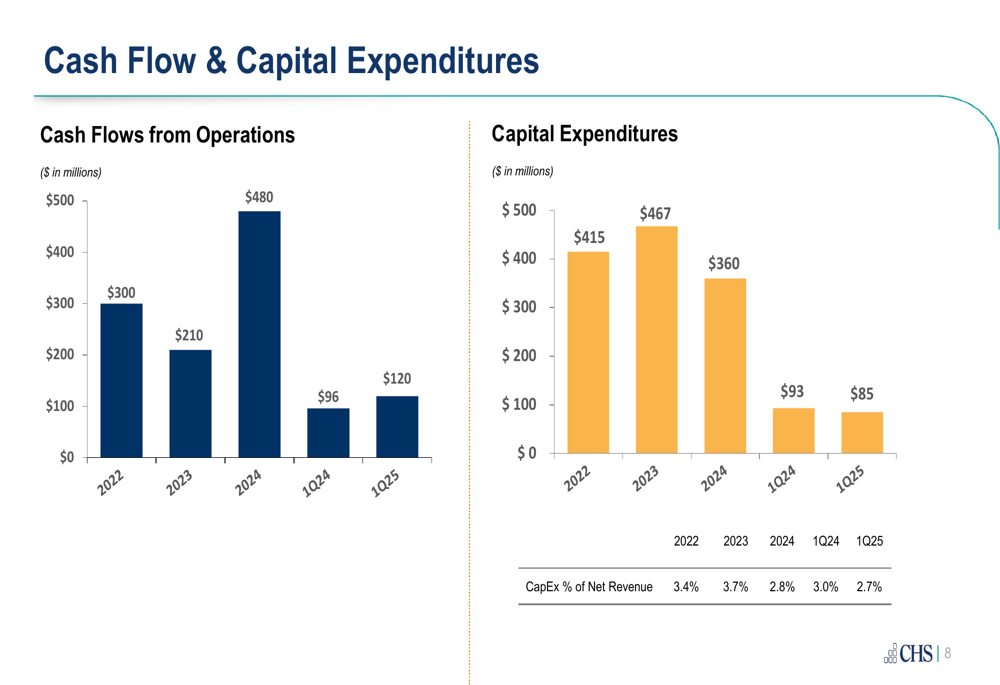
CHS reported improvements in its cash flow and capital expenditure metrics. Cash flows from operations increased to $120 million in Q1 2025, up from $96 million in Q1 2024, representing a 25% improvement. Meanwhile, capital expenditures decreased to $85 million (2.7% of net revenue) from $93 million (3.0% of net revenue) in the prior-year period.
The company’s multi-year cash flow and capital expenditure trends are illustrated below:
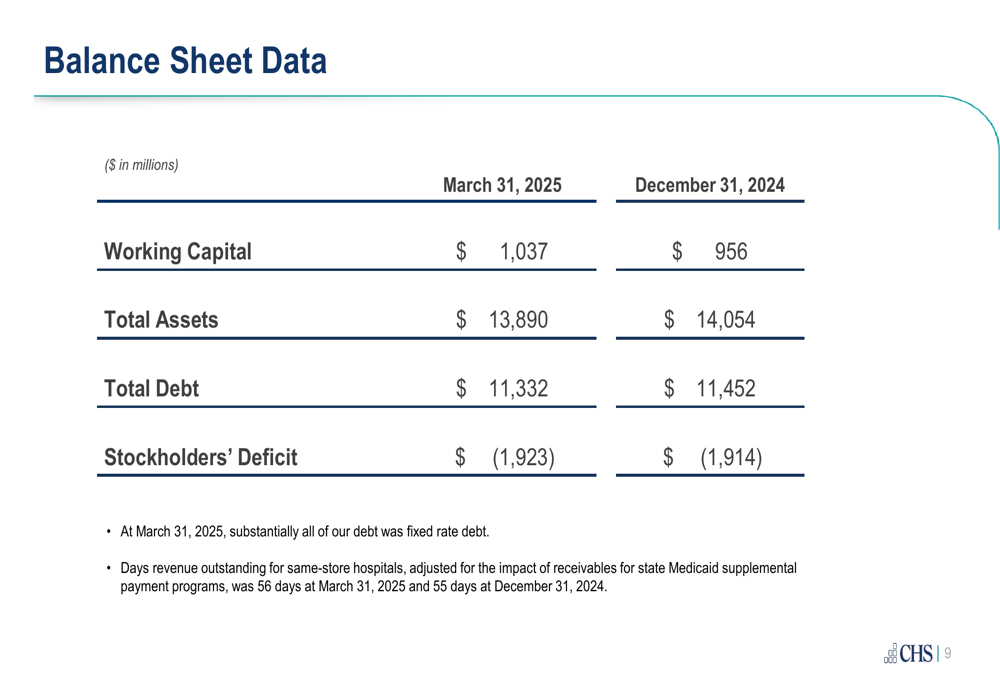
The balance sheet showed modest improvements, with total debt decreasing to $11,332 million as of March 31, 2025, down from $11,452 million at December 31, 2024. Working capital improved to $1,037 million from $956 million over the same period. The company noted that substantially all of its debt was fixed-rate debt as of March 31, 2025.
The days revenue outstanding for same-store hospitals, adjusted for the impact of receivables for state Medicaid supplemental payment programs, was 56 days at March 31, 2025, compared to 55 days at December 31, 2024.
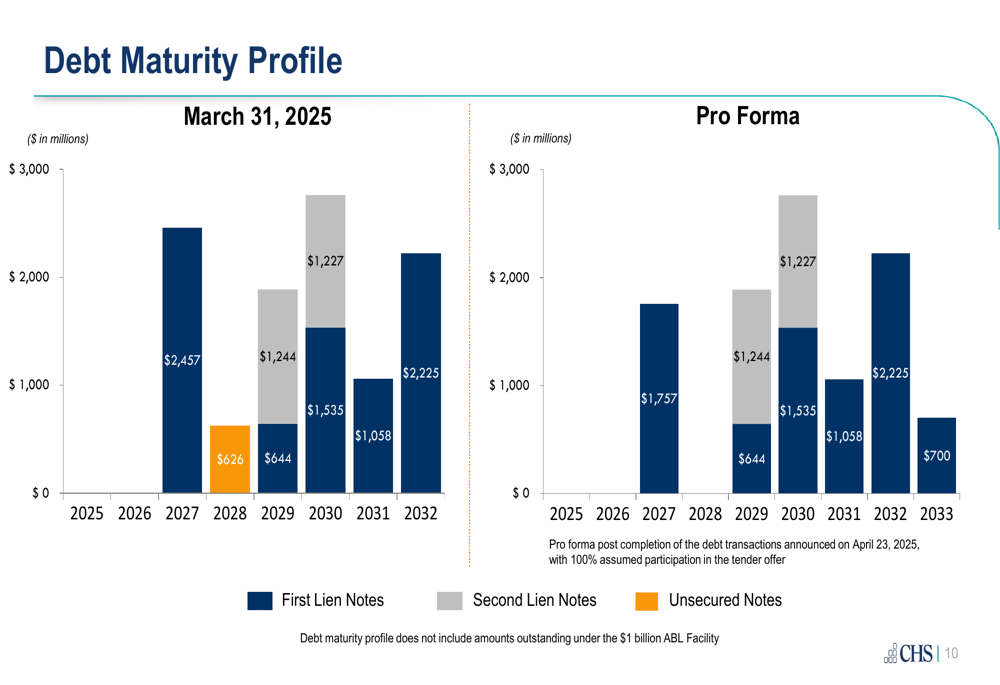
CHS also presented its debt maturity profile, highlighting recent debt transactions announced on April 23, 2025. The pro forma debt structure shows a new $700 million maturity in 2033 and a reduction in 2028 maturities from $2,457 million to $1,757 million, indicating the company’s efforts to extend its debt maturity timeline.
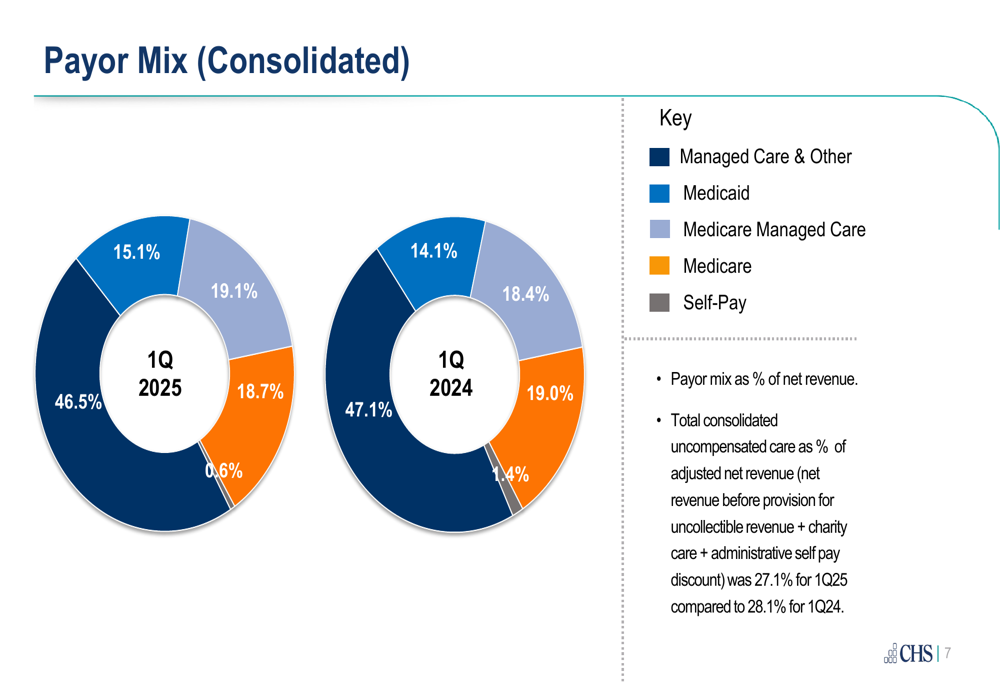
The company’s payor mix showed slight shifts compared to the prior year, with Medicare and Medicare Managed Care accounting for 46.5% of net revenue in Q1 2025, down from 47.1% in Q1 2024. Self-pay decreased significantly to 0.6% from 1.4%, while Medicaid increased to 19.1% from 18.4%. Total (EPA:TTEF) consolidated uncompensated care as a percentage of adjusted net revenue improved to 27.1% in Q1 2025 from 28.1% in Q1 2024.
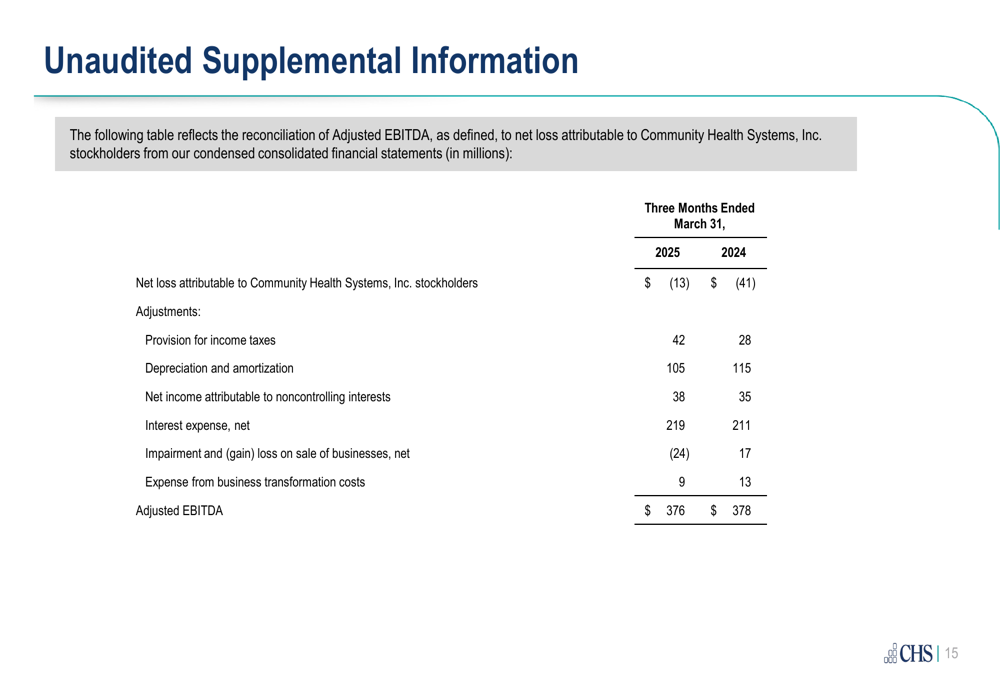
A detailed reconciliation of adjusted EBITDA shows that net loss attributable to Community Health Systems stockholders was $(13) million in Q1 2025, improved from $(41) million in Q1 2024. Key adjustments included $219 million in interest expense (up from $211 million), $105 million in depreciation and amortization (down from $115 million), and a $(24) million gain on sale of businesses compared to a $17 million loss in the prior year.
Strategic Initiatives & Outlook
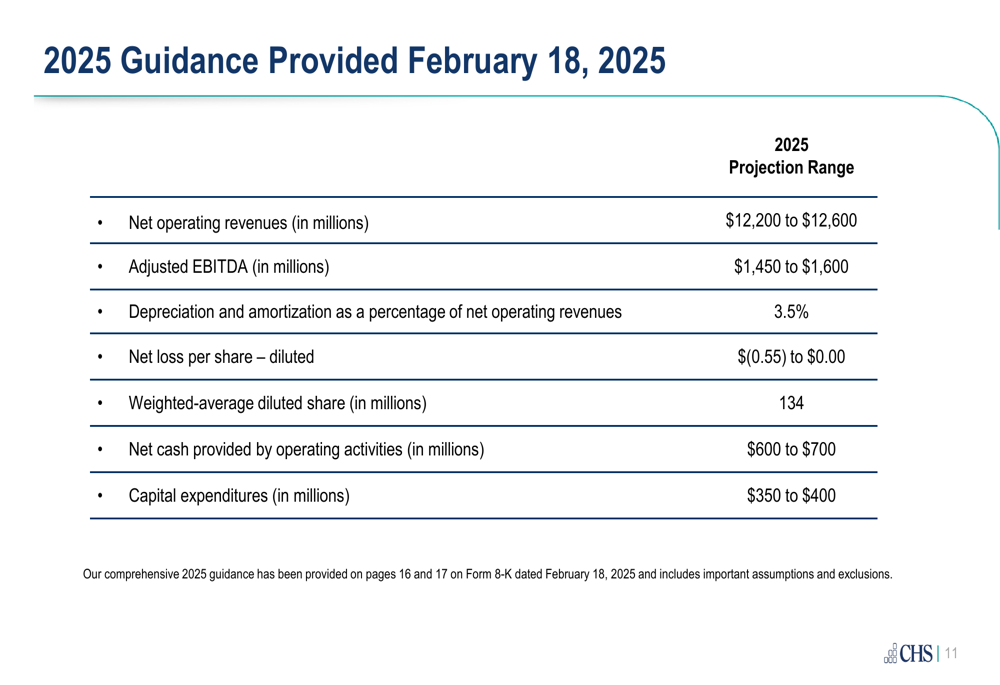
CHS maintained its full-year 2025 guidance that was initially provided on February 18, 2025. The company continues to expect net operating revenues between $12,200 million and $12,600 million, and adjusted EBITDA between $1,450 million and $1,600 million for the full year. Net loss per share is projected to be between $(0.55) and $0.00.
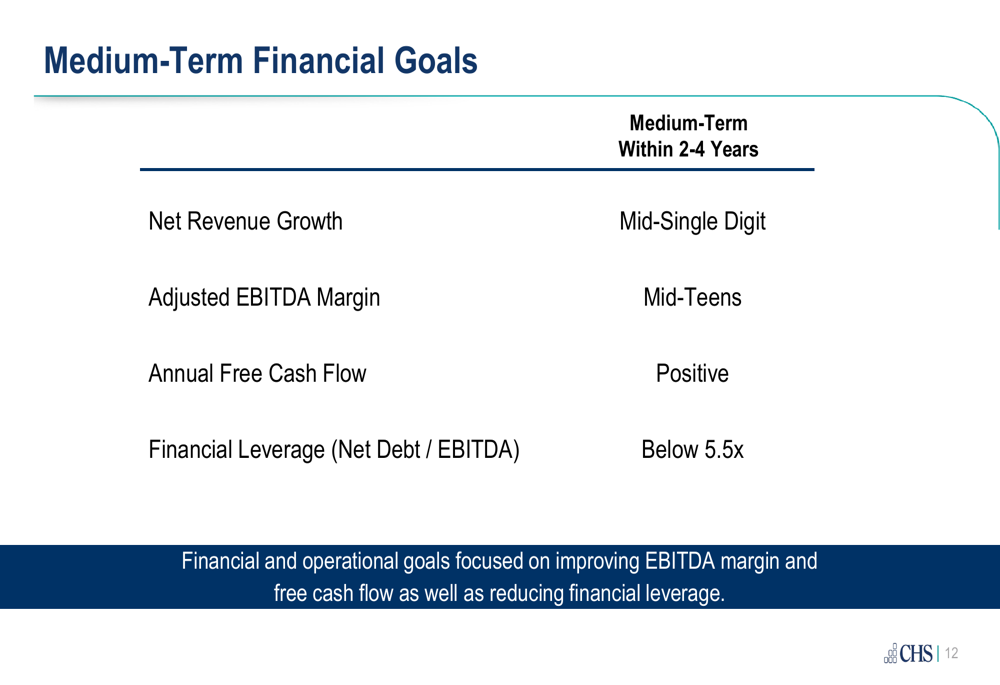
Looking beyond 2025, the company outlined medium-term financial goals to be achieved within 2-4 years. These include mid-single digit net revenue growth, mid-teens adjusted EBITDA margin, positive annual free cash flow, and financial leverage (net debt/EBITDA) below 5.5x.
Market Reaction
The market responded positively to CHS’s Q1 2025 results. According to premarket trading data, Community Health Systems shares were up 9.47% to $2.66 per share, indicating investor optimism about the company’s narrowed losses and operational improvements.
This reaction comes after a challenging period for the company. In its Q3 2024 earnings call, CHS had reported impacts from Hurricanes Helene and Milton, which resulted in facility closures and a $7 million revenue impact. The company had also noted challenges with increased denial rates from insurers, particularly in Medicare Advantage, creating a $10 million headwind during that quarter.
The Q1 2025 results suggest that CHS is making progress on its operational efficiency and debt management strategies, though the company still faces challenges in achieving consistent profitability as it works toward its medium-term financial goals.
Full presentation:
This article was generated with the support of AI and reviewed by an editor. For more information see our T&C.