Oracle stock falls after report reveals thin margins in AI cloud business

Introduction & Market Context
Compass Inc (NYSE:COMP) delivered record second-quarter results according to its Q2 2025 business update presentation released on July 30, 2025. The real estate technology company reported significant growth across all key metrics, demonstrating continued momentum in agent recruitment and market share expansion despite ongoing challenges in the broader housing market.
The company’s performance represents a notable improvement from the first quarter, when Compass reported a loss of $0.09 per share. The stock closed at $7.37 on July 30, down 1.76% for the day, with modest after-hours movement following the presentation.
Quarterly Performance Highlights
Compass achieved record financial results in the second quarter, with revenue reaching $2.06 billion, representing a 21% year-over-year increase. This performance was within the company’s previously provided guidance range of $2.0-$2.15 billion.
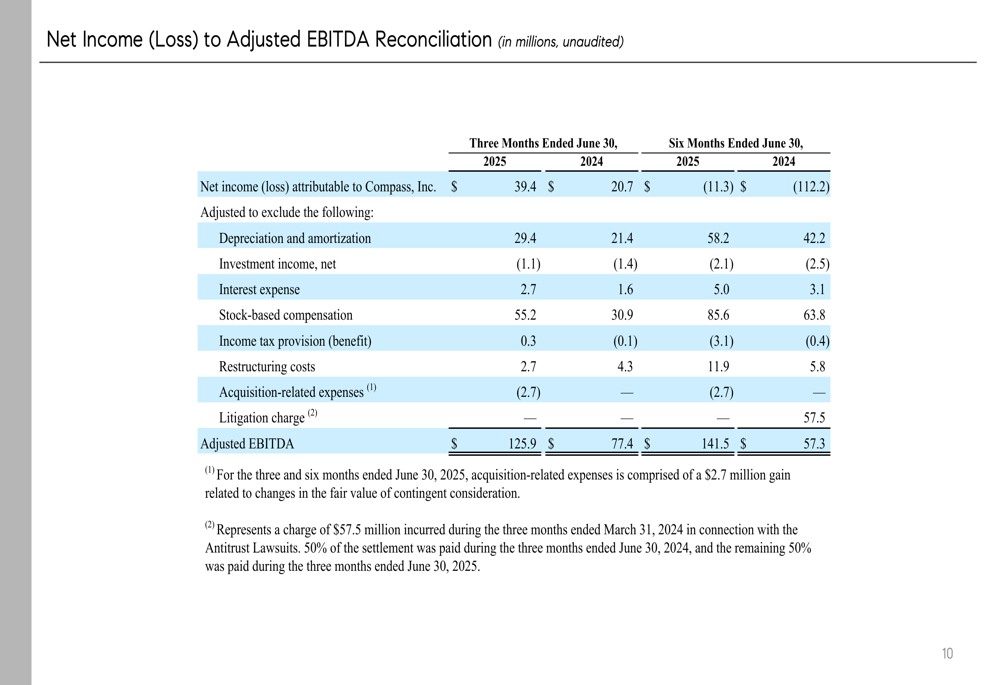
The company reported substantial improvement in profitability metrics, with GAAP net income of $39.4 million, up 90% year-over-year. Adjusted EBITDA reached $125.9 million, an increase of $48.5 million compared to Q2 2024, while Adjusted EBITDA margin expanded by 150 basis points to 6.1%.
As shown in the following summary of key performance metrics:
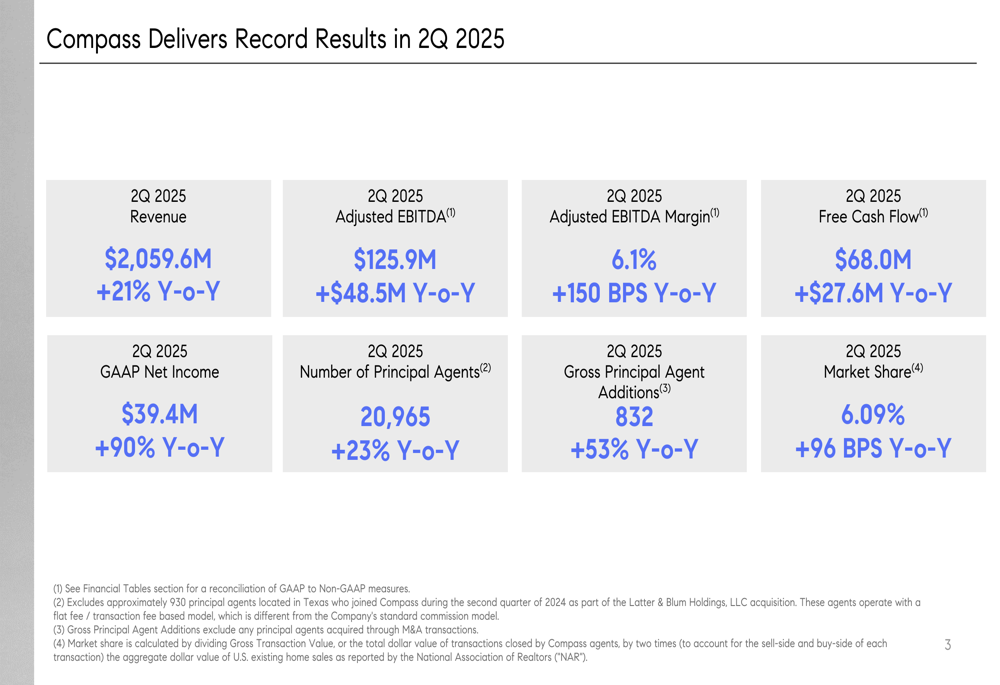
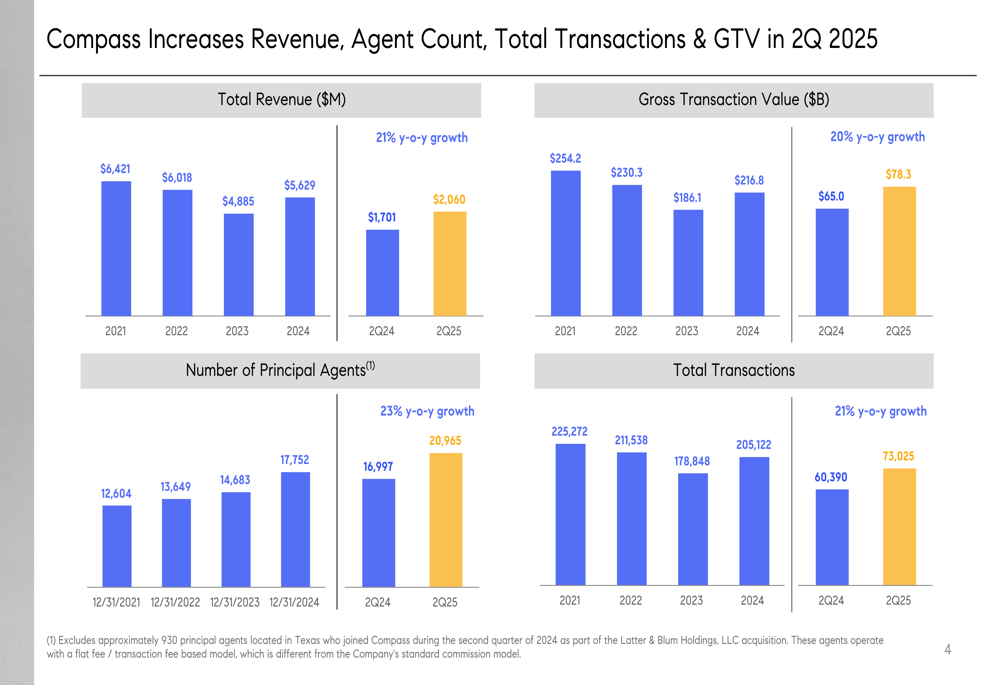
The company’s transaction volume also showed strong growth, with total transactions increasing 21% year-over-year to 73,025. Gross Transaction (JO:NTUJ) Value (GTV) grew 20% to $78.3 billion, reflecting both increased transaction volume and relatively stable average transaction values.
Detailed Financial Analysis
Compass’s financial performance demonstrates consistent growth across multiple years, with recent quarters showing accelerated momentum. The company’s revenue, agent count, transaction volume, and gross transaction value all show positive trajectories as illustrated in the following charts:
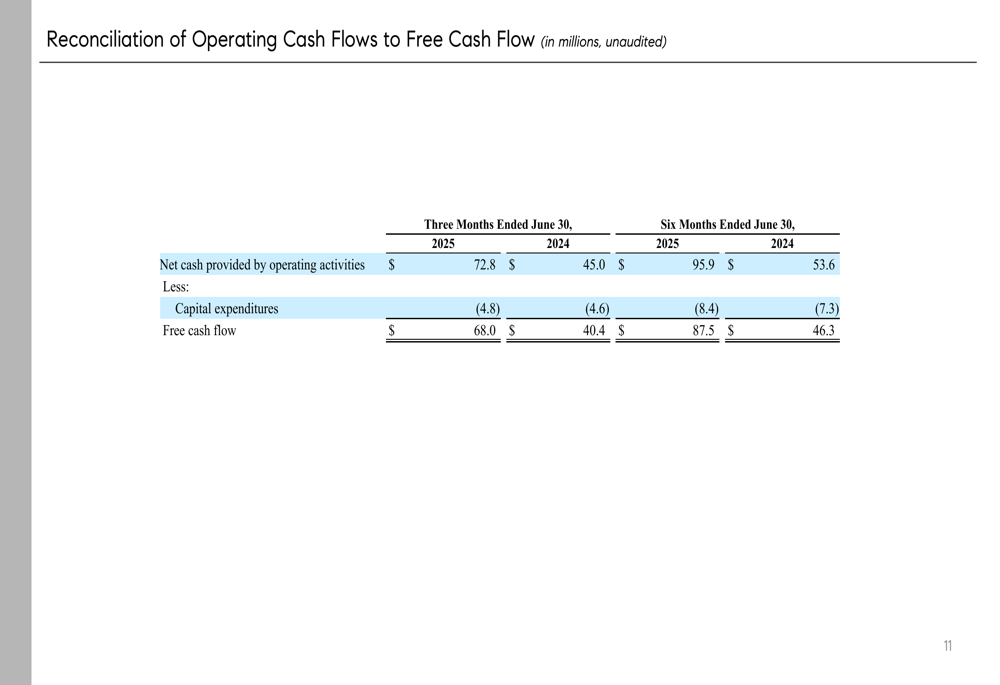
Free cash flow generation has improved significantly, reaching $68.0 million for Q2 2025, an increase of $27.6 million compared to the same period last year. This improvement reflects the company’s enhanced operational efficiency and profitability.
The reconciliation of net income to adjusted EBITDA provides further insight into the company’s profitability drivers:
Similarly, the reconciliation of operating cash flows to free cash flow demonstrates Compass’s ability to convert earnings into cash:
Strategic Initiatives & Acquisitions
A key component of Compass’s growth strategy has been expanding its agent base, both organically and through acquisitions. The company reported 20,965 principal agents at the end of Q2 2025, representing a 23% increase year-over-year. Notably, this figure excludes approximately 930 principal agents who joined through the Latter & Blum Holdings acquisition, as they operate under a different commission model.
Gross principal agent additions reached 832 in Q2, up 53% year-over-year, excluding agents acquired through M&A transactions. This growth in agent count has contributed to Compass’s market share expansion, which reached 6.09% in Q2 2025, an increase of 96 basis points year-over-year.
The company has been active on the acquisition front, completing the purchase of Christie’s International Real Estate in January 2025, followed by Washington Fine Properties and a title company in Texas in February and April 2025, respectively. Two additional small brokerage acquisitions were announced in July.
Forward-Looking Guidance
Looking ahead, Compass provided guidance for the third quarter and updated its full-year outlook as shown in the following slide:
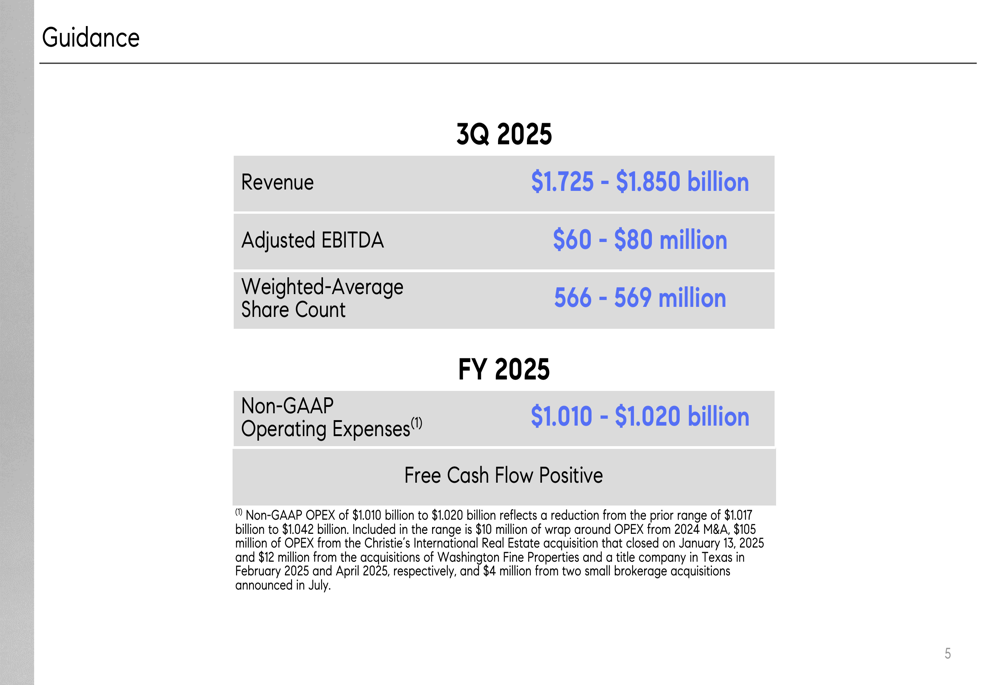
For Q3 2025, the company expects revenue between $1.725 billion and $1.850 billion, with adjusted EBITDA projected at $60-$80 million. The weighted-average share count is anticipated to be 566-569 million.
For the full year 2025, Compass reduced its non-GAAP operating expense guidance to $1.010-$1.020 billion from the previous range of $1.017-$1.042 billion. This reduction suggests improved operational efficiency despite additional expenses from recent acquisitions. The company continues to expect positive free cash flow for the full year.
Key Business Metrics
Compass’s comprehensive overview of key business metrics and non-GAAP financial measures provides additional context for evaluating the company’s performance:
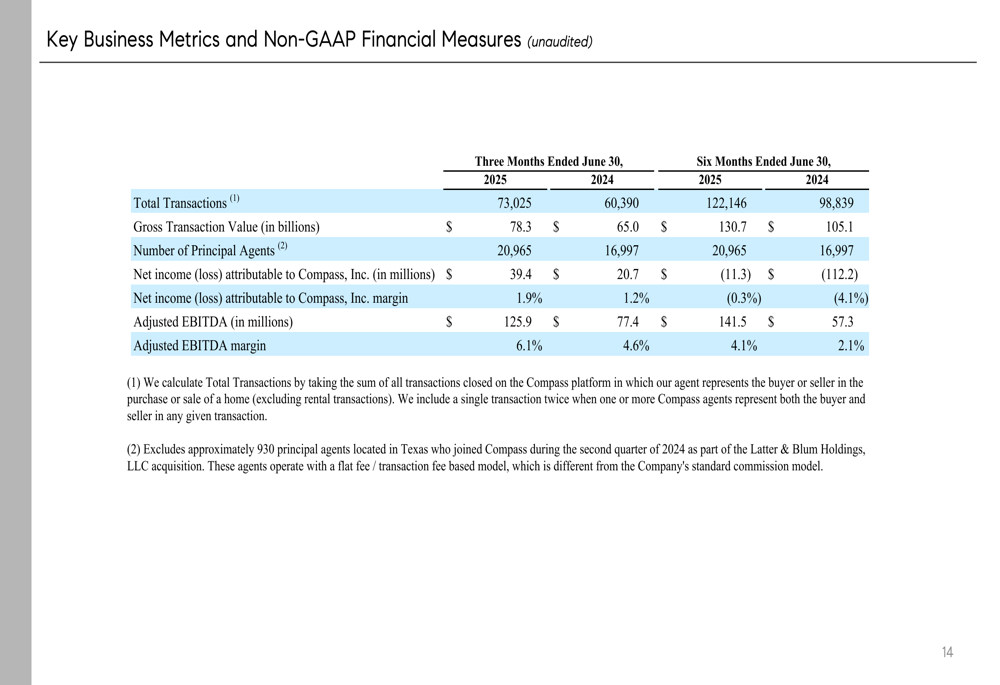
These metrics highlight the company’s improved profitability trajectory, with Q2 2025 showing a net income margin of 1.9% compared to 1.2% in Q2 2024, and an adjusted EBITDA margin of 6.1% versus 4.6% in the prior-year period.
The company’s continued market share gains, improved profitability, and positive cash flow generation suggest that Compass’s growth strategy is gaining traction despite the challenging real estate market environment. However, investors will likely remain focused on the sustainability of these improvements and the company’s path to consistent profitability in the quarters ahead.
Full presentation:
This article was generated with the support of AI and reviewed by an editor. For more information see our T&C.