Gold prices steady ahead of Fed decision; weekly weakness noted

Corebridge Financial Inc (NYSE:CRBG) presented its first quarter 2025 financial results on May 6, revealing a 5% year-over-year increase in operating earnings per share and continued strength across its diversified business segments.
Quarterly Performance Highlights
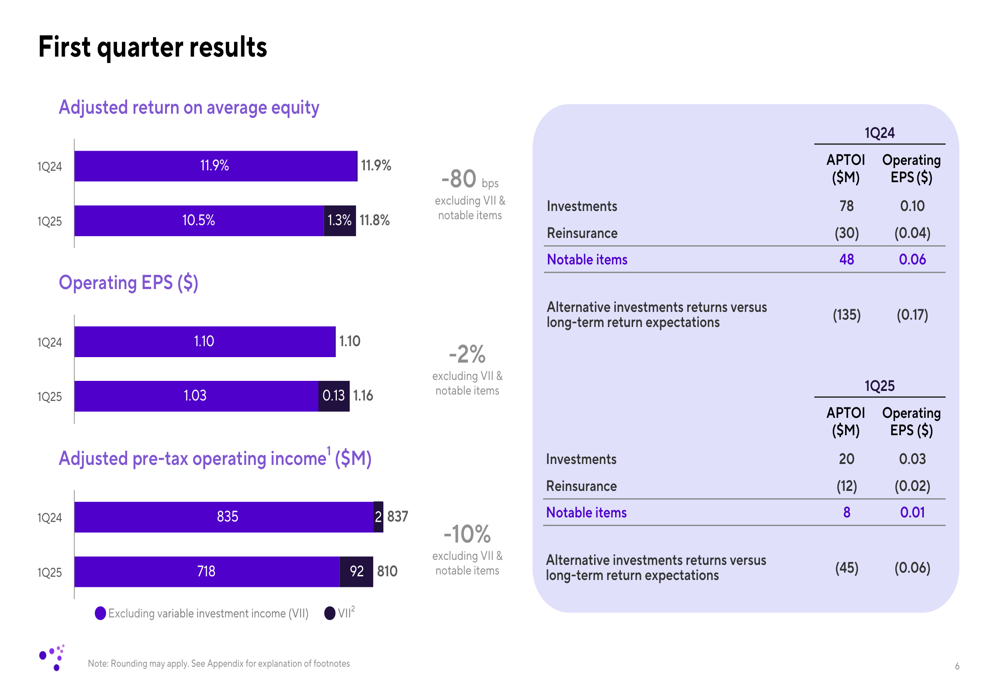
Corebridge reported operating earnings per share of $1.16 for Q1 2025, up 5% from $1.10 in the same period last year. The company’s adjusted return on average equity (ROAE) was 11.8%, slightly down 10 basis points year-over-year, but still within striking distance of the company’s 12-14% target range.
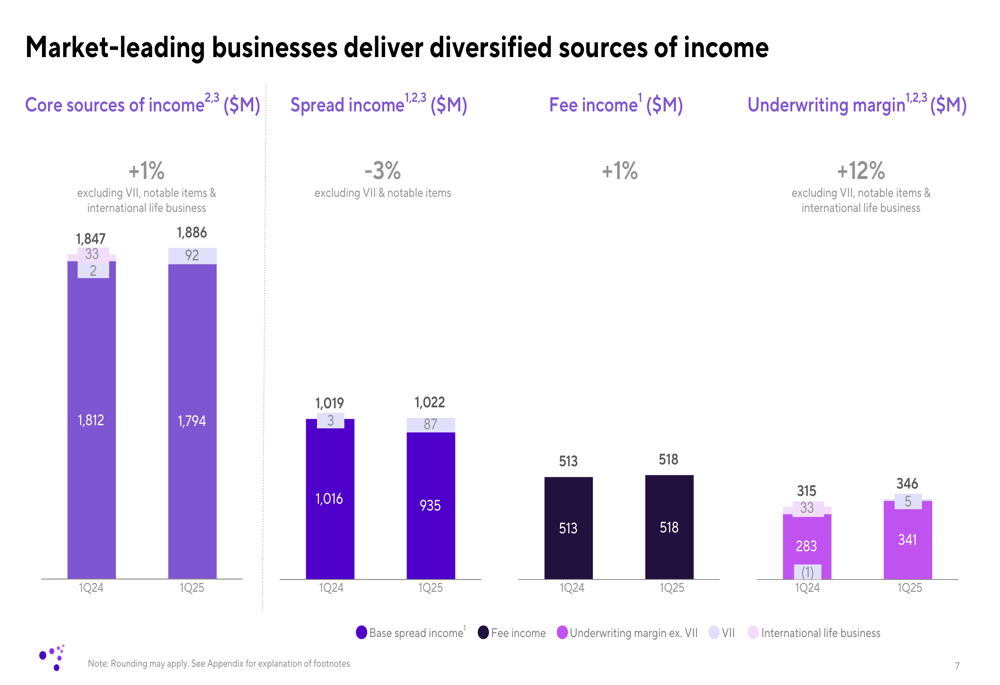
The financial services provider emphasized its resilient business model, with core sources of income growing 1% year-over-year to $1.89 billion, excluding variable investment income, notable items, and international life business.
As shown in the following key performance metrics:
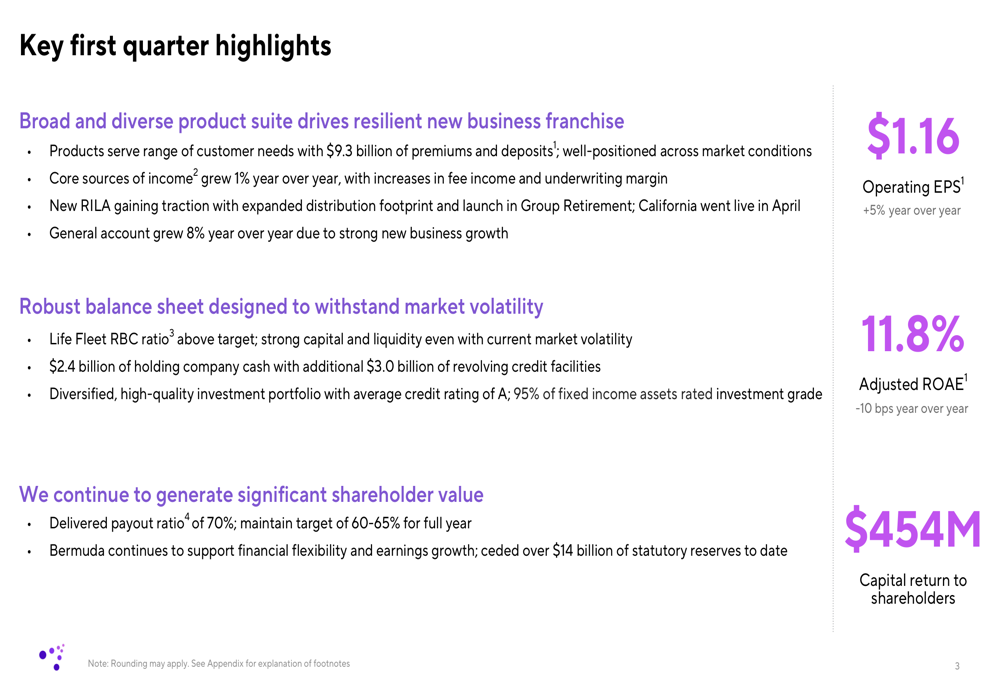
"Our broad and diverse product suite continues to drive our resilient new business franchise," said Corebridge in its presentation, highlighting $9.3 billion in premiums and deposits during the quarter. The company also noted that its general account grew 8% compared to the previous year.
Detailed Financial Analysis
Corebridge’s financial performance demonstrated stability across its income streams. While spread income remained relatively flat at $1.02 billion (-3% YoY) and fee income showed modest growth at $518 million (+1% YoY), the company’s underwriting margin delivered stronger growth at $346 million (+12% YoY).
The following chart illustrates the company’s diversified sources of income:
The company’s first quarter results also reflected some impact from investments and alternative investment returns. Adjusted pre-tax operating income decreased to $718 million in Q1 2025 from $835 million in Q1 2024, though this was partially offset by the company’s ongoing operational improvements.
Strategic Initiatives & Business Segment Performance
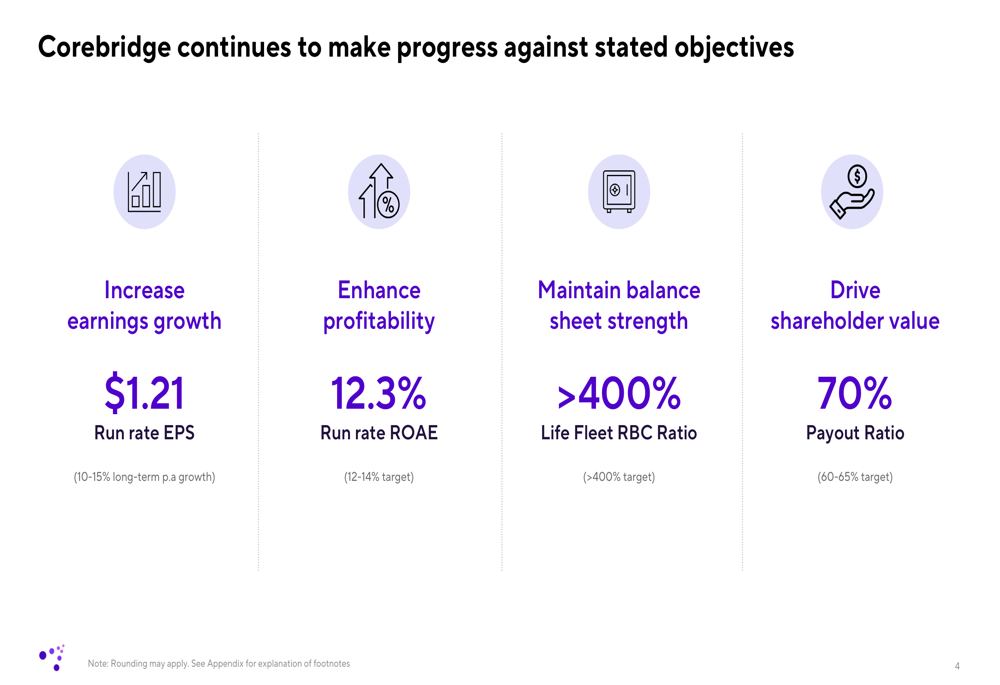
Corebridge continues to execute against its strategic objectives, making progress toward its long-term targets. The company reported a run rate EPS of $1.21, positioning it well for its 10-15% long-term annual growth target. Similarly, its run rate ROAE of 12.3% falls within the company’s 12-14% target range.
The following slide demonstrates Corebridge’s progress against its stated objectives:
Across business segments, Corebridge reported varying performance:
In Individual Retirement, sources of income were down slightly year-over-year as Federal Reserve rate actions and the company’s hedging activities reduced spread income. However, the segment saw general account net inflows of $1.1 billion.
The Life Insurance (NSE:LIFI) segment remained a core strength, with underwriting margin excluding variable investment income, notable items, and international life increasing by 11%. The company attributed this to strong product positioning and success of data-driven practices.
Institutional Markets showed particularly strong growth, with reserves increasing 17% year-over-year and total sources of income excluding notable items up 33%. The company continues to expand its Guaranteed Investment Contract (GIC) program amid strong execution and continued demand.
Capital Management & Shareholder Returns
Corebridge maintained a robust capital position, with $2.4 billion in holding company liquidity and additional $3.0 billion in revolving credit facilities. The company’s Life Fleet RBC ratio remained above its target of 400%.
During the quarter, Corebridge returned $454 million to shareholders, representing a 70% payout ratio, which exceeds the company’s full-year target of 60-65%. This continues the strong capital return trend seen in previous quarters.
The following chart details the company’s capital and liquidity position:
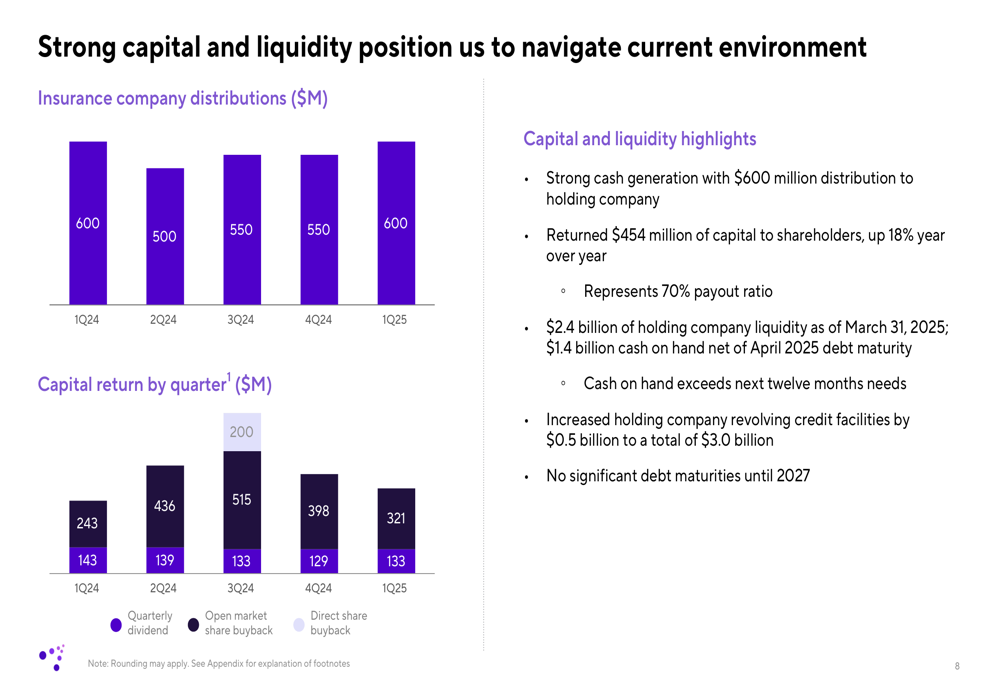
"We continue to generate significant shareholder value," the company stated in its presentation, highlighting its financial flexibility supported by its Bermuda operations.
Investment Portfolio Strength
A key component of Corebridge’s resilience is its well-diversified investment portfolio. The company maintains a high-quality portfolio with 97% in fixed income or short-term investments, 95% of fixed maturities rated investment grade, and an average credit quality of A.
The following chart illustrates the company’s investment portfolio allocation:
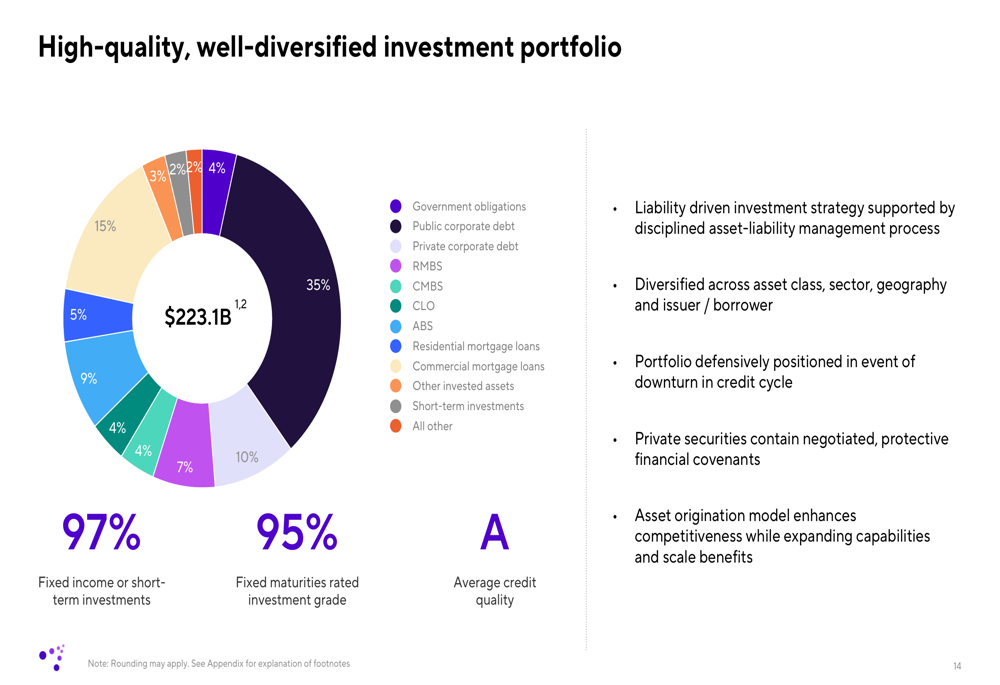
The company emphasized its liability-driven investment strategy and noted that its portfolio is defensively positioned in the event of a market downturn. Private securities in the portfolio contain financial covenants, and the company’s asset origination model enhances its competitiveness.
Forward-Looking Statements
Looking ahead, Corebridge provided modeling assumptions for 2025, including expectations for alternative investment returns below the long-term assumption of 8-9%. The company also outlined sensitivity to interest rates, noting a 2 basis point increase or decrease in base portfolio income for every 25 basis point change in SOFR (Secured Overnight Financing Rate).
This guidance aligns with the company’s statements from its Q2 2024 earnings, where it emphasized its focus on executing strategy, optimizing capital, and generating long-term growth and shareholder value.
Corebridge’s Q1 2025 results demonstrate continued execution of the company’s strategy, with growth in operating earnings per share and strong capital returns to shareholders, despite some headwinds in certain business segments. The company’s diversified business model and strong balance sheet position it well to navigate varying market conditions while continuing to deliver value to shareholders.
Full presentation:
This article was generated with the support of AI and reviewed by an editor. For more information see our T&C.