Gold prices tick higher on fresh U.S. tariff threats, Fed rate cut hopes

Crescent Energy Co (NYSE:CRGY) reported strong second-quarter 2025 performance in its latest earnings presentation, highlighting substantial cash flow generation and operational efficiencies that exceeded market expectations. The company’s shares closed at $8.96 on August 4, down 1% for the day, but have shown improvement from post-Q1 earnings levels.
Quarterly Performance Highlights
Crescent Energy delivered robust financial results in Q2 2025, generating approximately $514 million in adjusted EBITDAX and $171 million in levered free cash flow. While these figures represent a slight decrease from Q1’s $530 million in adjusted EBITDA and $242 million in levered free cash flow, they still exceeded market expectations.
The company maintained strong production levels of approximately 263,000 barrels of oil equivalent per day (Mboe/d), including 108,000 barrels of oil per day, with an oil cut of 41%. This represents a modest increase from Q1’s production of 258,000 Mboe/d.
As shown in the following performance summary chart:
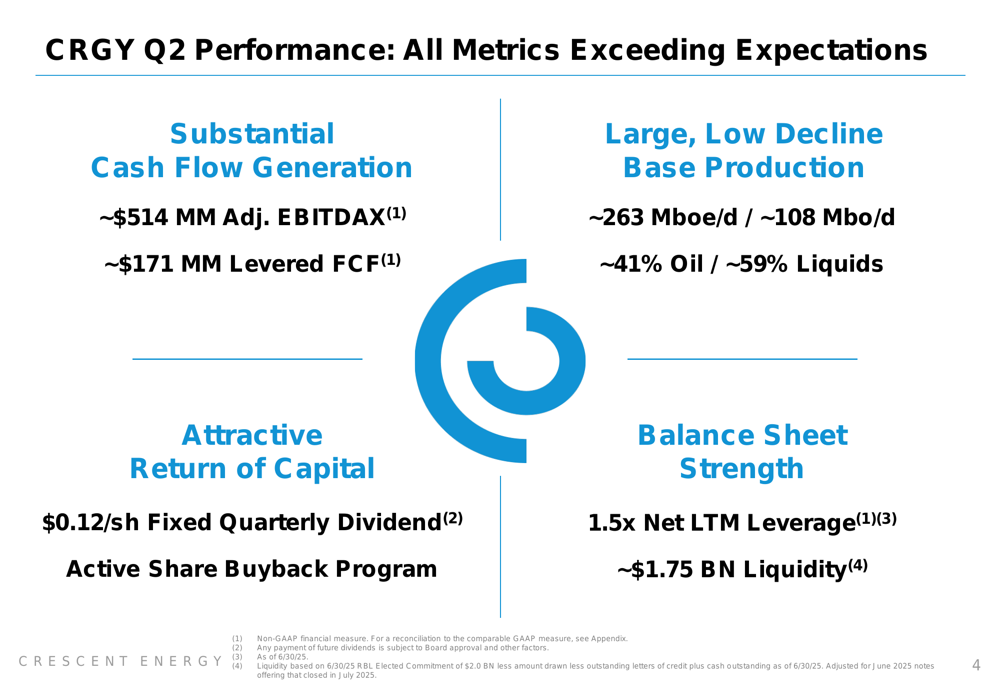
Crescent’s balance sheet remains solid with 1.5x net leverage (LTM) and approximately $1.75 billion in liquidity as of June 30, 2025. The company continues to prioritize shareholder returns through its fixed quarterly dividend of $0.12 per share (approximately 5% yield) and an active share repurchase program, which bought back approximately $28 million of shares at an average price of $7.88 during the quarter.
Enhanced 2025 Outlook
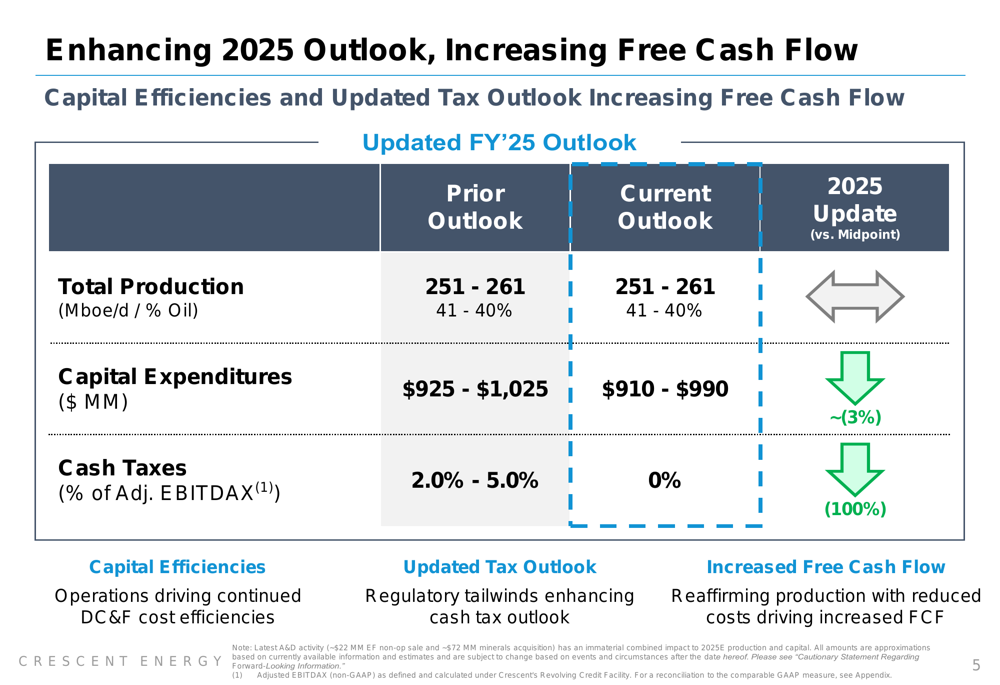
Crescent Energy has improved its 2025 guidance, maintaining production targets while reducing capital expenditures and eliminating expected cash taxes. The company now projects capital expenditures of $910-$990 million, representing a 3% reduction from its previous guidance of $925-$1,025 million.
Most notably, Crescent has revised its cash tax outlook from 2.0-5.0% of adjusted EBITDAX to 0%, citing regulatory tailwinds. These improvements are expected to significantly enhance free cash flow for the remainder of 2025.
The following chart illustrates these guidance enhancements:
"We are a cash flow focused company," CEO David Rockacharley stated during the Q1 earnings call, emphasizing the company’s commitment to generating durable free cash flow. This focus continues to be evident in the Q2 results and enhanced outlook.
Operational Efficiencies
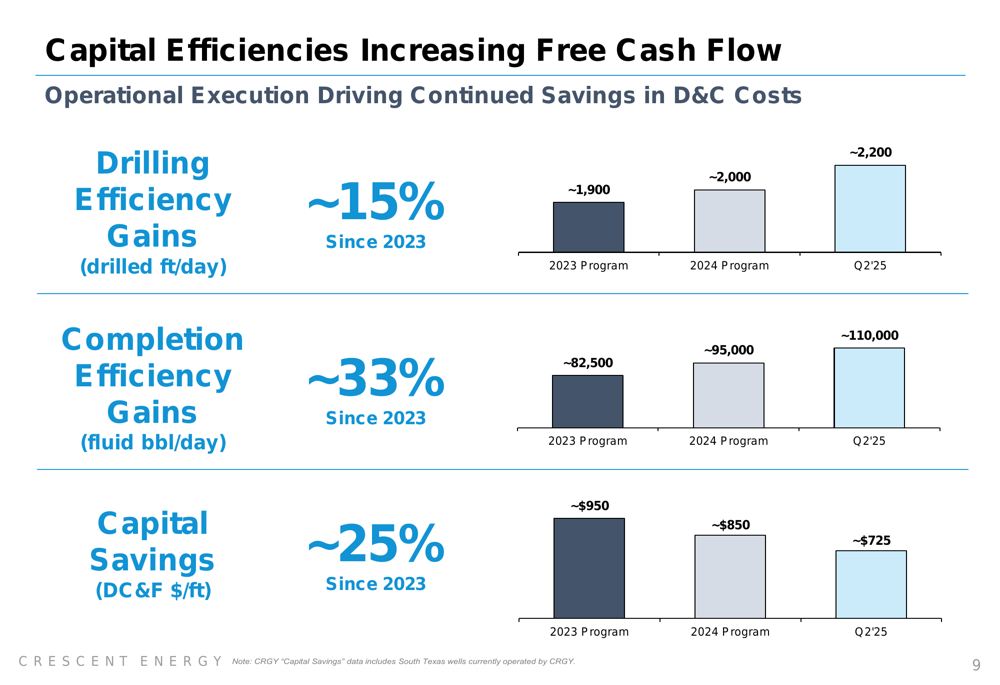
Crescent Energy’s improved financial outlook is largely driven by operational efficiencies across its key assets. In the Eagle Ford basin, the company reported production of approximately 173 Mboe/d (42% oil) with capital expenditures of $238 million. The company has achieved approximately 25% drilling, completion, and facilities (DC&F) cost savings in this region.
Similarly, in the Uinta basin, Crescent reported production of 23 Mboe/d (62% oil) with capital expenditures of $39 million and approximately 15% DC&F cost savings since 2024. The company noted that 100% of Uinta sales are to in-basin refineries, which limits volatility and enhances margins.
These operational improvements are translating directly to capital efficiency gains, as illustrated in the following chart:
Free Cash Flow Generation and Valuation
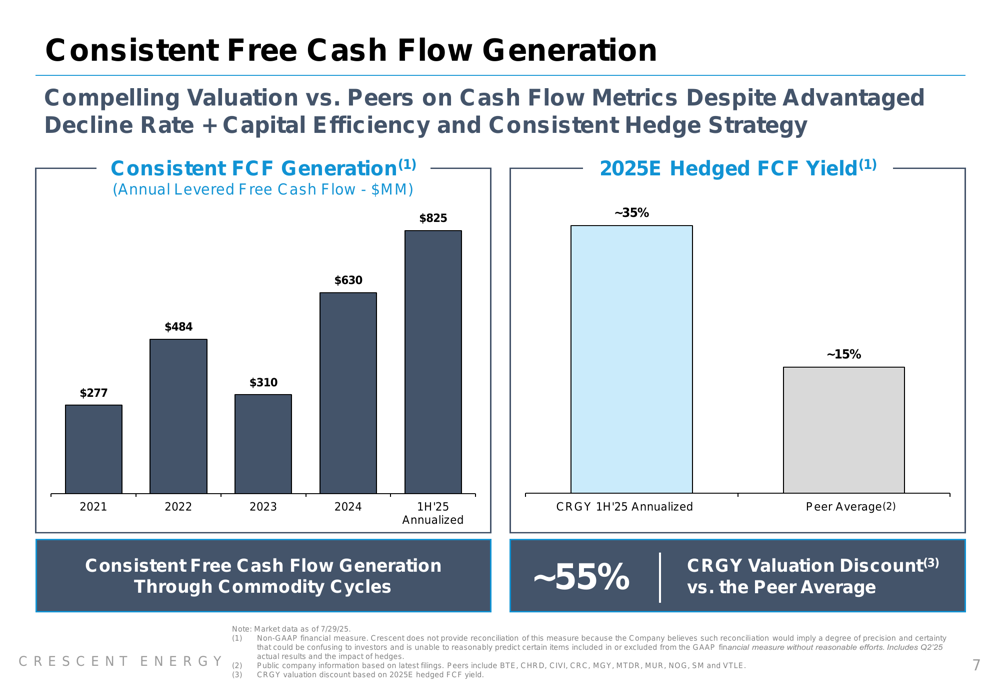
One of the most compelling aspects of Crescent’s presentation is its consistent and growing free cash flow generation. The company has demonstrated a strong upward trend in annual levered free cash flow, from $277 million in 2021 to a projected annualized rate of $825 million based on first-half 2025 performance.
This robust cash flow generation translates to an impressive free cash flow yield of approximately 35%, which is significantly higher than the peer average of approximately 15%. Despite this superior cash flow profile, Crescent trades at a valuation discount of approximately 55% compared to its peers.
The following chart highlights this free cash flow progression and yield comparison:
Strategic Capital Allocation
Crescent Energy continues to execute on its strategic capital allocation framework, focusing on accretive acquisitions, opportunistic divestitures, and shareholder returns. During the quarter, the company closed an approximately $72 million acquisition of minerals and royalty assets, expanding its minerals footprint to over 100,000 net royalty acres generating approximately $100 million in asset EBITDAX.
The company has also completed approximately $110 million of non-core divestitures year-to-date, demonstrating its commitment to portfolio optimization. This approach has supported a production CAGR of approximately 30% (20% per share) through strategic acquisitions.
Crescent’s return of capital strategy includes both a fixed dividend and share repurchases. The company’s current dividend yield of approximately 5% is competitive within its peer group, and when combined with its buyback program, represents a total yield of approximately 7%.
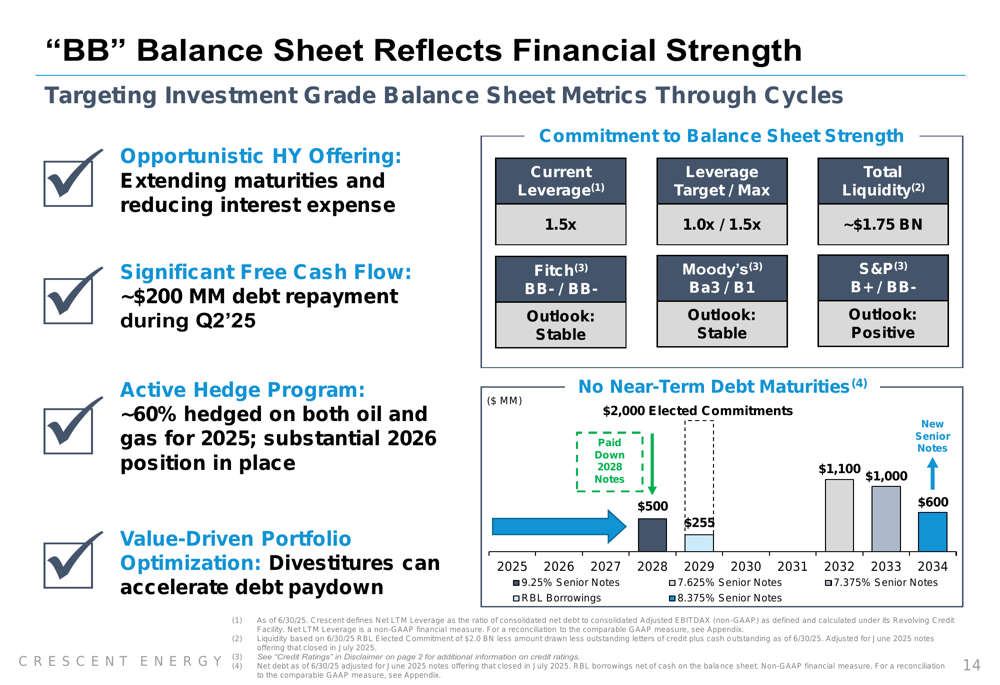
Balance Sheet Strength
Crescent Energy has maintained a strong balance sheet, reflected in its "BB" credit rating profile. During Q2, the company completed an opportunistic high-yield offering that extended maturities and reduced interest expense, while also repaying approximately $200 million in debt.
The company’s current leverage ratio stands at 1.5x, within its maximum target of 1.5x and approaching its long-term target of 1.0x. Crescent maintains significant liquidity of approximately $1.75 billion and has a well-structured debt maturity profile with minimal near-term maturities.
As illustrated in the following chart, the company has improved its weighted average debt maturity to approximately 7 years, compared to the peer average of approximately 5 years:
Forward-Looking Statements
Looking ahead, Crescent Energy is well-positioned to continue generating substantial free cash flow through its disciplined capital allocation approach and operational efficiencies. The company’s active hedge program, with approximately 60% of production hedged, provides cash flow durability in a volatile commodity price environment.
For 2026, the company has established a hedge position with 63% in swaps at approximately $67 per barrel and 37% in collars with floors of approximately $60 and ceilings of approximately $71 per barrel.
Crescent’s strategic focus on returns-driven investing, opportunistic hedging, and capital markets progress should continue to support its free cash flow generation and balance sheet strength. However, investors should monitor commodity price volatility, potential impacts of tariffs on capital costs, and broader market sentiment toward the energy sector.
With its enhanced 2025 outlook, strong operational performance, and commitment to shareholder returns, Crescent Energy presents a compelling investment case, particularly given its significant valuation discount relative to peers despite superior free cash flow generation.
Full presentation:
This article was generated with the support of AI and reviewed by an editor. For more information see our T&C.