S&P 500 slips, but losses kept in check as Nvidia climbs ahead of results

Introduction & Market Context
CTO Realty Growth Inc. (NYSE:CTO) released its second quarter 2025 investor presentation on July 30, highlighting strong leasing momentum and continued portfolio transformation. The real estate investment trust, which focuses on retail properties primarily in the Southeast and Southwest United States, reported a Core FFO per share of $0.45 for Q2 2025, supporting its attractive 8.8% dividend yield.
The company’s stock was up 1.21% in the previous session, closing at $17.55, and showed continued momentum with a 0.68% increase in premarket trading. CTO’s current valuation remains below its 52-week high of $21.15, suggesting potential upside as the company executes on its growth strategy.
Quarterly Performance Highlights
CTO Realty Growth delivered solid results in the second quarter, maintaining its growth trajectory with a quarterly same-property NOI growth of 0.9%. The company achieved impressive leasing spreads of 22% on comparable leases, demonstrating its ability to capture higher rents in its target markets.
As shown in the following comprehensive overview of Q2 2025 performance metrics:
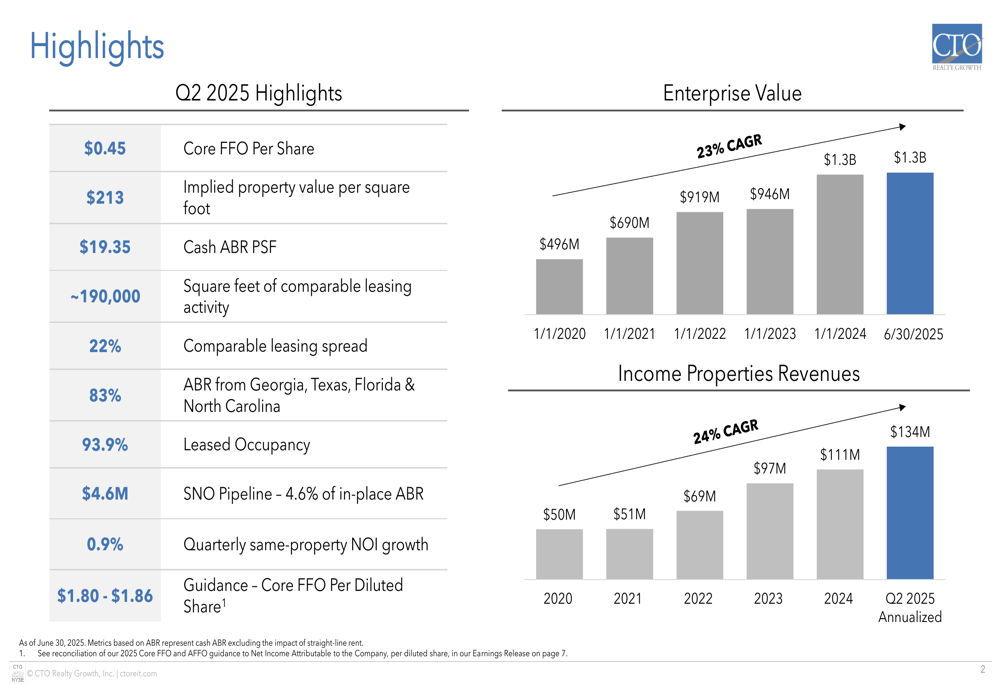
The company’s enterprise value has grown at a 23% CAGR since 2020, reaching $1.3 billion as of June 30, 2025. Similarly, income properties revenues have increased at a 24% CAGR over the same period, with Q2 2025 annualized revenues of $134 million. These growth rates reflect CTO’s successful execution of its acquisition and leasing strategies.
Key portfolio metrics remain strong, with leased occupancy at 93.9% and a signed-not-open (SNO) pipeline representing 4.6% of in-place annual base rent (ABR), or $4.6 million. This pipeline provides visibility into future revenue growth as these leases commence operations.
Portfolio Strategy and Transformation
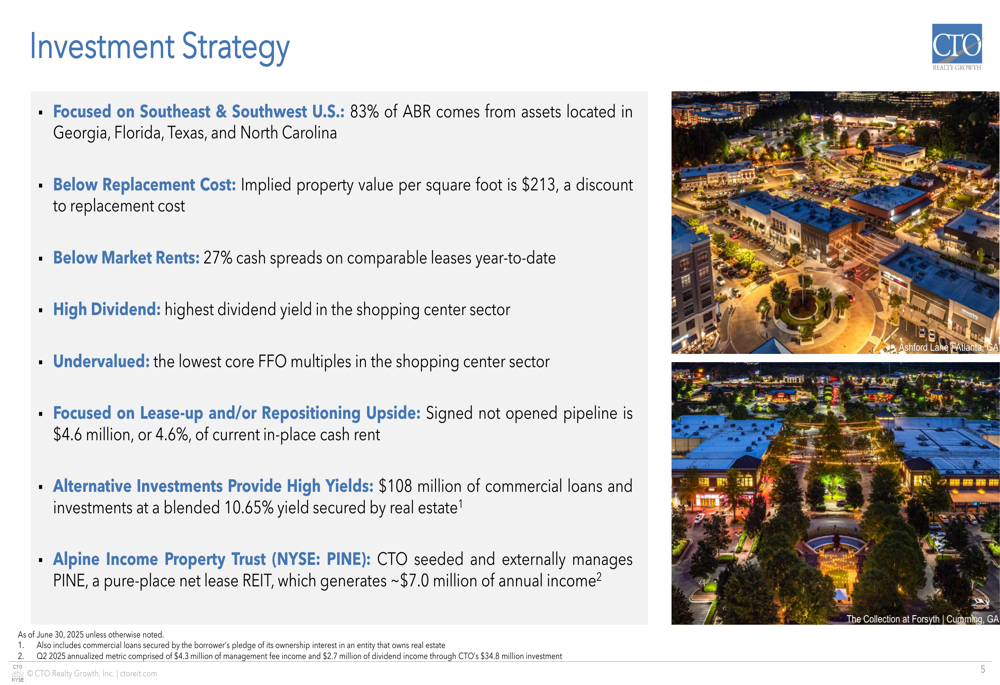
CTO has strategically transformed its portfolio to focus on high-quality retail properties in growing markets. The company’s investment strategy emphasizes properties in the Southeast and Southwest United States, with 83% of ABR coming from Georgia, Texas, Florida, and North Carolina.
The company’s strategic approach is clearly outlined in its investment priorities:
The portfolio transformation since 2019 has been substantial, with total square footage increasing from 1.8 million to 5.3 million and annualized base rent growing from $27.6 million to $101.7 million. The company has also shifted its focus toward multi-tenant retail properties, which now represent 95% of ABR compared to just 28% in 2019.
CTO’s portfolio now consists of 20% grocery-anchored retail (48% including shadow-anchored assets), 34% lifestyle centers, and 40% power centers. This diversified approach provides stability while maintaining upside potential through leasing and repositioning opportunities.
The company’s properties are located in markets with strong demographic profiles, as illustrated in this geographic breakdown:
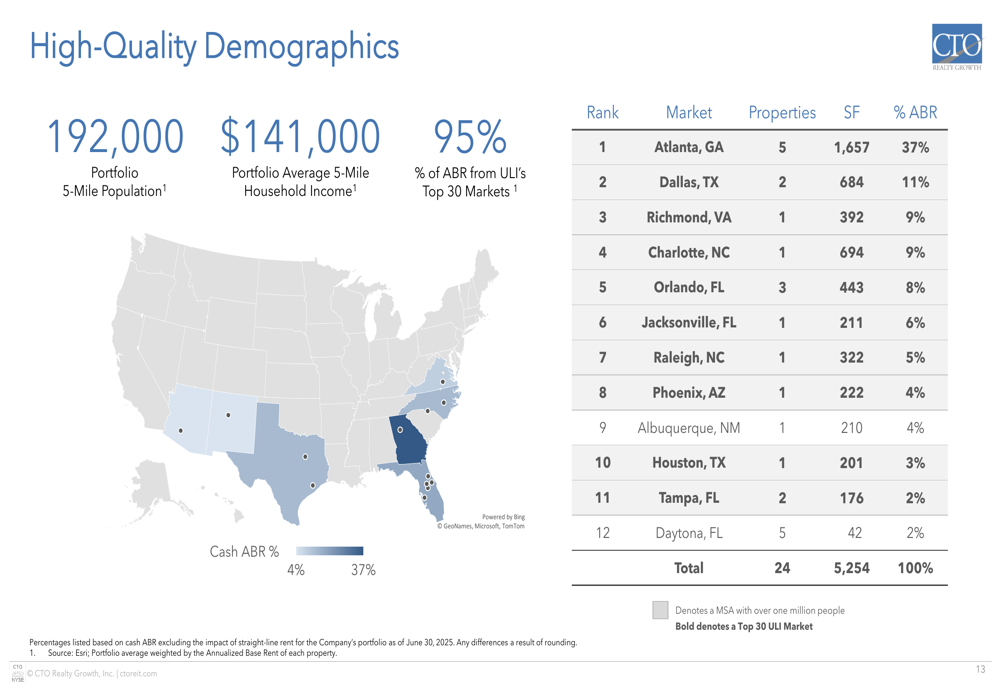
With an average 5-mile household income of $141,000 and 95% of ABR coming from ULI’s Top 30 Markets, CTO’s portfolio is well-positioned to benefit from population growth and strong consumer spending in these regions.
Leasing Momentum and Future Growth Drivers
One of the most compelling aspects of CTO’s presentation was its strong leasing execution. The company has completed 339,317 square feet of leasing year-to-date, representing 6% of its portfolio. New leases achieved an impressive 81% cash spread, while renewals and extensions saw a 7% increase, resulting in a blended spread of 27%.
The company’s leasing momentum is detailed in the following breakdown:
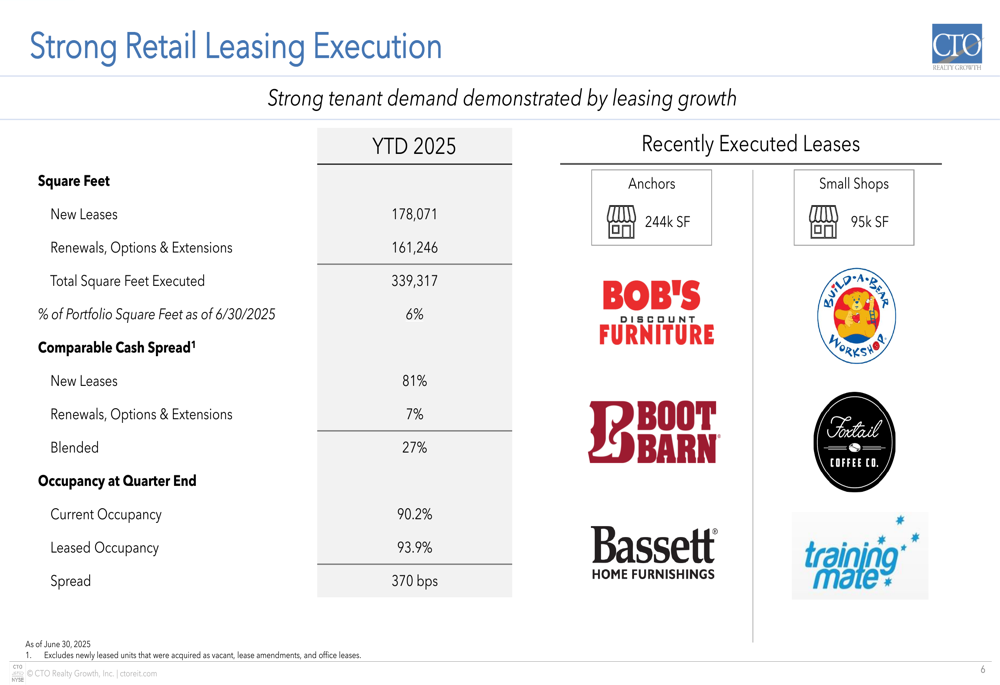
CTO is also capitalizing on opportunities created by recent store closings, with estimated leasing spreads of 40-60% on spaces previously occupied by retailers like JoAnn and Party City. The company has already released several of these spaces to tenants including Burlington (NYSE:BURL), Boot Barn (NYSE:BOOT), and Bob’s Discount Furniture at significantly higher rents.
The signed-not-open pipeline represents another growth driver, with $4.6 million in future annual base rent that will be recognized primarily in 2026. This pipeline delivers a 14% premium to in-place cash rent on a per-square-foot basis, further enhancing the company’s revenue growth potential.
CTO has demonstrated its ability to create value through leasing at properties acquired in recent years. For example, at The Collection at Forsyth in Atlanta, which was acquired in December 2022, the company has increased leased occupancy by 300 basis points to 89% while achieving an 11% blended comparable spread on new leases.
Financial Position and Outlook
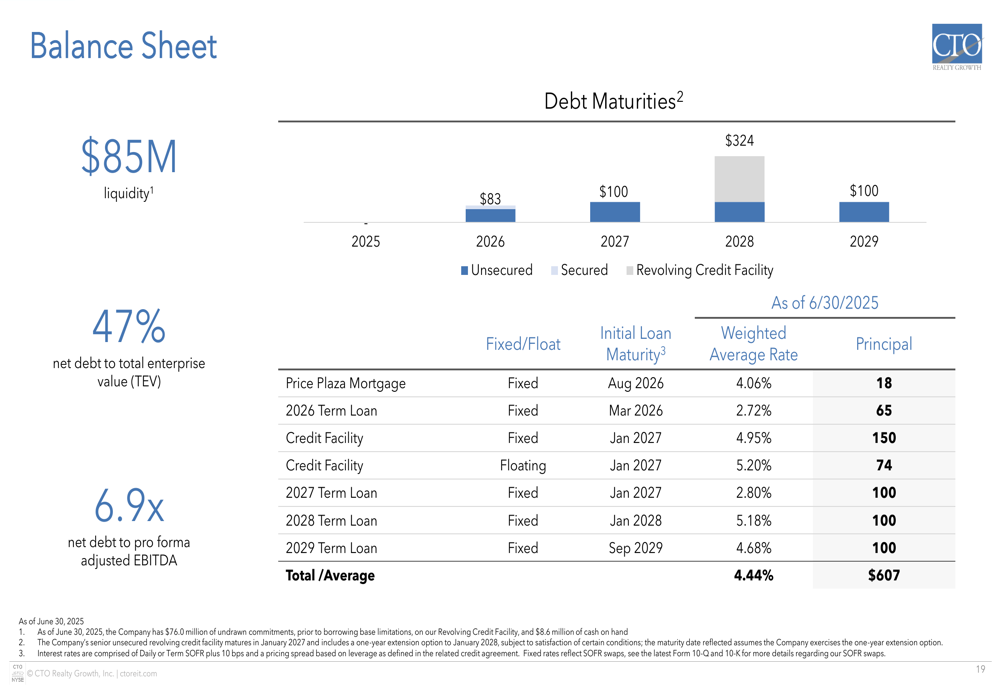
CTO maintains a solid balance sheet with $85 million of liquidity as of June 30, 2025. The company’s net debt to total enterprise value stands at 47%, with a net debt to adjusted EBITDA ratio of 6.9x. This represents a slight increase from the 6.6x reported in Q1 2025, potentially reflecting recent acquisition activity.
The company’s debt structure and maturity schedule is presented here:
For the full year 2025, CTO has provided guidance for Core FFO per diluted share of $1.80 to $1.86 and AFFO per diluted share of $1.93 to $1.98. The company expects same-property NOI growth of approximately 1.0% and anticipates making investments of $100-200 million with target initial cash yields of 8.00-8.50%.
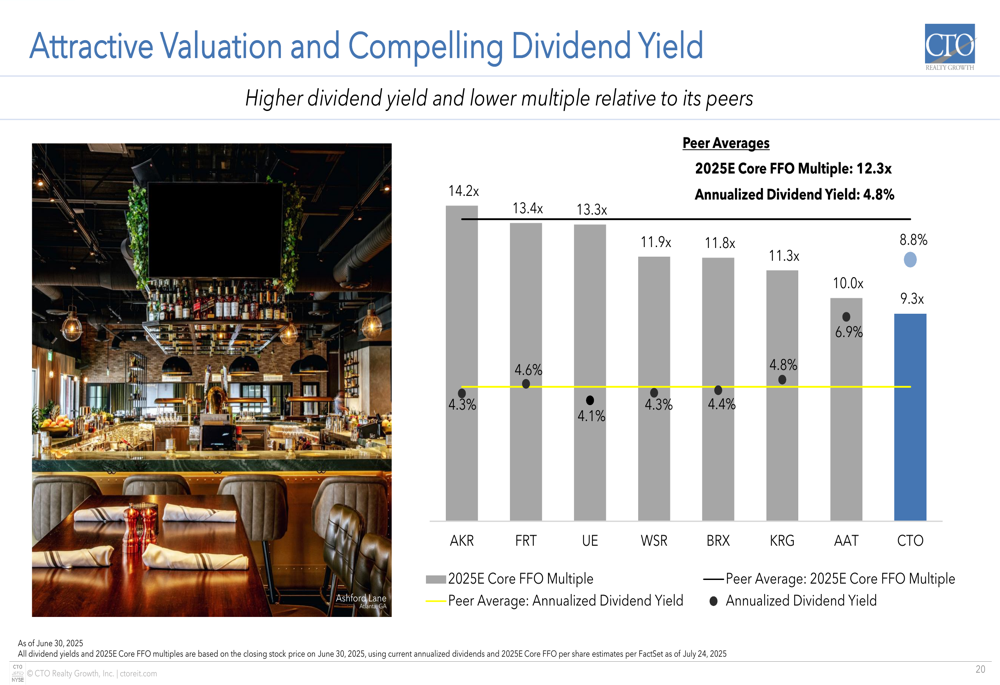
From a valuation perspective, CTO appears attractive compared to its peers, trading at a 2025E Core FFO multiple of 9.4x versus the peer average of 12.3x. Similarly, its annualized dividend yield of 8.8% significantly exceeds the peer average of 4.8%, offering investors an appealing income opportunity.
The company’s compelling valuation metrics relative to peers are illustrated in this comparison:
In addition to its core property portfolio, CTO generates income through its structured investments portfolio, which totals $108 million with a yield of 10.65%, and its management of and investment in Alpine Income Property Trust (NYSE:PINE), which provides approximately $7.0 million in annual income.
As CTO Realty Growth continues to execute its strategy focused on high-quality retail properties in growing markets, the company appears well-positioned to maintain its growth trajectory and attractive dividend yield, offering investors a compelling combination of income and potential capital appreciation.
Full presentation:
This article was generated with the support of AI and reviewed by an editor. For more information see our T&C.