Stock market today: Nasdaq closes above 23,000 for first time as tech rebounds

Introduction & Market Context
Dycom Industries Inc (NYSE:DY) released its second quarter 2026 results on August 20, 2025, reporting significant growth in revenue and profitability, though the stock fell 6.89% in premarket trading to $251, suggesting a disconnect between the company’s performance and market expectations.
The telecommunications infrastructure provider delivered double-digit revenue growth and substantial margin expansion, continuing the momentum seen in its strong first quarter results. However, investors appeared to focus on other factors, potentially including concerns about the sustainability of growth rates or broader market conditions.
Quarterly Performance Highlights
Dycom reported total contract revenues of $1,377.9 million for Q2 2026, representing a 14.5% increase compared to $1,203.1 million in the same period last year. Organic revenue growth, which excludes contributions from acquired businesses, was 3.4%.
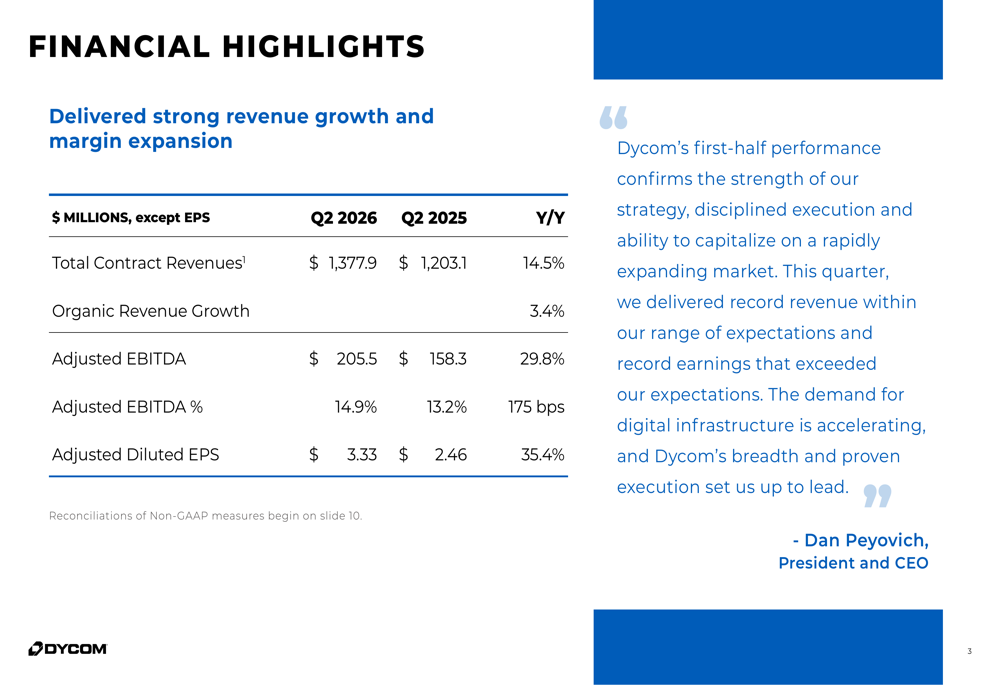
The company achieved significant profitability improvements, with adjusted EBITDA rising 29.8% year-over-year to $205.5 million. The adjusted EBITDA margin expanded 175 basis points to 14.9%, compared to 13.2% in Q2 2025. Adjusted diluted earnings per share increased 35.4% to $3.33 from $2.46 in the prior-year quarter.
Dan Peyovich, President and CEO, highlighted the company’s execution in his statement: "Dycom’s first-half performance confirms the strength of our strategy, disciplined execution and ability to capitalize on a rapidly expanding market. This quarter, we delivered record revenue within our range of expectations and record earnings that exceeded our expectations."
Backlog and Industry Position
Dycom’s backlog continues to show strong growth, indicating robust future demand for its services. The company’s total backlog reached $7.989 billion in Q2 2026, up 16.9% year-over-year, while the next 12-month backlog grew 20.2% to $4.604 billion.
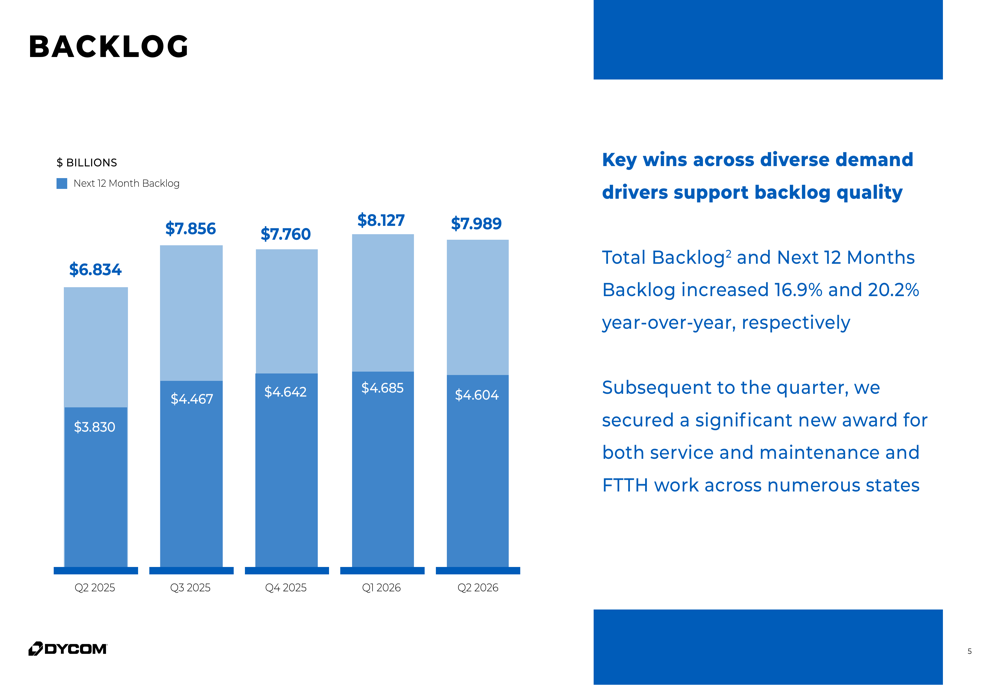
The company secured a significant new award for both service and maintenance and fiber-to-the-home work across numerous states subsequent to the quarter end, further strengthening its position.
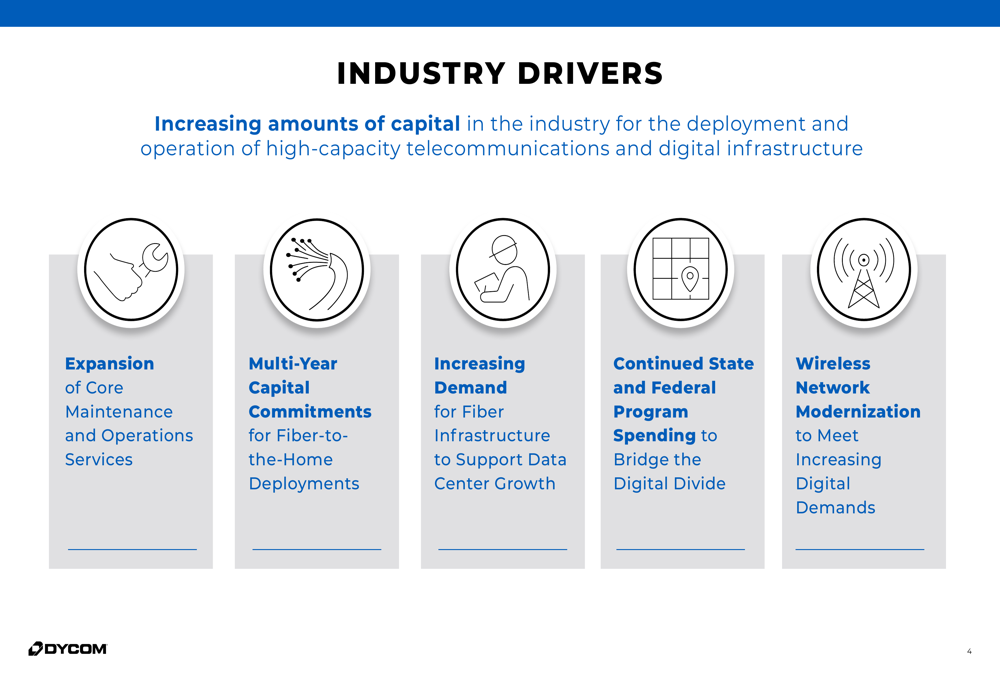
Dycom identified several key industry drivers supporting its growth trajectory, including expansion of core maintenance and operations services, multi-year capital commitments for fiber-to-the-home deployments, increasing demand for fiber infrastructure to support data center growth, continued state and federal program spending to bridge the digital divide, and wireless network modernization.
Financial Position
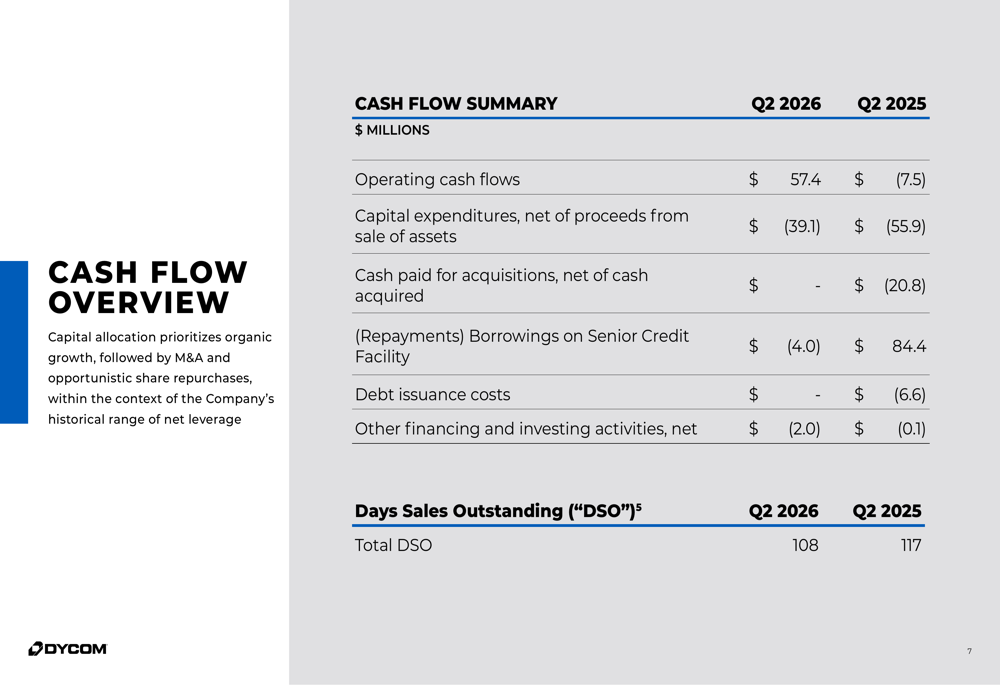
Dycom’s financial position showed improvement across several metrics. Operating cash flow turned positive at $57.4 million in Q2 2026, compared to negative $7.5 million in Q2 2025. Capital expenditures decreased to $39.1 million from $55.9 million in the prior-year period, reflecting improved capital efficiency.
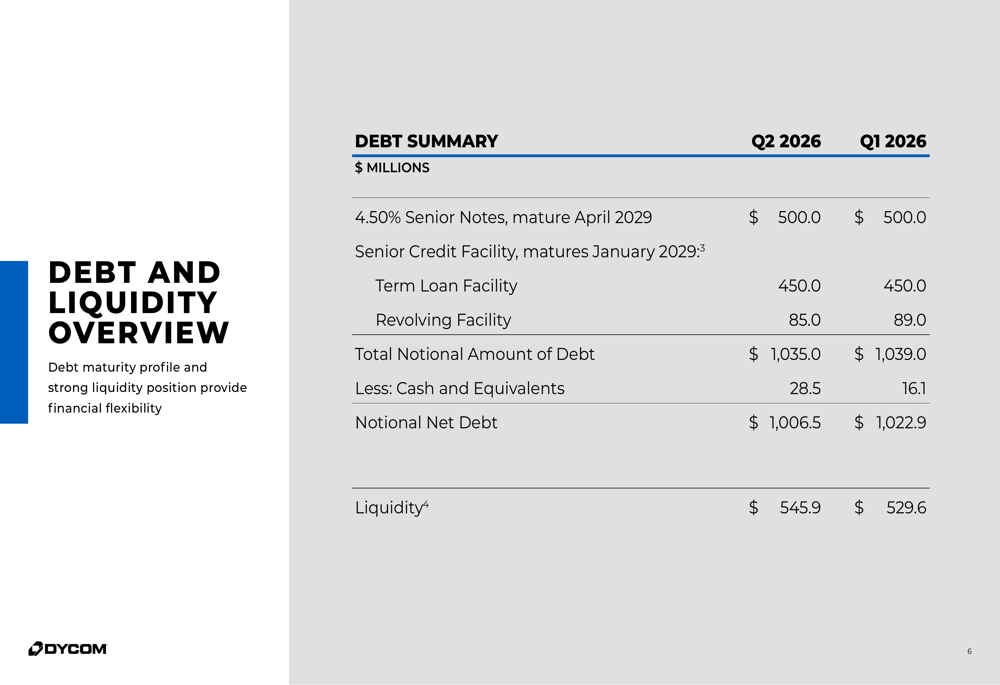
The company maintained a stable debt profile with total notional debt of $1,035.0 million, slightly down from $1,039.0 million in the previous quarter. Liquidity improved to $545.9 million from $529.6 million in Q1 2026, providing financial flexibility for future growth initiatives.
Days Sales Outstanding (DSO) improved to 108 days from 117 days in the year-ago period, indicating better working capital management. The company noted that its capital allocation priorities remain focused on organic growth, followed by M&A and opportunistic share repurchases, within its historical range of net leverage.
Forward Guidance
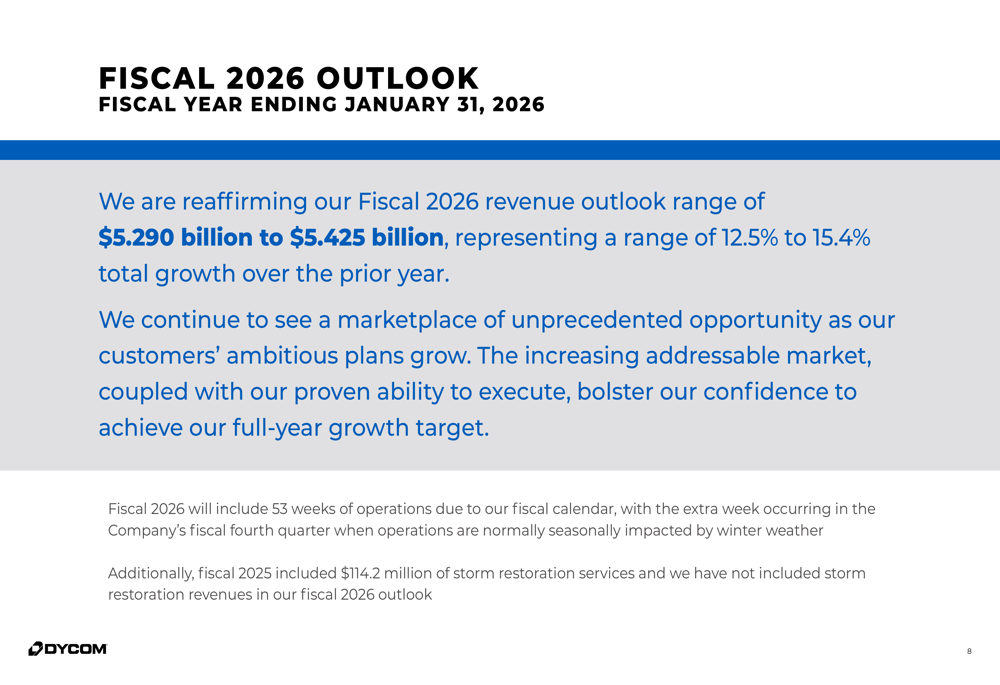
Dycom reaffirmed its fiscal 2026 revenue outlook range of $5.290 billion to $5.425 billion, representing growth of 12.5% to 15.4% over the prior year. The company noted that fiscal 2026 will include 53 weeks of operations and that the fiscal 2025 figure included $114.2 million of storm restoration services not included in the 2026 outlook.
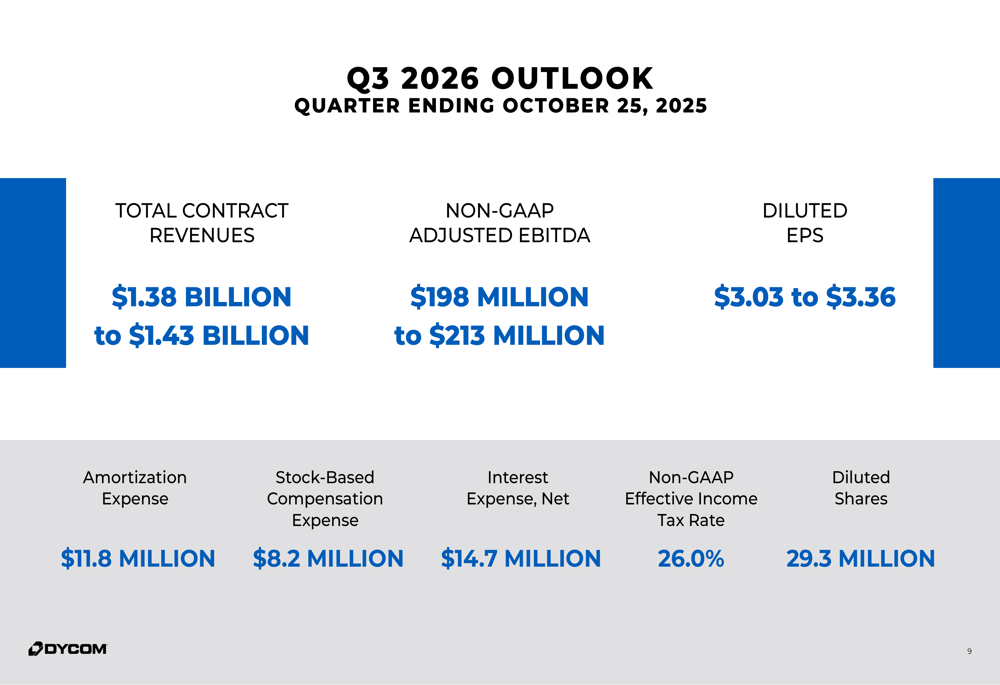
For the third quarter of fiscal 2026, Dycom expects total contract revenues between $1.38 billion and $1.43 billion, with non-GAAP adjusted EBITDA of $198 million to $213 million. The company projects diluted EPS of $3.03 to $3.36 for Q3.
"We continue to see a marketplace of unprecedented opportunity as our customers’ ambitious plans grow. The increasing addressable market, coupled with our proven ability to execute, bolster our confidence to achieve our full-year growth target," the company stated in its presentation.
Market Reaction and Outlook
Despite the strong results and positive outlook, Dycom’s stock declined 6.89% in premarket trading to $251, following a 1.22% drop in the previous session. This reaction suggests investors may have had even higher expectations or concerns about the sustainability of growth rates.
The company’s performance builds on its strong Q1 2026 results, when it reported earnings per share of $2.90, significantly exceeding the forecasted $1.65, and revenue of $1.259 billion against expectations of $1.19 billion.
With continued demand for digital infrastructure deployment and the company’s strong execution capabilities, Dycom remains well-positioned in the telecommunications infrastructure market. However, investors will likely watch closely for signs that the company can maintain its growth trajectory and margin expansion in coming quarters.
Full presentation:
This article was generated with the support of AI and reviewed by an editor. For more information see our T&C.