Domo signs strategic collaboration agreement with AWS for AI solutions

Introduction & Market Context
EastGroup Properties (NYSE:EGP), a self-administered equity REIT focused on industrial properties, has released its July 2024 corporate presentation highlighting strong second-quarter performance and its strategic positioning in high-growth Sunbelt markets. The company, which specializes in multi-tenant urban distribution properties, continues to benefit from its focus on shallow bay industrial spaces in supply-constrained submarkets.
The industrial REIT operates approximately 60.2 million square feet of space, primarily targeting properties between 20,000 and 100,000 square feet that serve last-mile e-commerce and location-sensitive customers. This strategic focus has positioned EastGroup in markets that significantly outperform the broader U.S. economy.
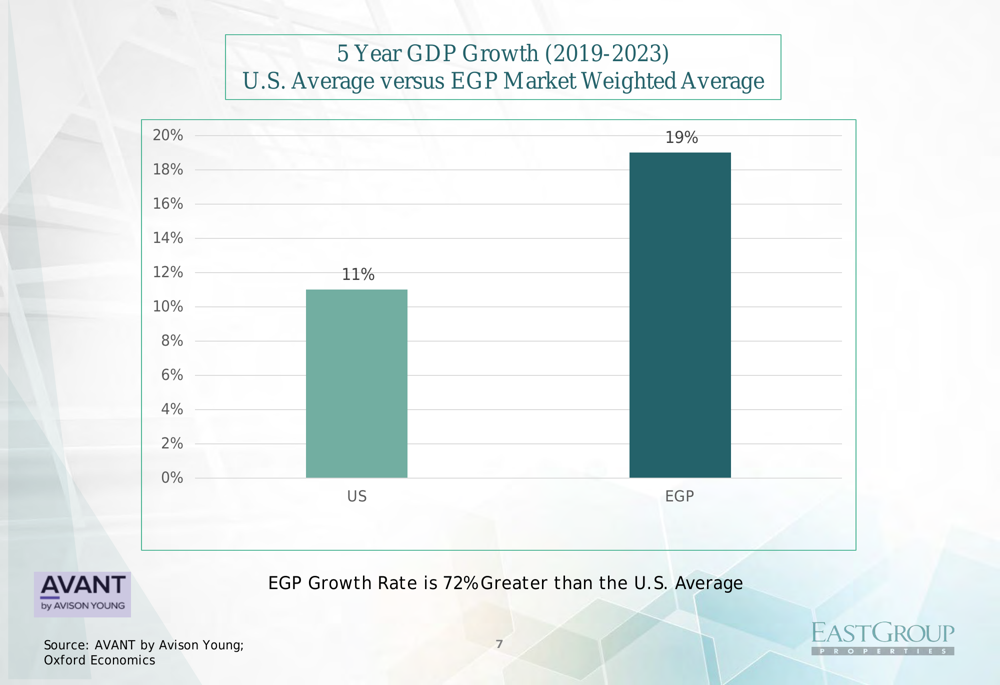
As shown in the following chart comparing GDP growth between 2019-2023, EastGroup’s market-weighted average growth rate of 19% substantially outpaced the U.S. average of 11%, representing a 72% higher growth rate:
Q2 2024 Performance Highlights
EastGroup reported impressive operating results for the quarter ended June 30, 2024. The company achieved a 5.3% increase in same-property results on a cash basis and a 9.4% increase in FFO per diluted share. The portfolio maintained a strong leased rate of 97.4% as of quarter-end, demonstrating continued robust demand for industrial space in its target markets.
The company’s property net operating income remains well-diversified across its Sunbelt footprint, with Texas contributing 34%, Florida 25%, California 17%, Arizona 7%, North Carolina 6%, and other markets 11%. This geographic diversification across high-growth markets provides both stability and growth opportunities.
Strategic Focus on Shallow Bay Properties
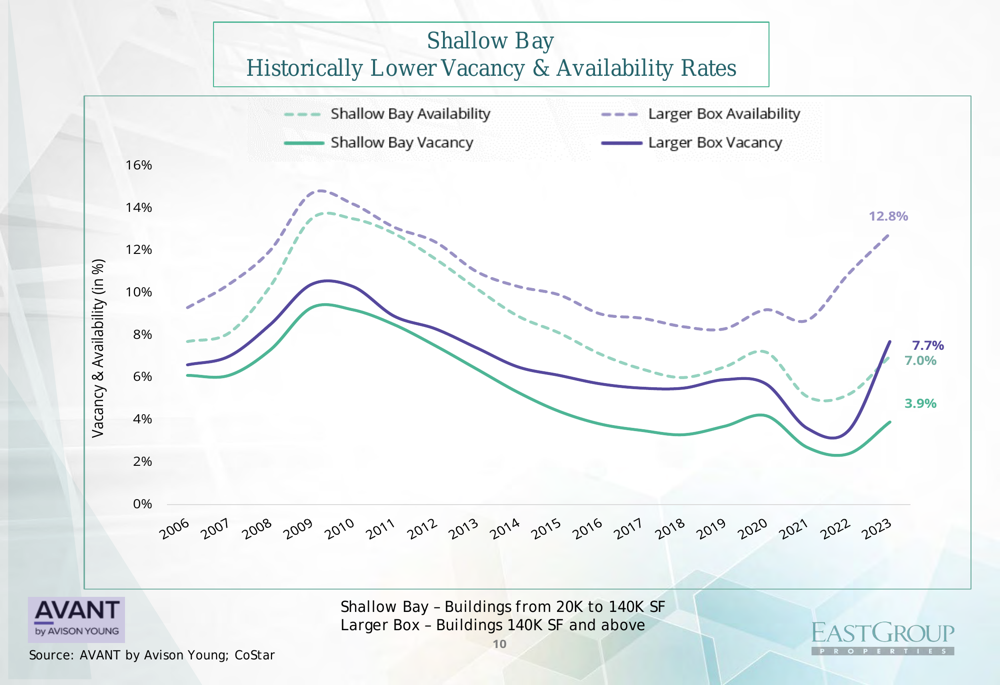
A key differentiator in EastGroup’s strategy is its focus on shallow bay industrial properties (20,000 to 140,000 square feet), which have historically demonstrated lower vacancy rates compared to larger box facilities. The company’s presentation highlights this advantage with data showing consistently lower vacancy and availability rates for shallow bay properties over time.
As illustrated in the following chart, shallow bay properties have maintained lower vacancy rates than larger box properties, with shallow bay vacancy at 3.9% compared to 12.8% for larger box properties as of 2023:
This strategic positioning is further supported by data showing that shallow bay development as a percentage of existing stock remains much lower than larger box development, suggesting less supply pressure in EastGroup’s target market segment.
Development Program and Growth Strategy
EastGroup employs a four-pronged growth strategy focusing on targeted development, acquisitions, capital recycling, and internal growth. As of June 30, 2024, the company had 18 development projects across 12 markets, comprising 4.1 million square feet with projected total costs of $584 million.
The company’s development history is impressive, with 261 properties developed since 1996, representing 29.8 million square feet and $3.0 billion in investment. This development activity now accounts for approximately 50% of EastGroup’s portfolio, demonstrating the success of its build-to-core strategy.
For 2024, the company has already completed $111 million in operating property acquisitions totaling 505,000 square feet across two markets, continuing its disciplined approach to external growth.
Financial Position and Shareholder Returns
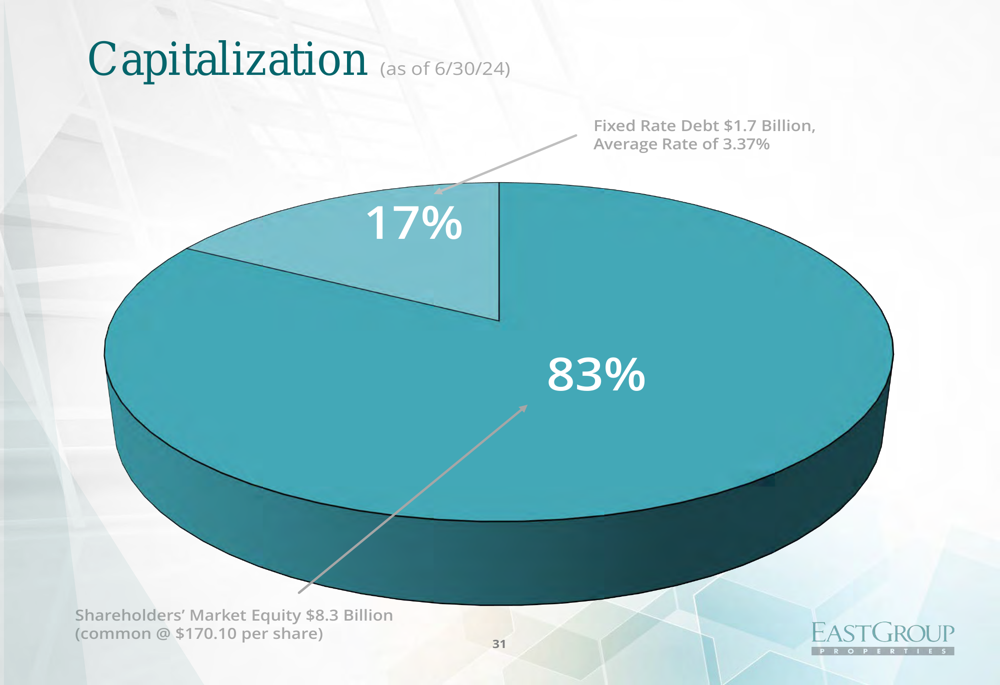
EastGroup maintains a conservative capital structure with 17% fixed-rate debt ($1.7 billion at an average rate of 3.37%) and 83% shareholders’ market equity ($8.3 billion at $170.10 per share) as of June 30, 2024. This balanced approach to capitalization is illustrated in the following chart:
The company has declared its 178th consecutive quarterly cash dividend of $1.27 per share, having increased or maintained its dividend for 31 consecutive years. Notably, EastGroup has increased its dividend in 28 of the past 31 years, including each of the last 12 years.
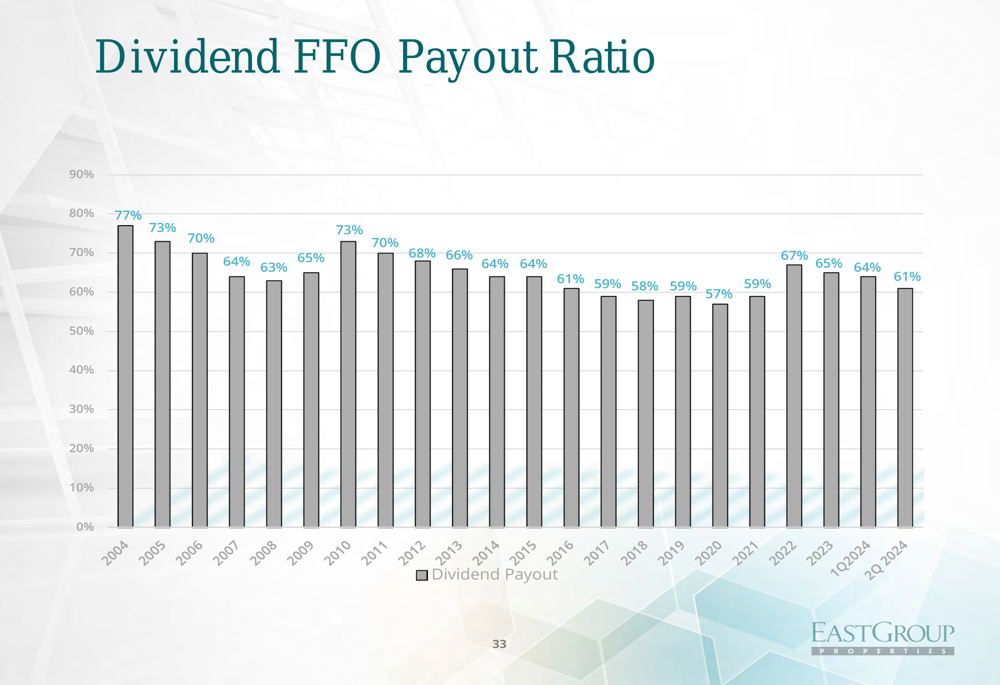
The dividend is well-supported by funds from operations, with the FFO payout ratio improving from 77% in 2004 to 61% in Q2 2024, as shown in the following chart:
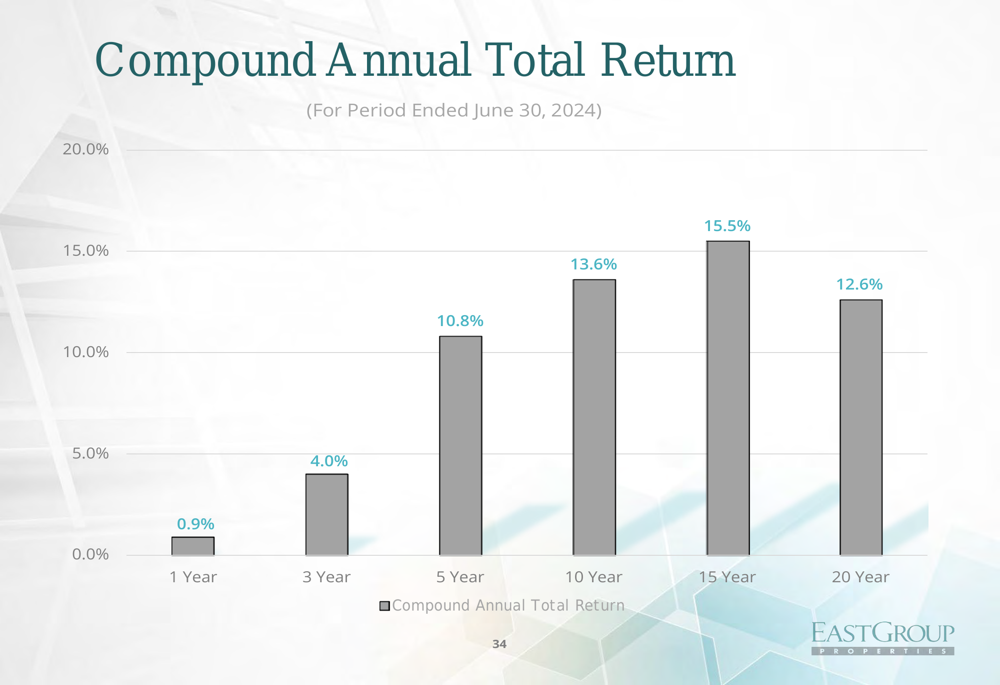
EastGroup’s investment performance has been strong over the long term, with compound annual total returns of 10.8% over five years, 13.6% over ten years, and 15.5% over fifteen years as of June 30, 2024:
Environmental Initiatives and Corporate Culture
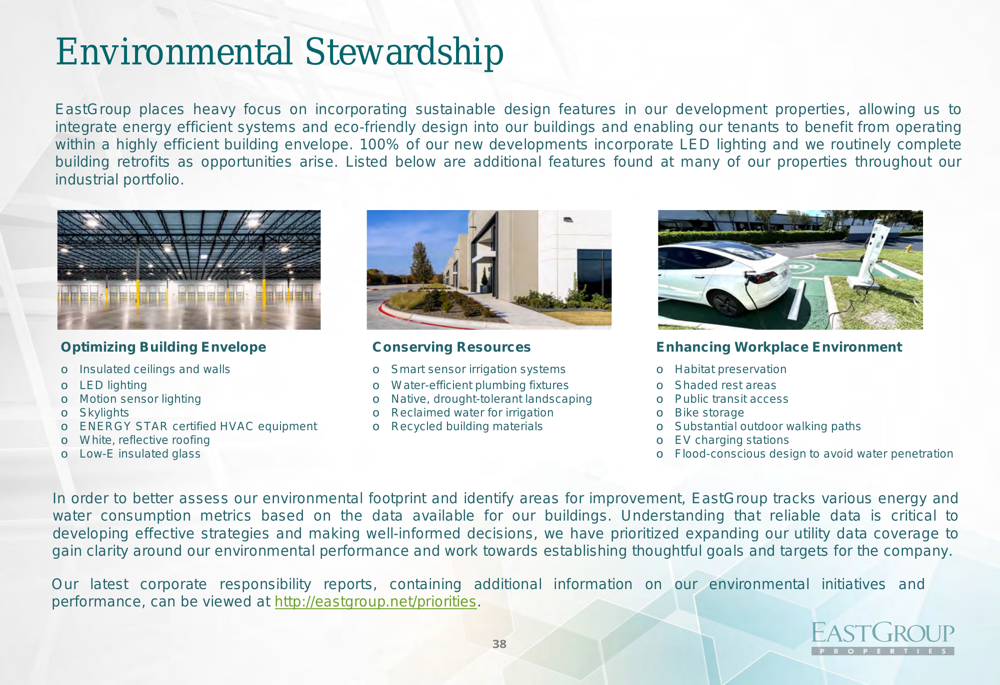
The presentation also highlights EastGroup’s commitment to environmental stewardship, with a focus on incorporating sustainable design features in its development properties. The company emphasizes optimizing building envelopes, conserving resources, and enhancing workplace environments.
As shown in the following image, EastGroup places significant emphasis on environmental initiatives across its portfolio:
The company also emphasizes its corporate culture, noting that 13% of employees self-identify as members of a racial or ethnic minority group. The average tenure of the workforce is 9 years, with officers averaging 13 years, suggesting strong employee retention.
Forward Outlook
Looking ahead, EastGroup appears well-positioned to continue its growth trajectory, leveraging its strategic focus on shallow bay industrial properties in high-growth Sunbelt markets. The company’s presentation notes that construction starts increased in Q2 2024 but remain much lower than 2022 levels, which could benefit existing property owners like EastGroup by limiting new supply.
The company’s strong leasing performance, with renewals consistently representing over 30% of total leasing for seven consecutive quarters, suggests tenant satisfaction and stability in its portfolio. With a diversified tenant base (top 10 customers representing only 7.8% of annualized base rent) and 75% of revenue generated from tenants leasing under 100,000 square feet, EastGroup maintains a resilient income stream.
This outlook aligns with the company’s recent Q1 2025 earnings report, which showed continued strong performance with a 7.1% year-over-year increase in FFO per share to $2.12 and occupancy rates remaining robust at 96.5%. EastGroup’s guidance for full-year FFO between $8.81 and $9.01 per share suggests continued confidence in its business model and growth strategy.
Full presentation:
This article was generated with the support of AI and reviewed by an editor. For more information see our T&C.