TSX jumps amid Fed rate cut hopes, ongoing U.S. government shutdown

Introduction & Market Context
Enterprise Financial Services Corp (NASDAQ:EFSC) released its second quarter 2025 earnings presentation on July 29, showing continued momentum from its strong first quarter performance. The regional bank reported earnings per share of $1.36, up from $1.31 in the previous quarter, driven by expanding net interest margin and balanced growth across its loan and deposit portfolios.
The company’s stock closed at $55.92 on July 28, representing a 0.8% increase, and has traded between $45.22 and $63.13 over the past 52 weeks, according to available market data.
Quarterly Performance Highlights
Enterprise Financial reported net income of $51.4 million for Q2 2025, an increase of $1.4 million from the previous quarter. The company’s net interest income rose to $152.8 million, up $5.2 million from Q1, while its net interest margin expanded to 4.21% from 4.15%.
Pre-provision net revenue (PPNR) reached $68.1 million, a $2.0 million increase from the linked quarter, while adjusted return on average assets (ROAA) improved to 1.31% from 1.29%.
As shown in the following comprehensive financial highlights chart:
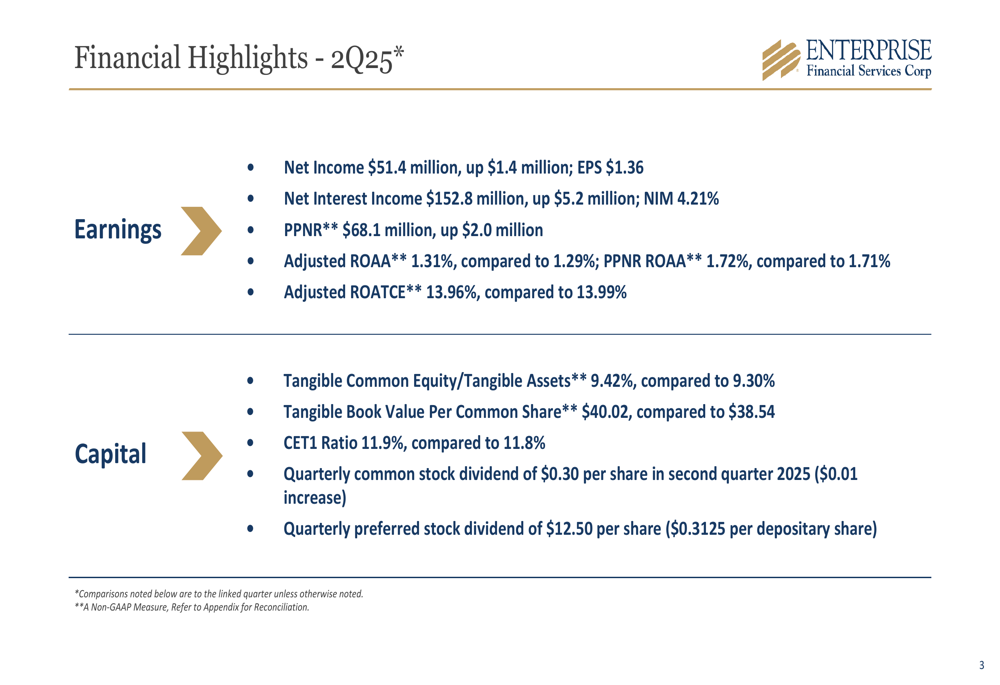
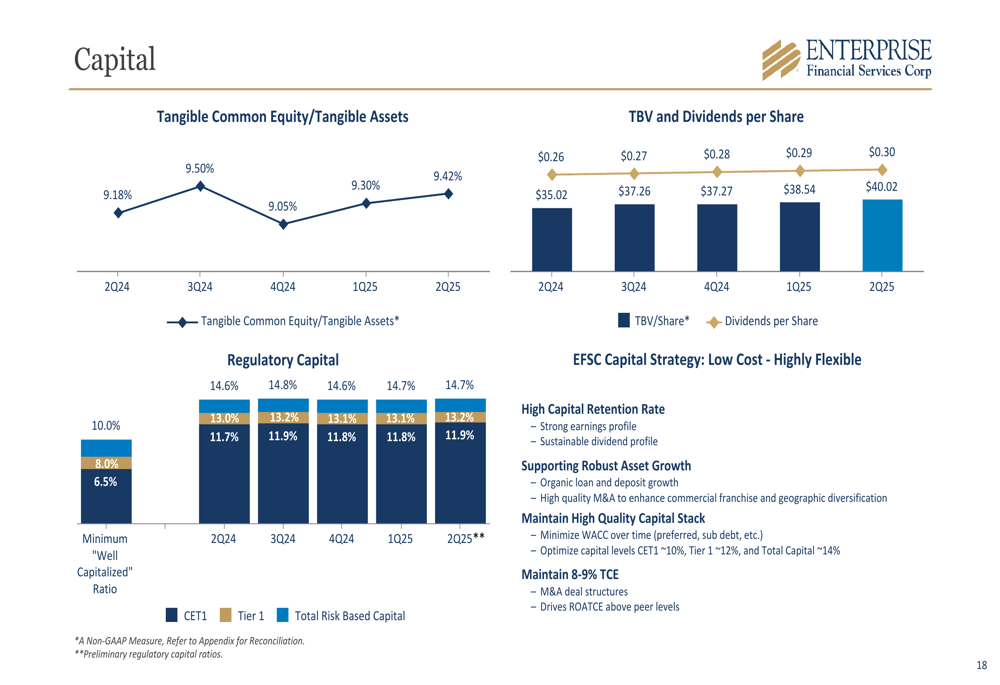
The company’s capital position strengthened during the quarter, with tangible common equity to tangible assets increasing to 9.42% from 9.30%. Tangible book value per common share grew to $40.02, up from $38.54 in the previous quarter, continuing a steady upward trend over the past year.
Detailed Financial Analysis
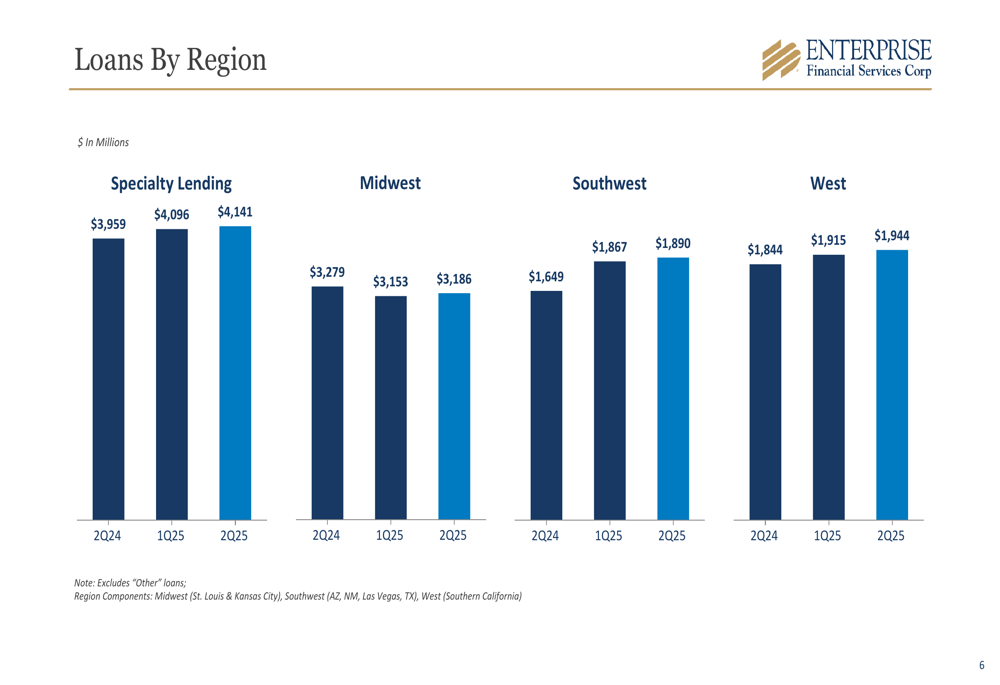
Enterprise Financial’s loan portfolio grew by $110.1 million to $11.4 billion during the quarter, with the strongest growth in commercial and industrial (C&I) loans, which increased by $118 million. Commercial real estate (CRE) investor-owned loans also showed solid growth of $61 million.
The company’s loan portfolio remains well-diversified across regions and specialty lending categories, as illustrated in this regional breakdown:
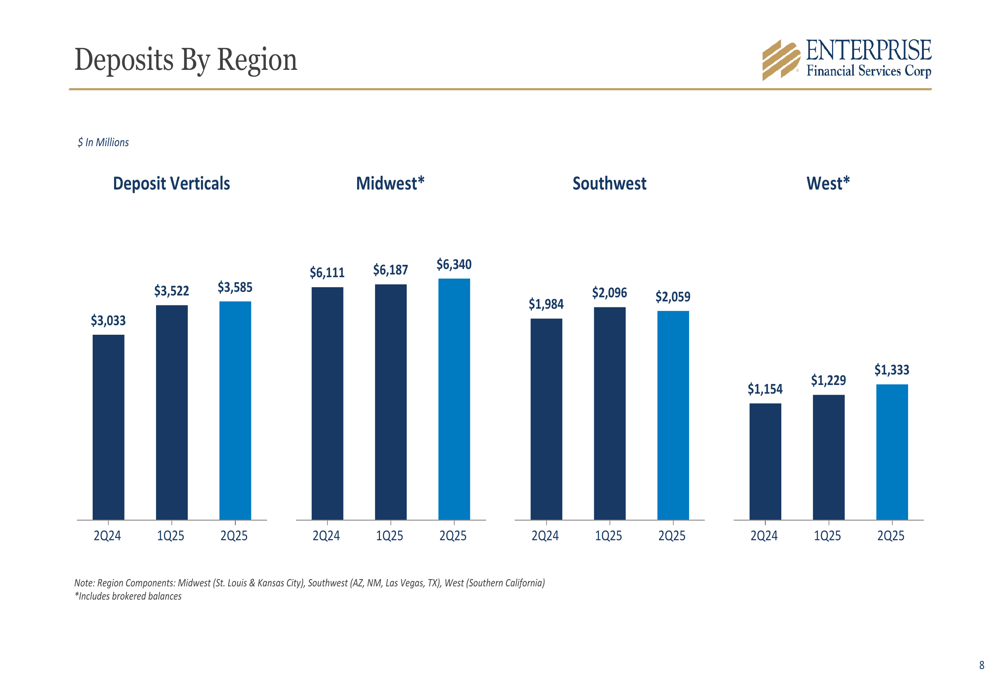
On the funding side, total deposits increased by $283.1 million to $13.3 billion, with $72.9 million of growth excluding brokered CDs. The deposit base remains well-diversified with noninterest-bearing deposits representing 32% of total deposits.
The deposit growth was spread across all regions, with particular strength in the Midwest and West markets:
Net interest income continued its upward trajectory, reaching $152.8 million in Q2 2025, compared to $147.5 million in Q1 and $140.5 million a year ago. This consistent growth pattern is clearly demonstrated in the following chart:
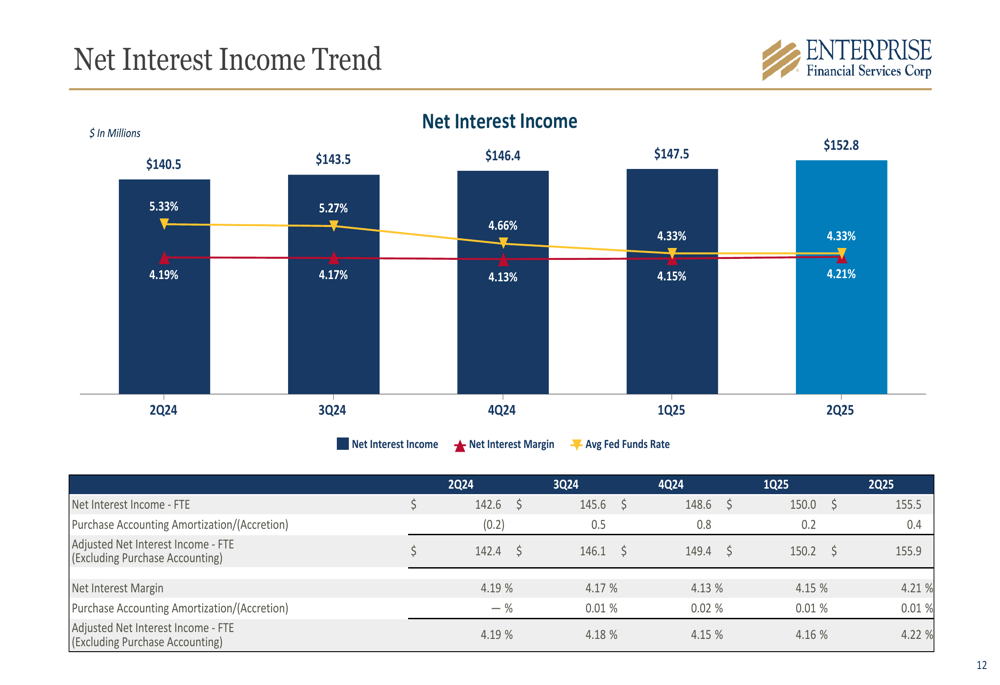
The improvement in net interest margin to 4.21% was driven by higher loan yields, improved securities yields, and favorable earning asset mix, which more than offset the impact of higher funding costs.
Strategic Initiatives
A key differentiator for Enterprise Financial is its specialized deposit verticals, which totaled $3.59 billion or 27% of total deposits in Q2 2025. These verticals include community associations, property management, and legal industry and escrow services, providing a stable and cost-effective funding source.
The following chart illustrates the composition and growth of these specialized deposit verticals:
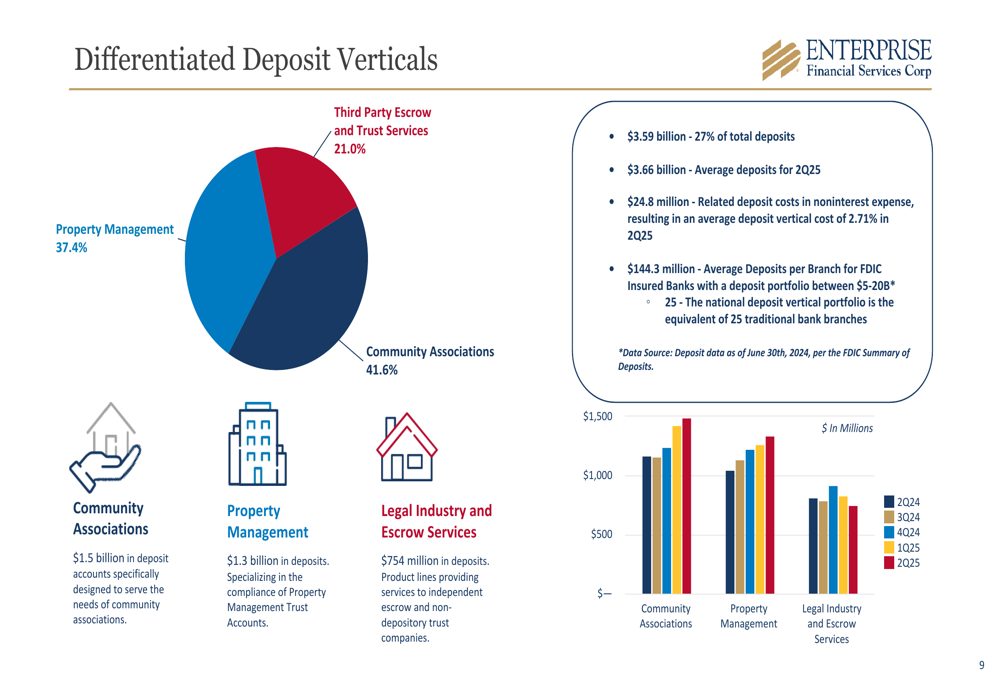
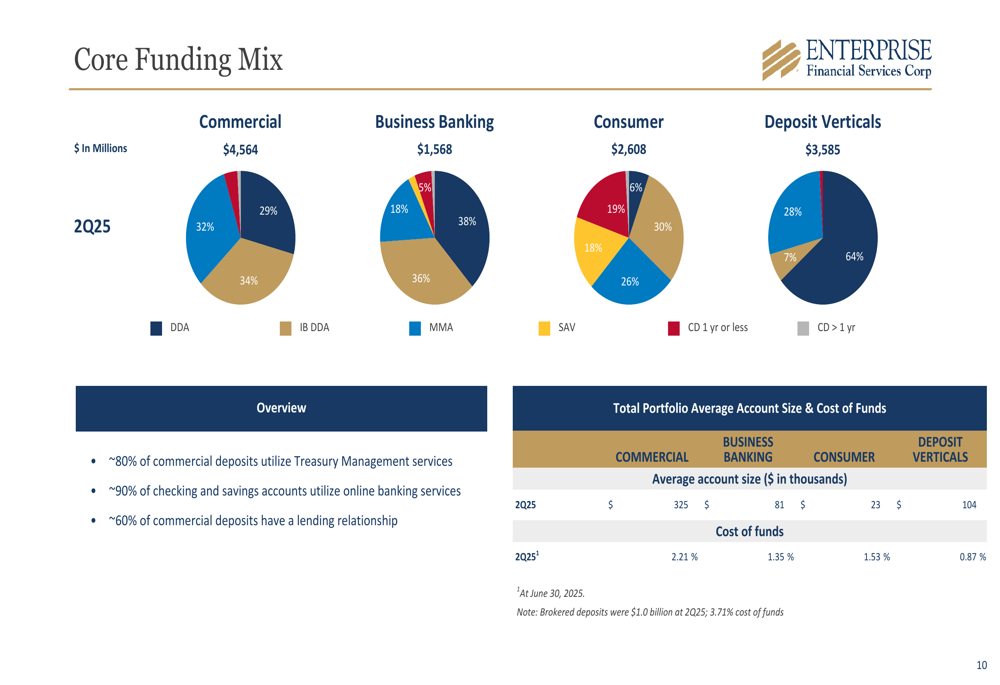
These deposit verticals effectively function as the equivalent of 25 traditional bank branches, significantly enhancing the company’s deposit-gathering efficiency. The average cost of funds for these verticals was just 0.87% in Q2 2025, substantially lower than the 2.21% cost for commercial deposits.
Enterprise Financial also maintains a well-diversified core funding mix across commercial, business banking, consumer, and deposit vertical segments:
Asset Quality and Risk Management
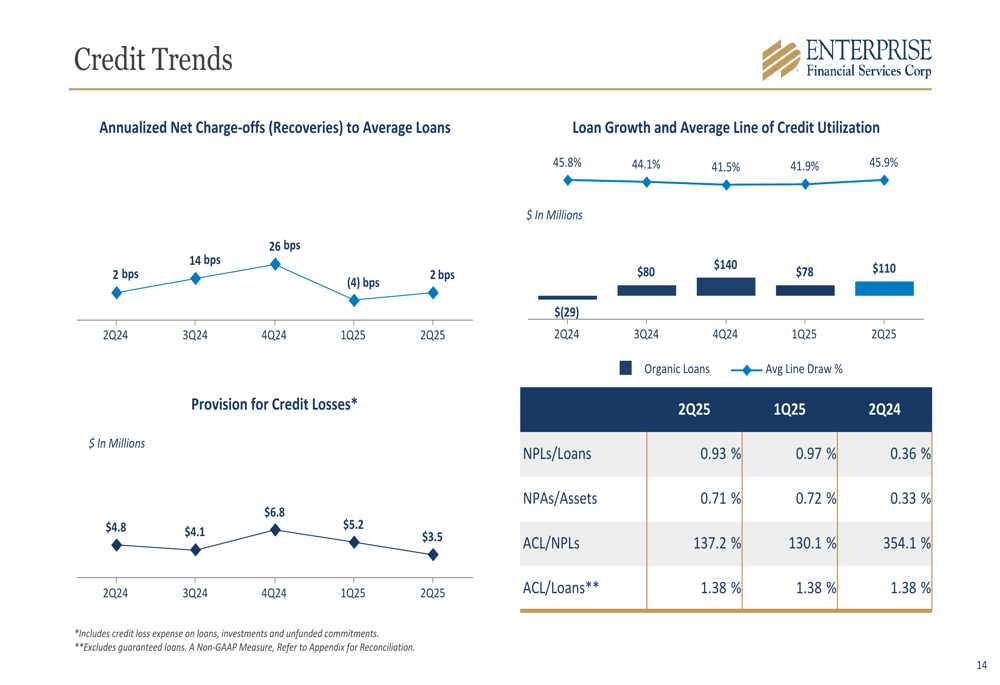
Asset quality remained solid in Q2 2025, with nonperforming loans to total loans improving to 0.93% from 0.97% in the previous quarter. The allowance for credit losses stood at 1.27% of total loans, or 1.38% when excluding government-guaranteed loans.
Net charge-offs remained minimal at $0.6 million, or just 2 basis points of average loans on an annualized basis, as shown in the credit trends chart:
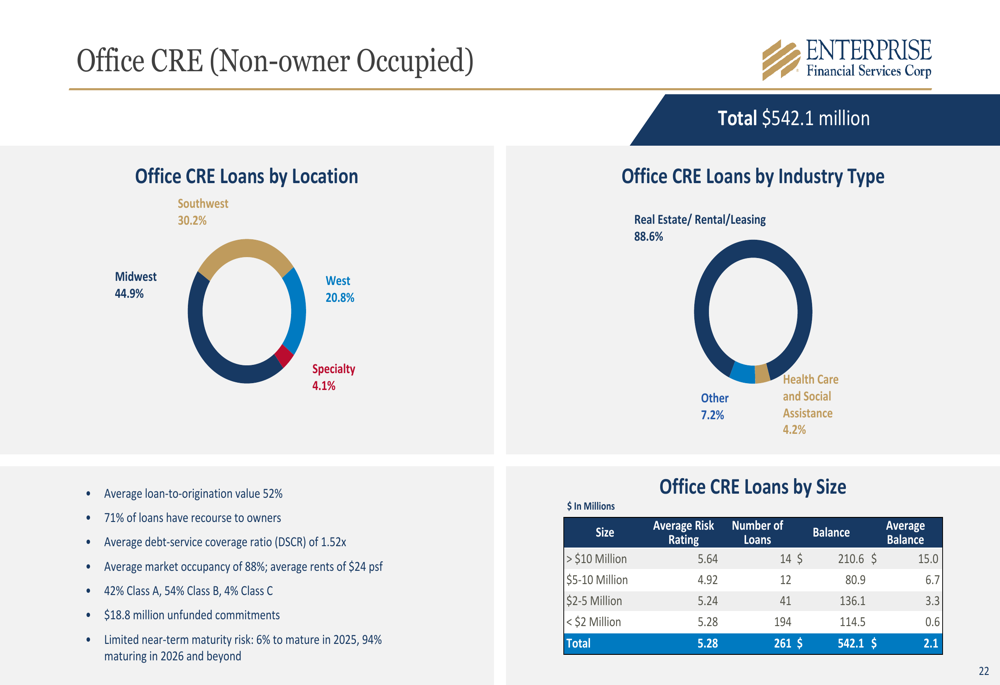
The company maintains a conservative approach to office commercial real estate exposure, a sector facing challenges in the current market environment. Enterprise Financial’s office CRE portfolio has an average loan-to-origination value of 52%, with 71% of loans having recourse to owners and an average debt service coverage ratio of 1.52x.
Capital and Liquidity Position
Enterprise Financial’s capital position strengthened during the quarter, with tangible common equity to tangible assets increasing to 9.42%. The company’s CET1 ratio improved to 11.9% from 11.8% in the previous quarter.
The company increased its quarterly common stock dividend to $0.30 per share, up from $0.29 in Q1 2025 and continuing a pattern of consistent dividend growth over the past year. Tangible book value per share has shown steady growth, reaching $40.02 in Q2 2025 compared to $35.02 a year ago.
Forward-Looking Statements
Building on the momentum from its first quarter, Enterprise Financial continues to demonstrate strong execution of its growth strategy. The Q1 earnings call had indicated expectations for mid-single-digit balance sheet growth and stable net interest margins, both of which appear to be on track based on the Q2 results.
The company’s differentiated deposit verticals and regional diversification provide a solid foundation for continued growth, while its strong capital and liquidity position offers flexibility to pursue strategic opportunities. With its net interest margin expanding and asset quality remaining solid, Enterprise Financial appears well-positioned to navigate the current banking environment.
The consistent improvement in financial metrics from Q1 to Q2 2025 aligns with management’s previous comments about starting the year with "a lot of momentum" and their strategic focus on "attracting new relationships, growing the balance sheet, doing it the right way."
Full presentation:
This article was generated with the support of AI and reviewed by an editor. For more information see our T&C.