Domo signs strategic collaboration agreement with AWS for AI solutions

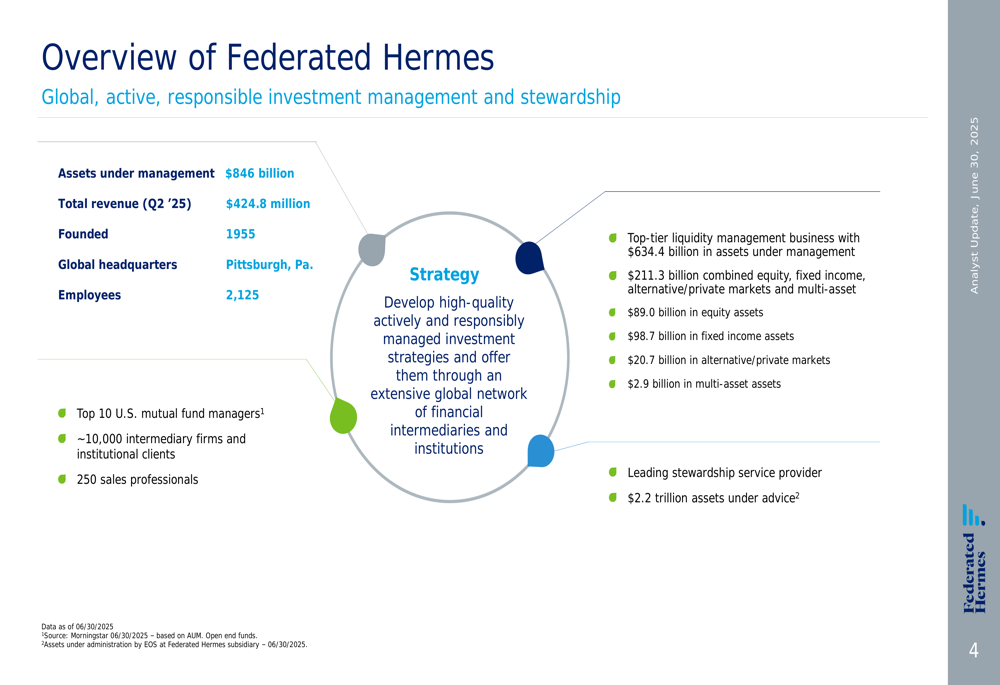
Federated Hermes, Inc. (NYSE:FHI) presented its Q2 2025 analyst update on August 1, revealing total assets under management (AUM) of $845.7 billion and earnings per share of $1.16. The company’s equity segment showed particular strength, growing 10% quarter-over-quarter, while the firm continued its track record of returning value to shareholders through dividends and share repurchases.
Quarterly Performance Highlights
Federated Hermes reported earnings per share of $1.16 for Q2 2025, following a strong Q1 where the company had posted $1.25 EPS. Total (EPA:TTEF) revenue for the quarter reached $424.8 million, with the company declaring a dividend of $0.34 per share.
The company’s asset mix showed varied performance across segments. Equity assets increased by $8.1 billion or 10% from the previous quarter to reach $89.0 billion. Fixed-income assets declined slightly by $0.8 billion (1.0%) to $98.7 billion, while liquidity assets decreased by $2.7 billion to $634.4 billion.
As shown in the following overview of the company’s key metrics:
Detailed Financial Analysis
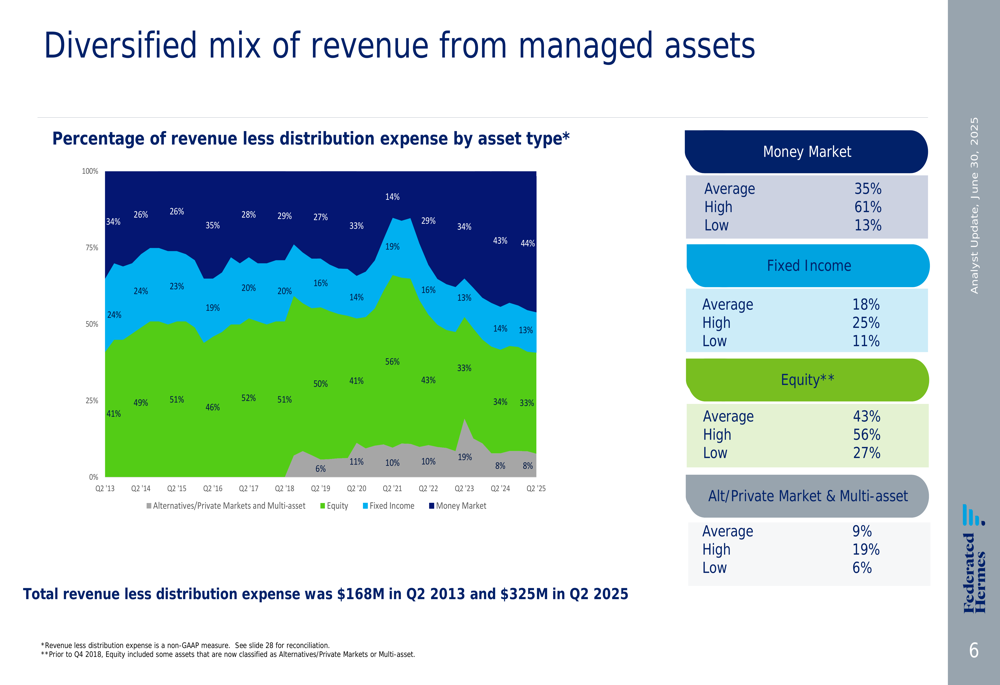
Federated Hermes maintains a diversified revenue stream across its various asset classes, which has helped provide stability even as different segments experience fluctuating performance. Despite liquidity assets representing approximately 75% of total AUM, the equity segment contributes a disproportionately higher percentage of revenue.
The following chart illustrates the company’s revenue mix evolution from Q2 2013 through Q2 2025:
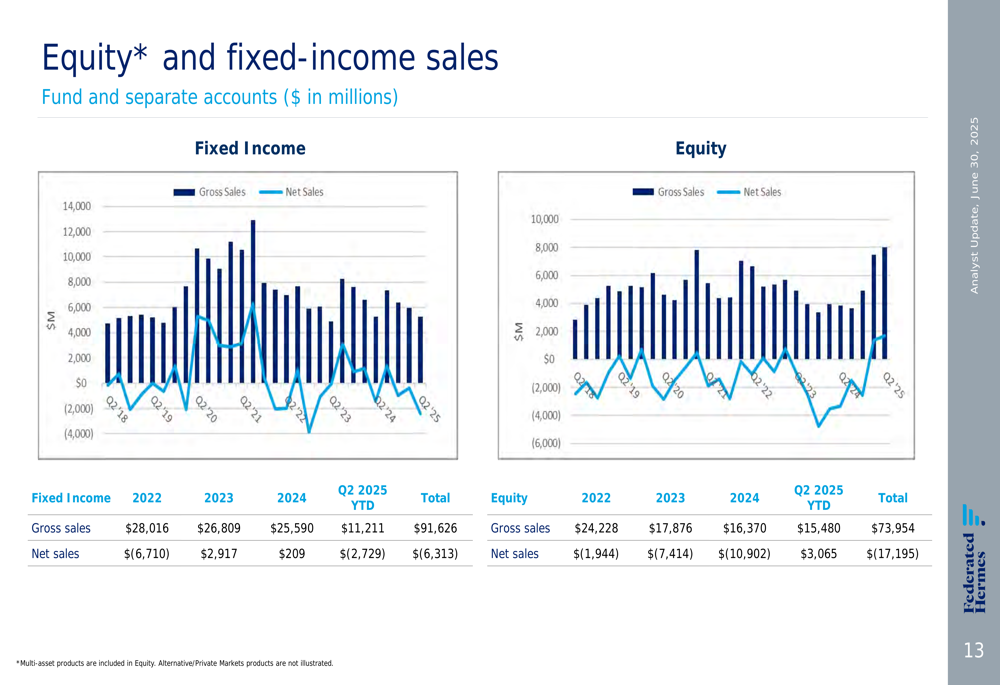
A significant development in Q2 2025 was the positive net sales in the equity segment, which reached $3,055 million year-to-date. This marks a substantial turnaround after experiencing net outflows of $1,944 million in 2022, $7,414 million in 2023, and $10,902 million in 2024.
The company’s sales performance across equity and fixed income segments is detailed in the following chart:
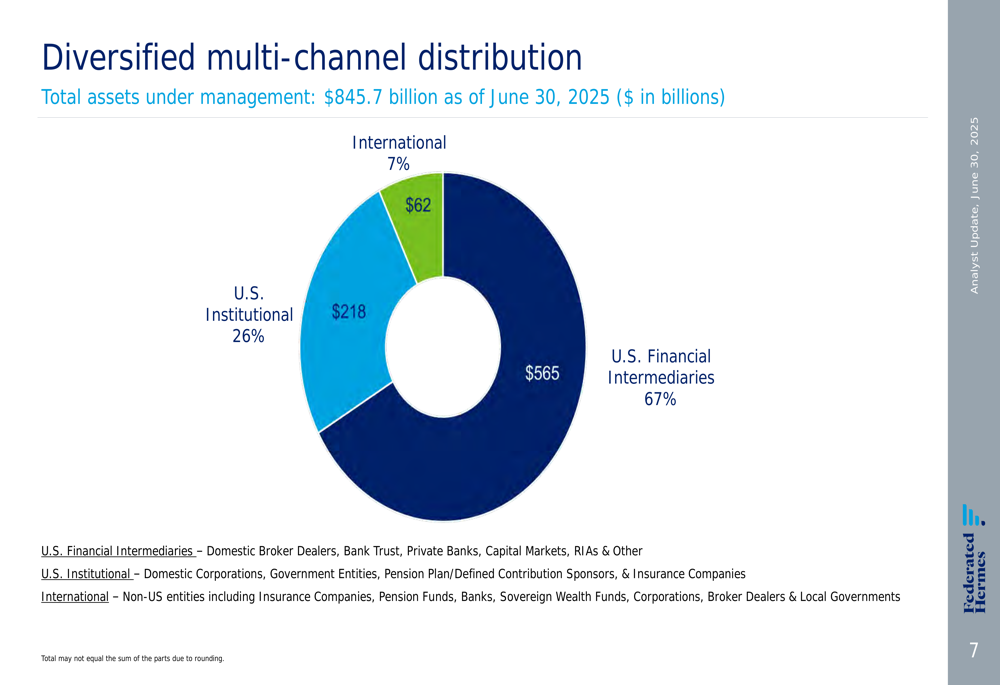
Federated Hermes distributes its products through multiple channels, with U.S. financial intermediaries representing the largest portion at 67% ($565 billion) of total AUM. U.S. institutional clients account for 26% ($218 billion), while international business represents 7% ($62 billion).
The distribution breakdown is illustrated in this chart:
Strategic Initiatives
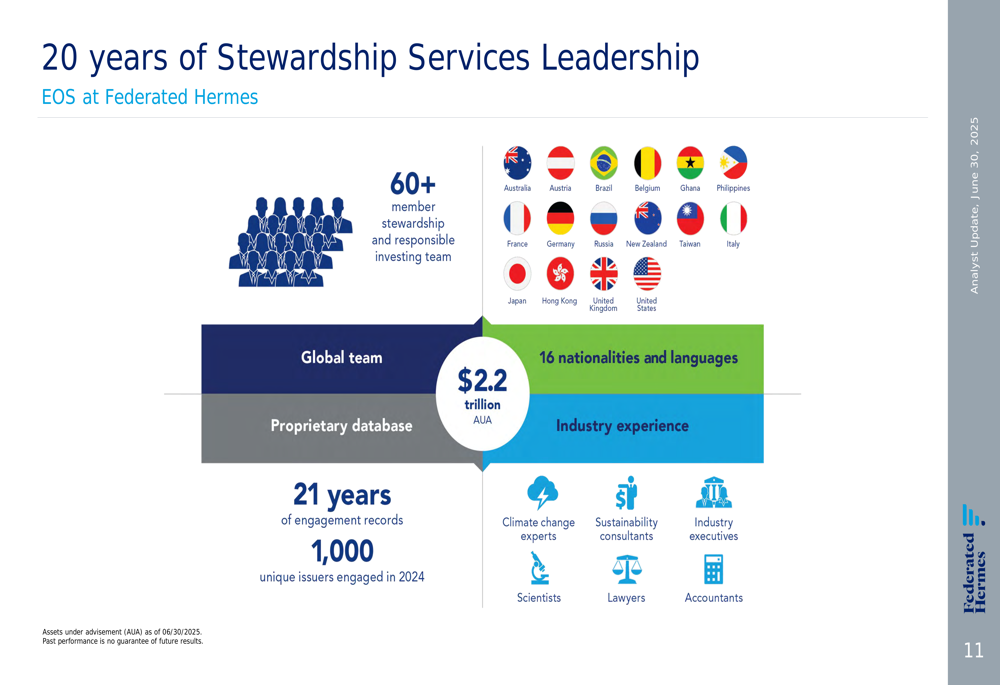
Federated Hermes continues to emphasize its stewardship services as a key differentiator in the market. The company’s EOS (Engagement Overlay Services) team has built a 20-year track record in responsible investing and engagement, with $2.2 trillion in assets under advice.
The following image highlights the company’s leadership in stewardship services:
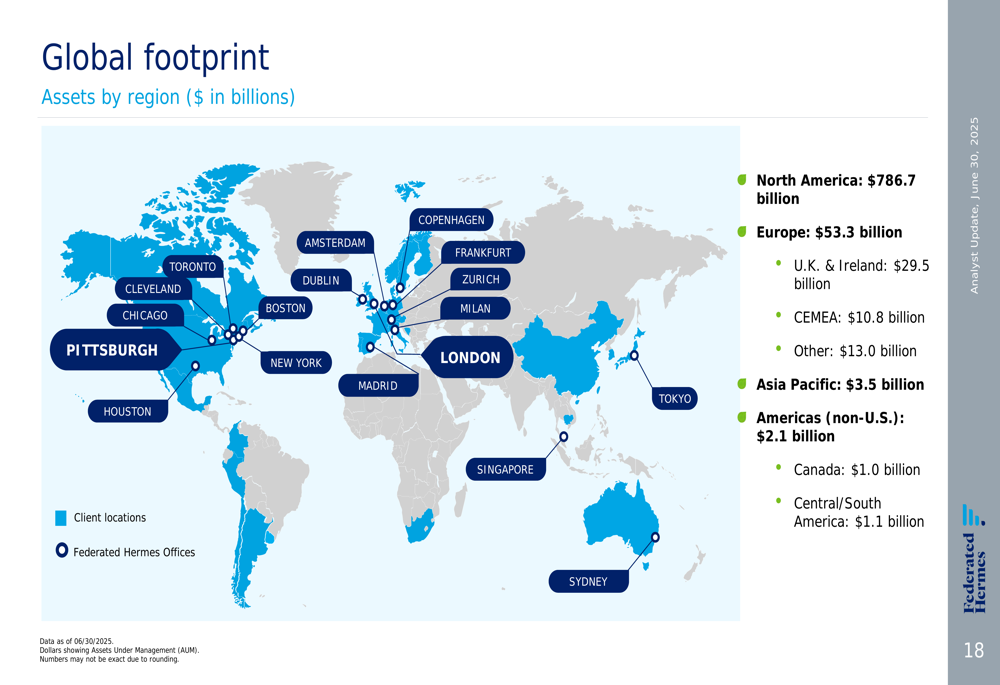
The company has also expanded its global footprint, though North America remains its dominant market with $786.7 billion in AUM. Europe represents $53.3 billion, Asia Pacific accounts for $3.5 billion, and non-U.S. Americas contribute $2.1 billion.
This global presence is illustrated in the following map:
Federated Hermes has maintained a strategy of complementing organic growth with strategic acquisitions and alliances. The company’s most recent transactions include the acquisition of C.W. Henderson in 2022 and Hermes GPE in 2023, expanding its capabilities in municipal securities and private equity, respectively.
Shareholder Value Creation
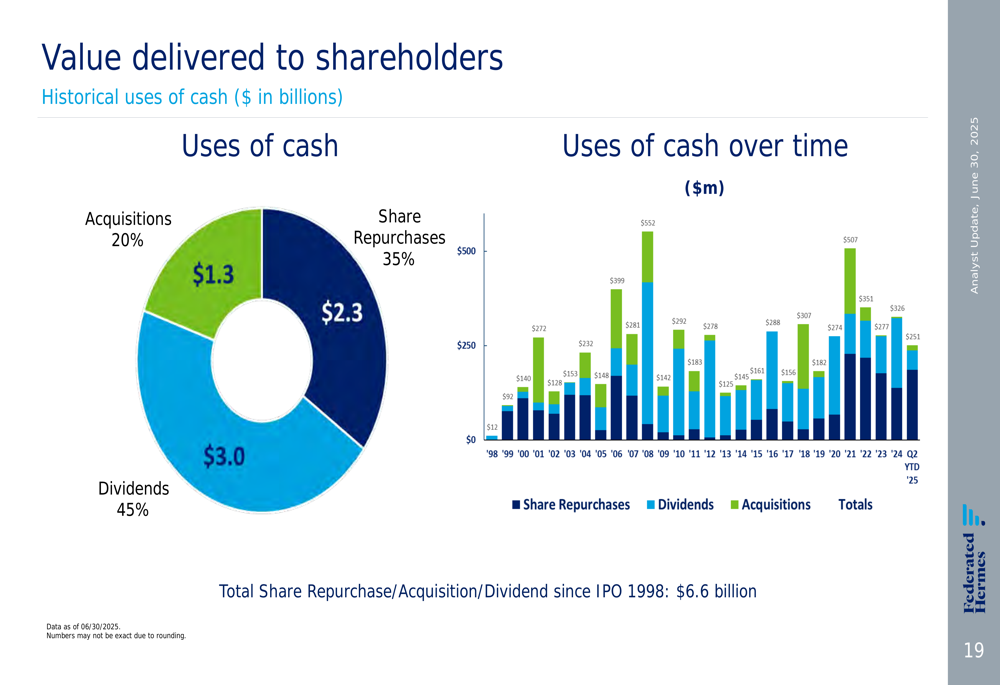
Since its IPO in 1998, Federated Hermes has consistently returned value to shareholders through dividends and share repurchases while also funding strategic acquisitions. Of the $6.6 billion in cash deployed, 45% ($3.0 billion) has gone to dividends, 35% ($2.3 billion) to share repurchases, and 20% ($1.3 billion) to acquisitions.
The company’s approach to shareholder value is illustrated in this chart:
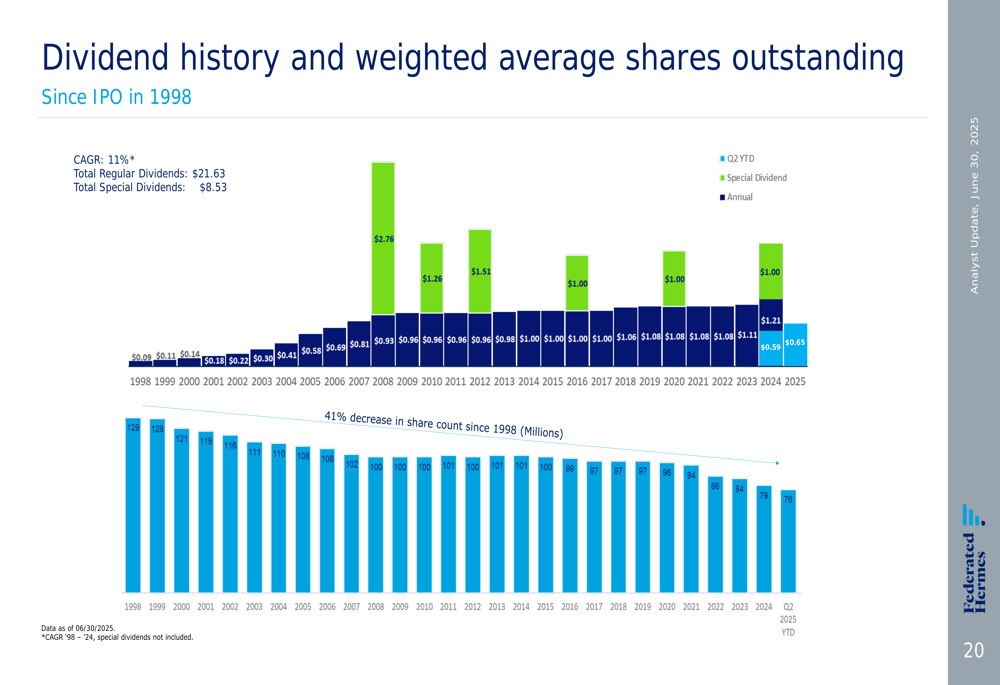
Federated Hermes has achieved an 11% compound annual growth rate in dividends since its IPO, with total regular dividends of $21.63 and special dividends of $8.53 per share. Simultaneously, the company has reduced its outstanding shares by 41% through its repurchase program.
The dividend history and share count reduction are shown in the following chart:
Forward-Looking Statements
Looking ahead, Federated Hermes highlighted several investment considerations that position the company for continued growth. These include its diverse asset class mix providing organic growth potential, its position as a pure-play asset management company with financial strength, and its world-class active management and engagement services.
The company’s liquidity business continues to provide stability, with a 9% CAGR since 1993, outpacing the broader money stock growth of 6% during the same period. This segment serves as a hedge during periods of market volatility.
Federated Hermes faces potential challenges from interest rate fluctuations, which could impact its money market business, and ongoing competitive pressures in the asset management industry. However, the company’s diversified business model and strong equity performance position it well to navigate these challenges.
The stock closed at $49.70 on July 31, 2025, near its 52-week high of $50.09, suggesting investor confidence in the company’s strategy and performance. In after-hours trading, the stock rose slightly to $49.99, indicating a positive reception to the Q2 results.
Full presentation:
This article was generated with the support of AI and reviewed by an editor. For more information see our T&C.