Can anything shut down the Gold rally?

Introduction & Market Context
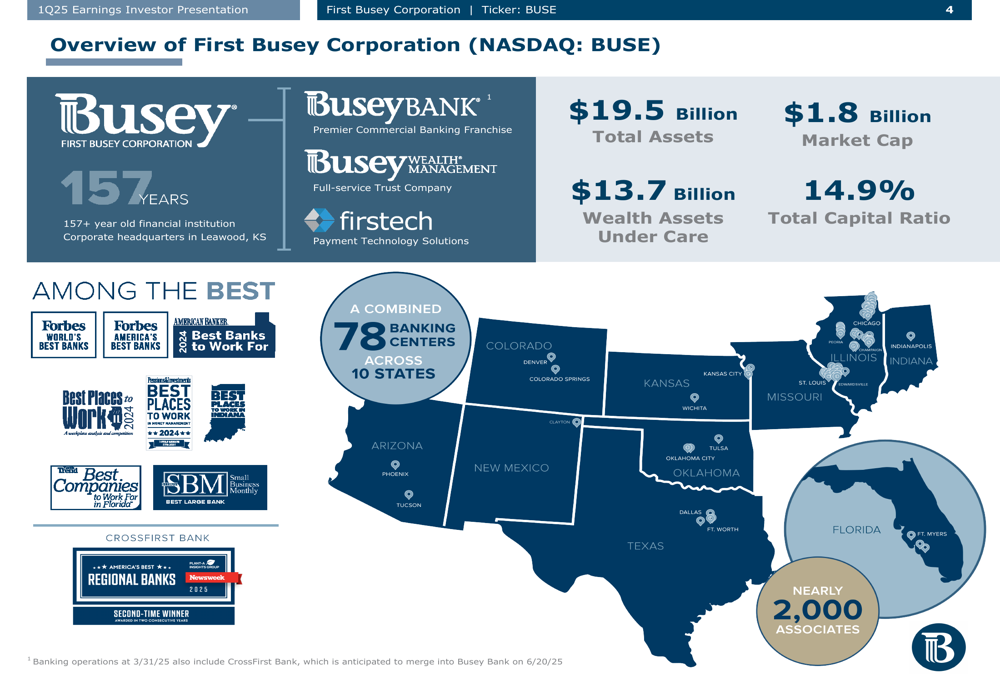
First Busey Corporation (NASDAQ:BUSE) presented its first quarter 2025 earnings results on April 22, 2025, highlighting the transformative acquisition of CrossFirst Bankshares (NASDAQ:CFB) that closed on March 1, 2025. The acquisition has significantly expanded the company’s asset base from $12.0 billion to $19.5 billion, establishing a presence in five of the top 25 MSAs in the United States across 10 states with 78 banking centers.
The stock closed at $19.89 on the day of the earnings release, with after-hours trading showing an increase to $20.58, suggesting a positive market reaction to the quarterly results and acquisition details. The company currently offers a dividend yield of 5.0% with a price-to-tangible book value ratio of 1.1x.
As shown in the following overview of the company’s expanded footprint and key statistics:
Quarterly Performance Highlights
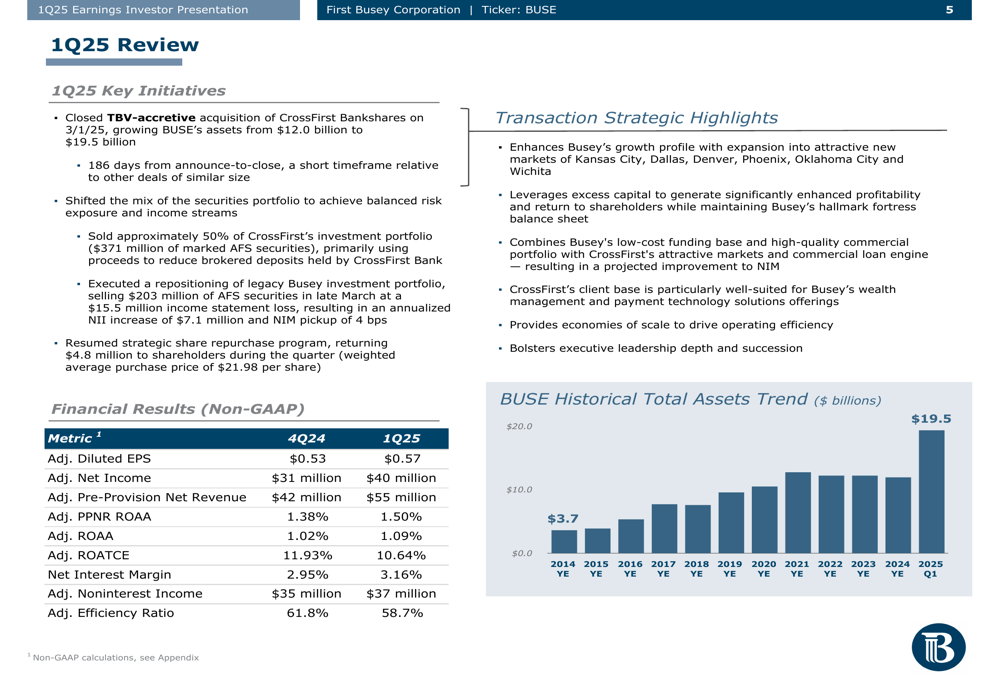
First Busey reported adjusted diluted earnings per share of $0.57 for Q1 2025, with adjusted net income of $40 million. The company achieved adjusted pre-provision net revenue (PPNR) of $55 million, representing an adjusted PPNR return on average assets (ROAA) of 1.50%. The adjusted return on average tangible common equity (ROATCE) was 10.64%, while the adjusted efficiency ratio improved to 58.7%.
The company’s net interest margin expanded to 3.16%, up from previous quarters, with management projecting further improvement to 3.40% in Q2 2025. This expansion reflects the impact of the CrossFirst acquisition and strategic balance sheet repositioning efforts.
The following slide illustrates the key financial metrics and strategic initiatives for the quarter:
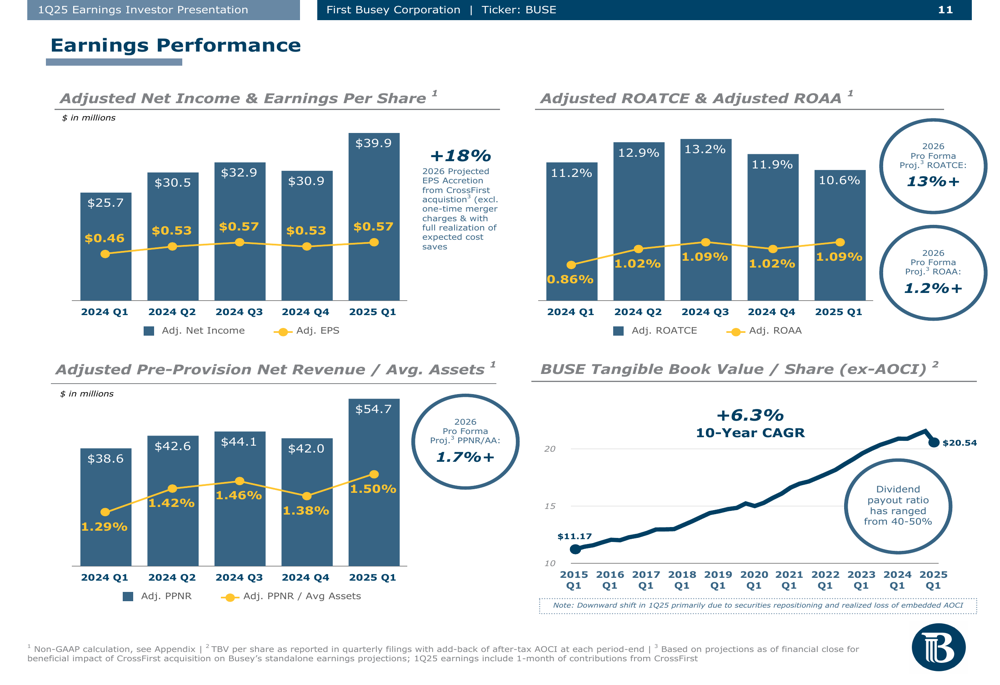
First Busey’s earnings performance has shown consistent improvement over recent quarters, with tangible book value per share demonstrating a 10-year CAGR of 6.3%. The company’s dividend payout ratio has remained in the 40-50% range, reflecting a commitment to returning capital to shareholders.
The earnings performance trends are visualized in this chart:
Strategic Initiatives
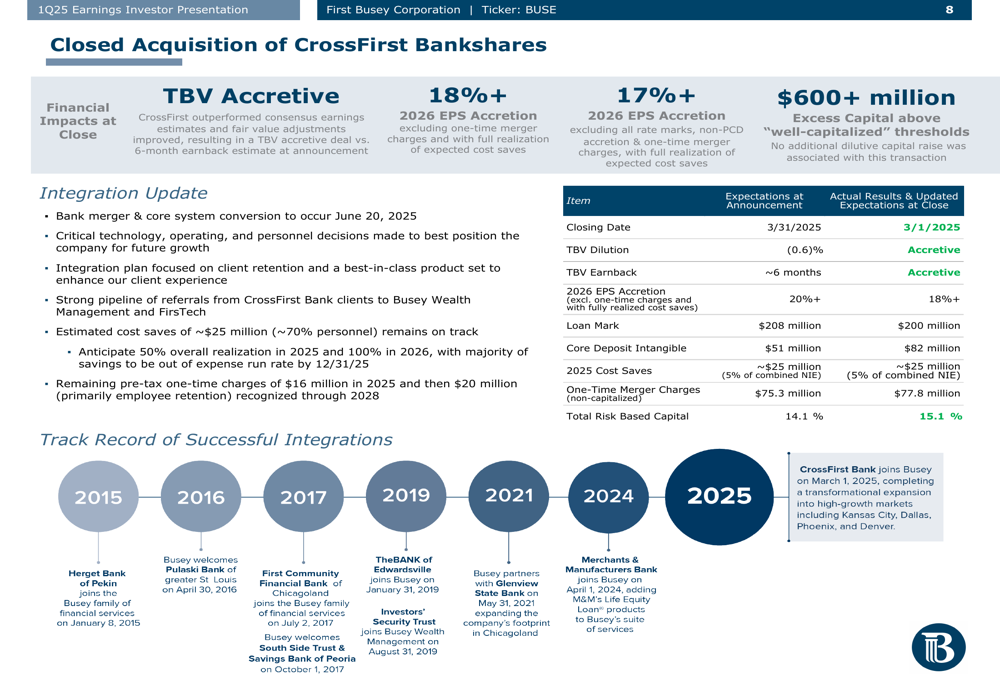
The acquisition of CrossFirst Bankshares represents the cornerstone of First Busey’s strategic initiatives for the quarter. The transaction was tangible book value accretive with a minimal dilution of 0.6% and an expected earnback period of approximately six months. Management projects 2026 EPS accretion of over 18%, excluding one-time merger charges.
The company recorded a loan mark of $208 million and a core deposit intangible of $51 million related to the acquisition. Cost savings from the transaction are expected to reach approximately $25 million in 2025, with one-time merger charges totaling $75.3 million.
The details of the CrossFirst acquisition and its expected benefits are outlined in this slide:
In addition to the acquisition, First Busey engaged in significant balance sheet repositioning during the quarter. The company sold $203 million of available-for-sale securities yielding approximately 1.7% and purchased new securities yielding about 5.2%, improving the net interest margin by approximately 4 basis points. Additionally, the company marked-to-market and liquidated approximately 50% of CrossFirst’s investment portfolio ($371 million) at the close of the acquisition.
First Busey also resumed its strategic share repurchase program, returning $4.8 million to shareholders during the quarter.
Detailed Financial Analysis
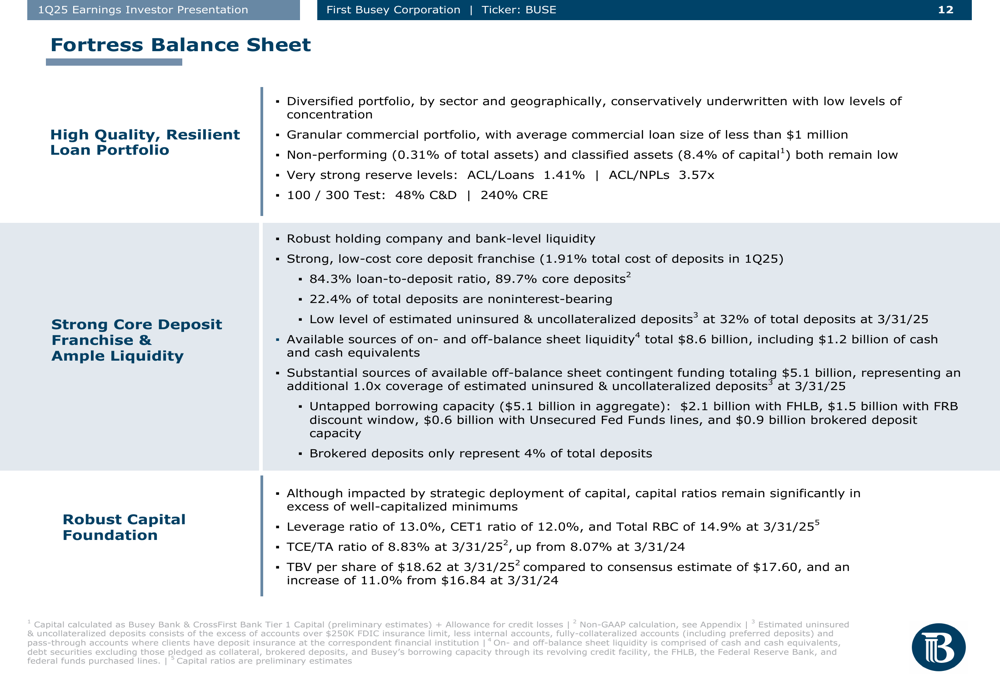
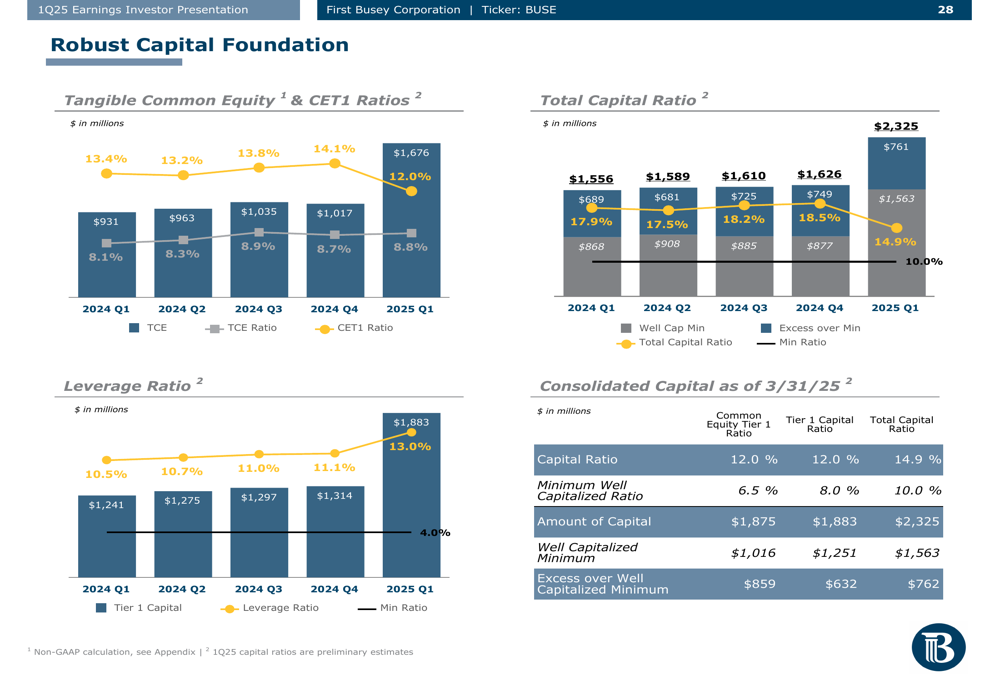
First Busey’s balance sheet demonstrates considerable strength, with a total capital ratio of 14.9% and a tangible common equity to tangible assets ratio of 8.83% as of March 31, 2025. The company maintains a diversified and conservatively underwritten loan portfolio with non-performing assets at just 0.31% of total assets.
The following slide highlights the key elements of the company’s balance sheet strength:
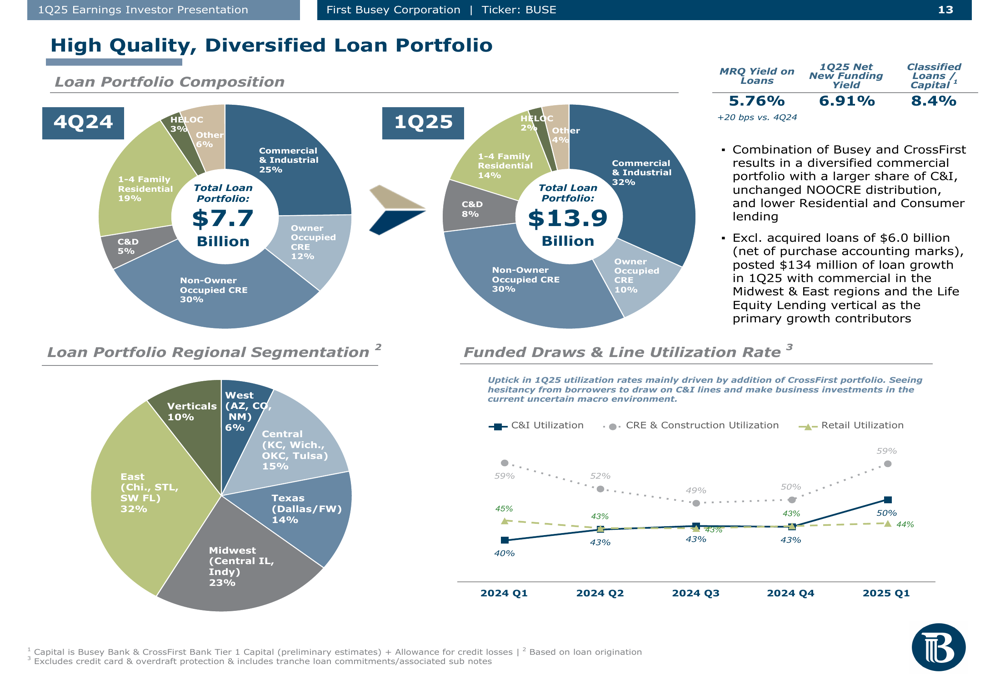
The loan portfolio is well-diversified across sectors and geographies, with Commercial & Industrial loans representing 32% of the total portfolio, followed by Non-Owner Occupied CRE at 30% and 1-4 Family Residential at 14%. CrossFirst Bank contributed 54% of the total C&I loan portfolio at the end of the quarter.
The loan portfolio composition and regional segmentation are illustrated here:
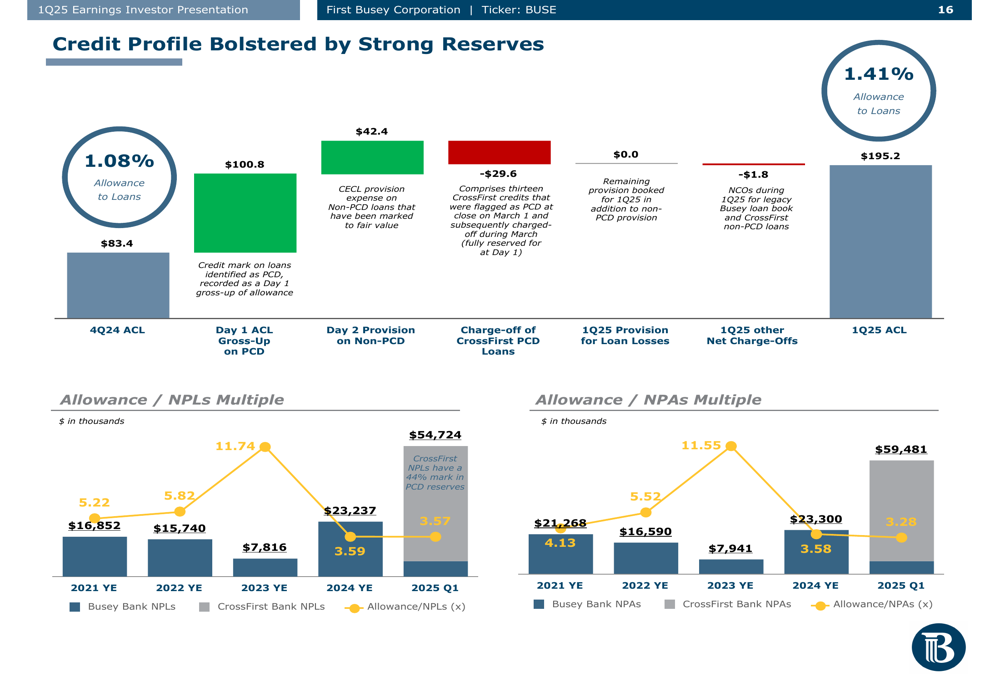
Credit quality remains strong, with an allowance for credit losses to loans ratio of 1.41%, up from 1.08% in the previous quarter. The allowance to non-performing loans multiple stands at 3.57x, reflecting robust reserve coverage.
The following slide demonstrates the company’s credit profile and reserve levels:
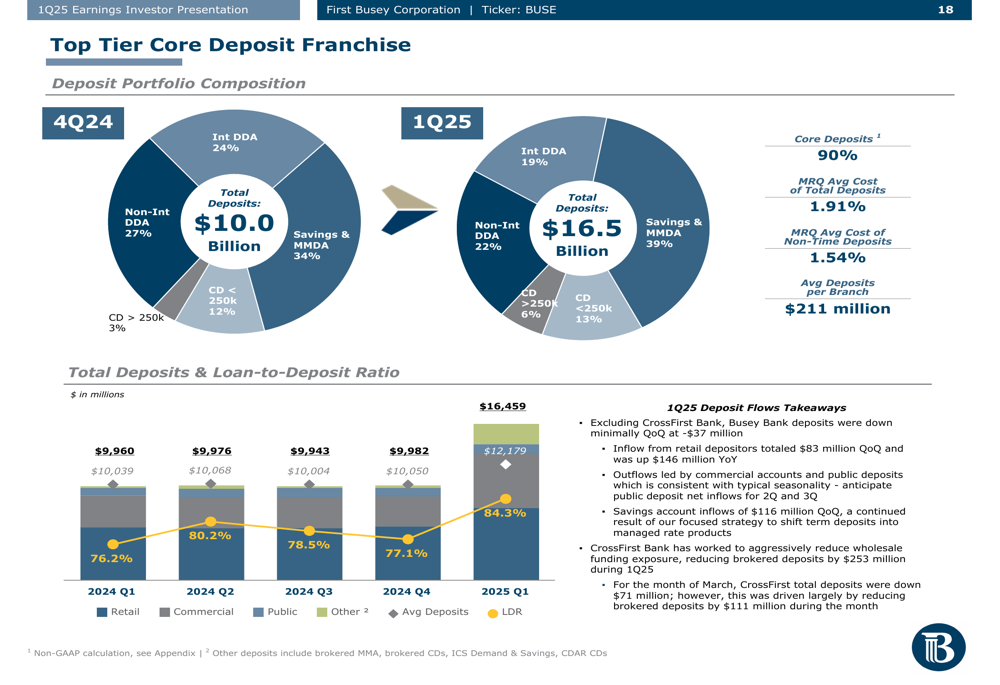
On the funding side, First Busey maintains a strong core deposit franchise with a loan-to-deposit ratio of 84.3%. Core deposits represent 89.7% of total deposits, with non-interest bearing deposits accounting for 22.4% of the total. The company reported a cost of deposits of 1.91% for the quarter, with non-time deposits at 1.54%.
The deposit composition and trends are shown in this slide:
Forward-Looking Statements
Looking ahead, First Busey expects to realize significant synergies from the CrossFirst acquisition, with cost savings of approximately $25 million projected for 2025. The company anticipates further net interest margin expansion to 3.40% in Q2 2025, driven by the strategic repositioning of the balance sheet and the full-quarter impact of the CrossFirst acquisition.
Management highlighted the company’s robust capital position, with $600+ million in excess capital above "well-capitalized" thresholds, providing flexibility for future growth opportunities and continued shareholder returns.
The company’s capital position and trends are illustrated in the following slide:
First Busey’s diversified business model, with significant contributions from wealth management ($13.7 billion in assets under care) and payment technology solutions (FirsTech processing $11 billion in payments annually), positions the company well for sustainable growth. Non-interest income represented 26.3% of operating revenue in Q1 2025, with wealth management fees and payment technology solutions income accounting for 63% of total non-interest income.
With a presence in high-growth markets and a regional operating model designed to capitalize on local expertise, First Busey appears well-positioned to leverage its expanded footprint and diversified revenue streams for continued growth in the coming quarters.
Full presentation:
This article was generated with the support of AI and reviewed by an editor. For more information see our T&C.