Gold prices edge lower; heading for weekly losses ahead of U.S.-Russia talks

Introduction & Market Context
First Hawaiian, Inc. (NASDAQ:FHB) reported first-quarter 2025 results that exceeded previous guidance, with earnings per share rising to $0.47 and net interest margin expanding to 3.08%. The bank’s shares reacted negatively in premarket trading, falling 5.5% to $22.01, despite the improved profitability metrics.
The bank’s performance reflects successful management of deposit costs in a challenging rate environment, with the cost of deposits declining 11 basis points to 1.43%. This improvement came despite continued contraction in both loan and deposit balances, highlighting the bank’s focus on profitability over growth.
Quarterly Performance Highlights
First Hawaiian reported net income of $59.2 million for Q1 2025, a 12.8% increase from $52.5 million in the previous quarter. Diluted earnings per share rose to $0.47, up from $0.41 in Q4 2024, representing a 14.6% improvement.
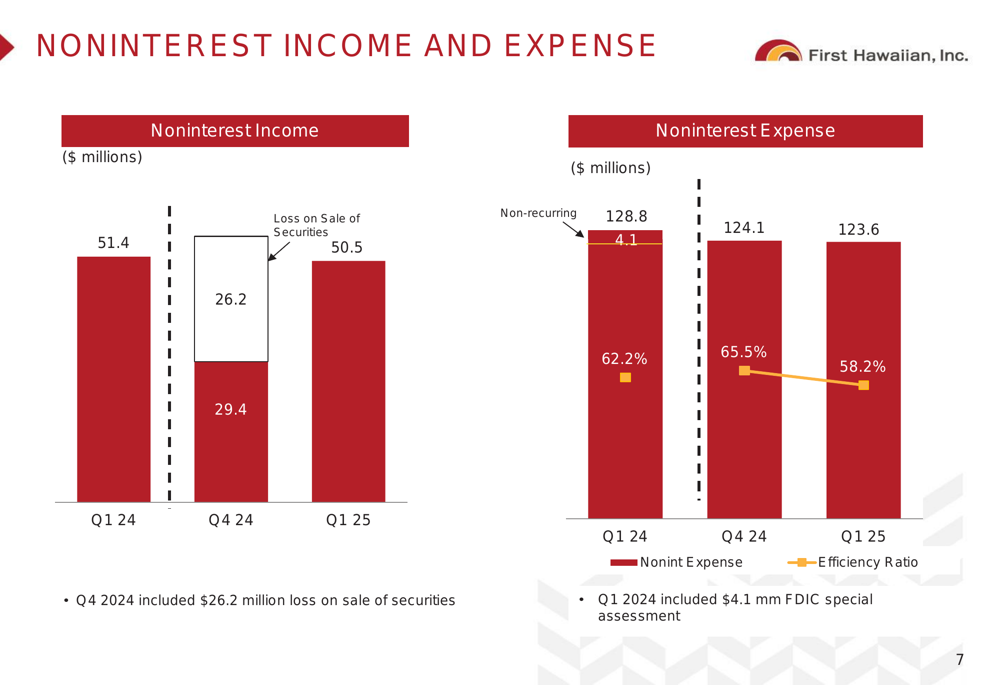
The bank’s efficiency ratio improved significantly to 58.2% from 65.5% in the previous quarter, while return on average assets (ROA) increased to 1.01% from 0.88%. Return on average equity (ROE) also improved to 9.09% from 7.94% in Q4 2024.
As shown in the following financial highlights chart:
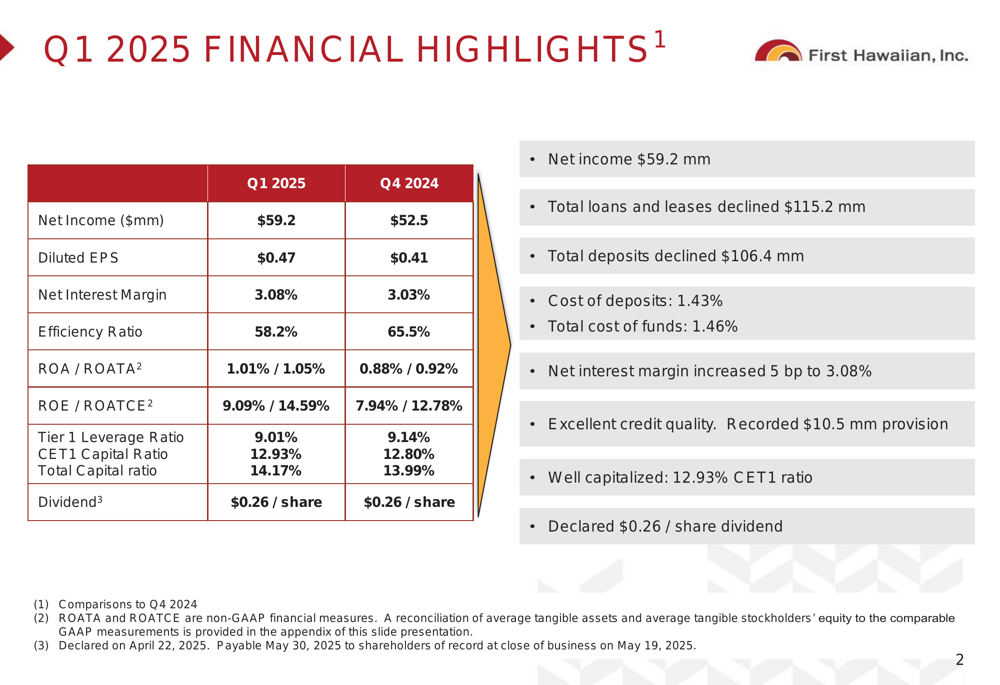
Net interest margin expanded by 5 basis points to 3.08%, slightly exceeding the 3.06% projection from the previous quarter’s guidance. This improvement in margin helped offset the impact of declining loan and deposit balances.
Balance Sheet and Portfolio Analysis
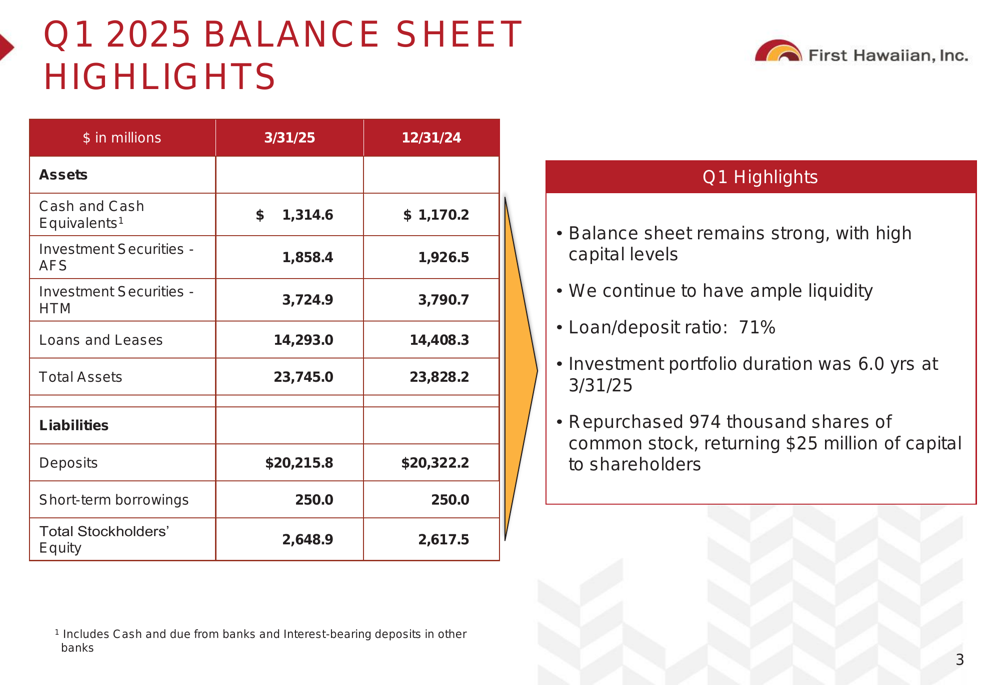
First Hawaiian’s balance sheet remained strong with total assets of $23.7 billion as of March 31, 2025. The bank maintained ample liquidity with a loan-to-deposit ratio of 71% and cash and cash equivalents of $1.3 billion.
The following balance sheet highlights show the key components:
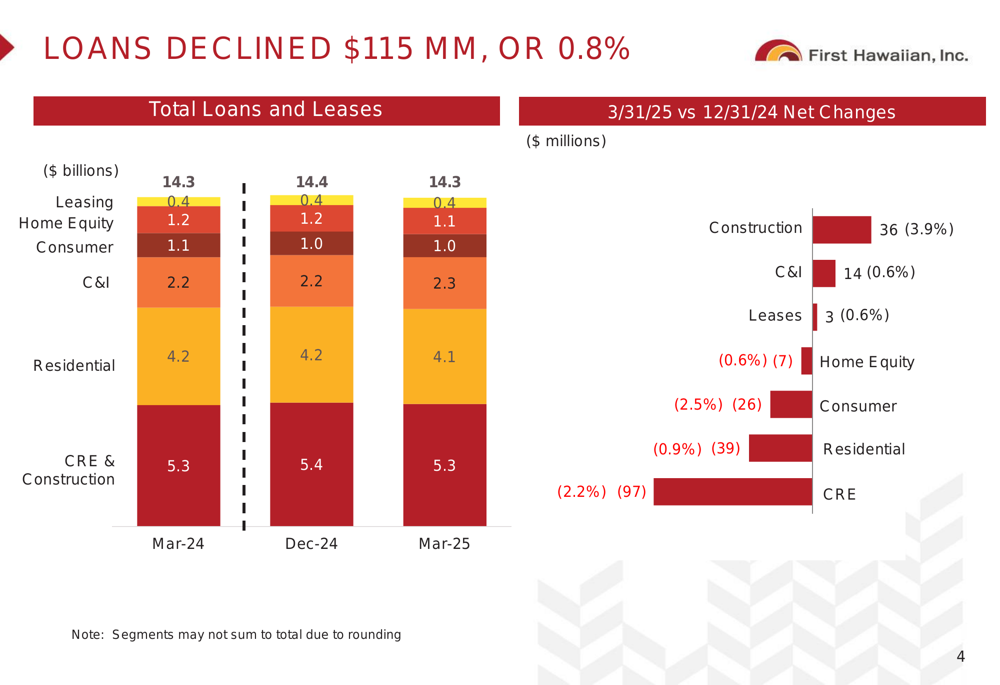
Total (EPA:TTEF) loans and leases declined by $115.2 million, or 0.8%, to $14.3 billion during the quarter. This decline was primarily driven by reductions in commercial real estate (-$97 million), residential mortgages (-$39 million), and consumer loans (-$26 million), partially offset by growth in construction loans (+$36 million) and commercial and industrial loans (+$14 million).
The loan portfolio breakdown is illustrated here:
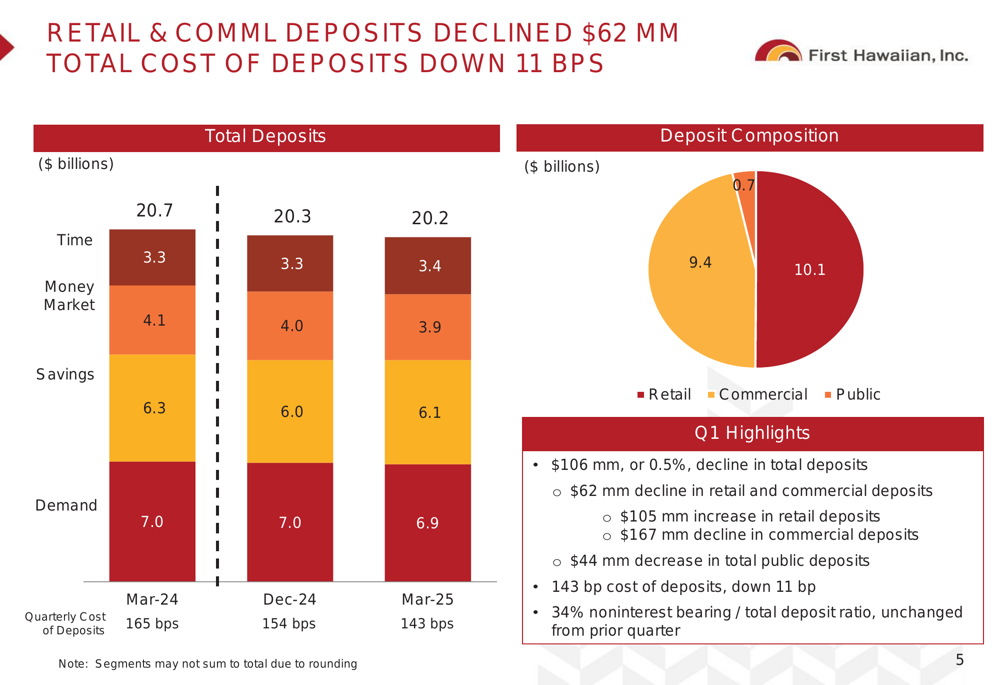
Total deposits decreased by $106.4 million to $20.2 billion, with commercial deposits declining by $167 million, partially offset by a $105 million increase in retail deposits. Public deposits decreased by $44 million. The bank maintained a stable noninterest-bearing deposit ratio of 34%.
The deposit trends and composition are shown in the following chart:
During the quarter, First Hawaiian repurchased 974,000 shares of common stock, returning $25 million of capital to shareholders. The bank also declared a quarterly dividend of $0.26 per share.
Asset Quality and Credit Metrics
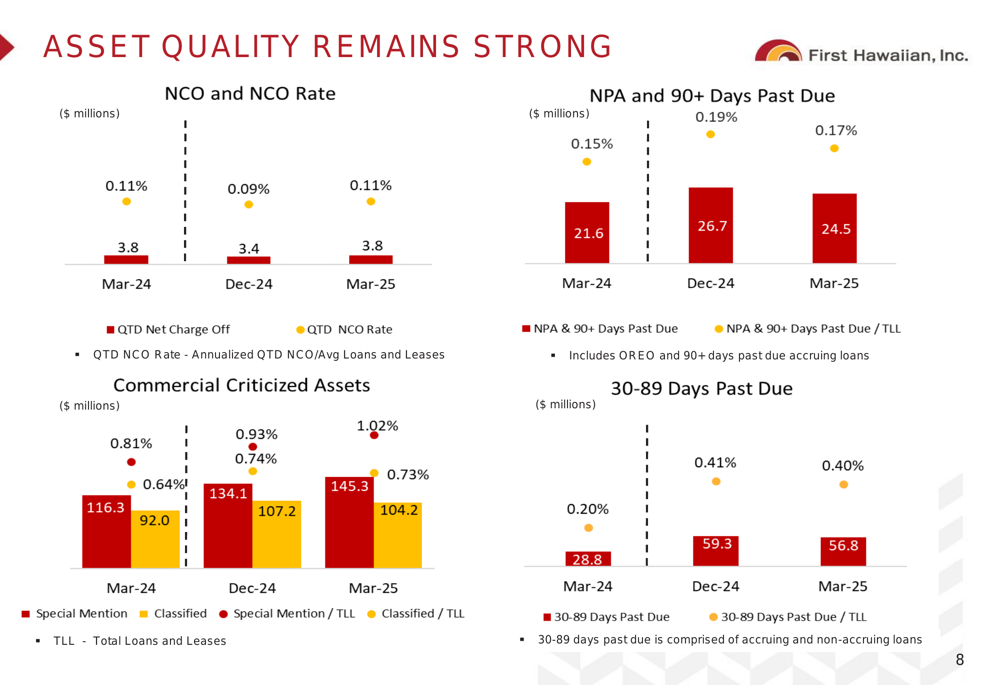
First Hawaiian’s asset quality remained strong, with net charge-offs at $3.8 million, representing 0.11% of total loans and leases, slightly up from 0.09% in the previous quarter. Non-performing assets and loans 90+ days past due totaled $24.5 million, or 0.17% of total loans and leases, down from 0.19% in Q4 2024.
The following chart illustrates the bank’s stable asset quality metrics:
The bank recorded a provision for credit losses of $10.5 million in Q1 2025, compared to a benefit of $0.8 million in the previous quarter. This increased the allowance for credit losses to 1.17% of total loans and leases, up from 1.11% at the end of 2024.
The allowance for credit losses by loan category is detailed here:
Commercial real estate exposure decreased by $96.6 million during the quarter, with the portfolio maintaining a weighted average loan-to-value ratio of 58.2%. The multi-family segment showed the highest criticized rate at 11.7%, though it represents only 19.4% of the total CRE portfolio.
Forward-Looking Statements
First Hawaiian’s Q1 2025 results demonstrate improved profitability despite balance sheet contraction, suggesting a strategic focus on margin expansion and expense management rather than growth. The bank’s continued share repurchases and stable dividend indicate confidence in its capital position and future earnings potential.
The bank’s net interest margin expansion exceeded previous guidance, and the declining cost of deposits suggests effective management of interest expenses. However, the continued decline in loan and deposit balances contrasts with the previous quarter’s guidance, which had projected low to mid-single-digit loan growth for 2025.
Looking ahead, First Hawaiian appears well-positioned to navigate the current interest rate environment with its strong capital ratios, ample liquidity, and disciplined approach to credit risk management. The bank’s ability to improve profitability metrics while maintaining strong asset quality suggests a sustainable earnings trajectory, though investors will likely focus on the bank’s ability to return to balance sheet growth in future quarters.
Full presentation:
This article was generated with the support of AI and reviewed by an editor. For more information see our T&C.