AlphaTON stock soars 200% after pioneering digital asset oncology initiative

Introduction & Market Context
First Hawaiian, Inc. (NASDAQ:FHB) released its second quarter 2025 earnings presentation on July 25, 2025, revealing a significant improvement in profitability metrics compared to the previous quarter. The bank’s stock, which closed at $25.20 before the announcement, rose 2.14% to $25.74 in after-hours trading, indicating positive investor reception of the results.
The Hawaii-based financial institution reported quarterly earnings that continued the positive momentum seen in Q1, with notable improvements in net interest margin and efficiency ratio, despite a challenging interest rate environment and mixed economic signals in its core markets.
Quarterly Performance Highlights
First Hawaiian reported net income of $73.2 million for Q2 2025, a substantial 23.6% increase from $59.2 million in the previous quarter. Diluted earnings per share rose to $0.58, up 23.4% from $0.47 in Q1 2025 and 20.8% from $0.48 in the year-ago quarter.
As shown in the following financial highlights table, the bank demonstrated improvements across key performance metrics:
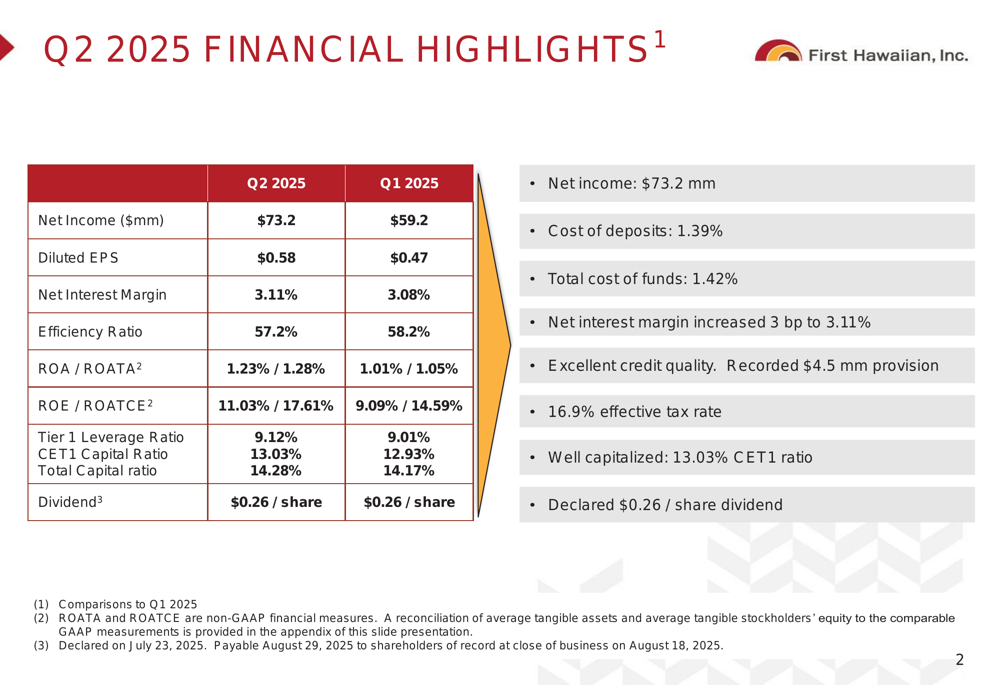
The bank’s efficiency ratio improved to 57.2% from 58.2% in the previous quarter, while return on average assets (ROA) increased to 1.23% from 1.01%. Return on average equity (ROE) also showed significant improvement, rising to 11.03% from 9.09% in Q1.
The effective tax rate for the quarter was 16.9%, substantially lower than the 23% annual rate projected during the Q1 earnings call, which contributed to the stronger bottom-line performance.
Detailed Financial Analysis
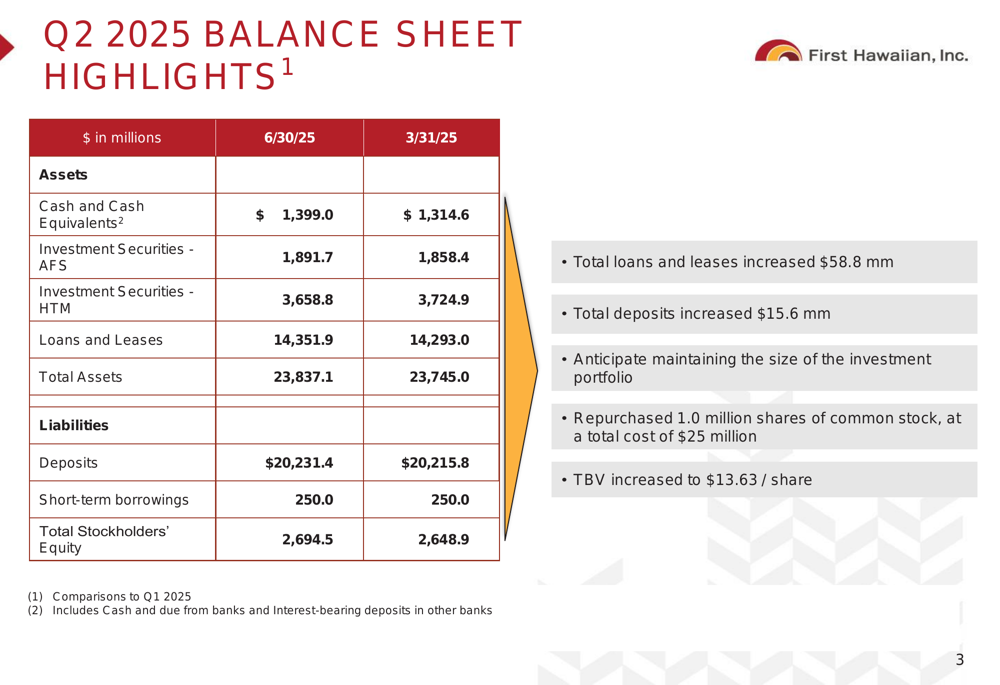
First Hawaiian’s balance sheet showed modest growth during the quarter, with total assets increasing to $23.84 billion as of June 30, 2025, up from $23.75 billion at the end of March. The bank’s loan portfolio grew by $58.8 million to $14.35 billion, while deposits increased slightly by $15.6 million to $20.23 billion.
The following balance sheet highlights illustrate the quarter-over-quarter changes:
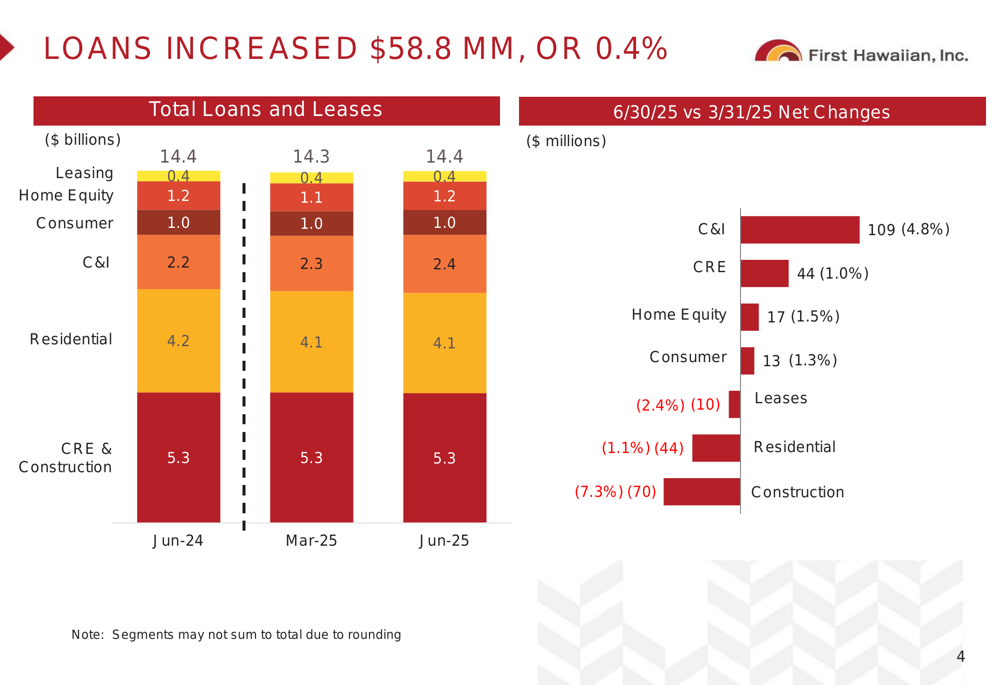
The loan portfolio composition showed mixed performance across categories. Commercial and industrial (C&I) loans increased by $109 million or 4.8%, while construction loans decreased by $70 million or 7.3%. The bank’s residential mortgage portfolio also contracted slightly by $44 million or 1.1%.
The following chart provides a detailed breakdown of the loan portfolio growth and composition:
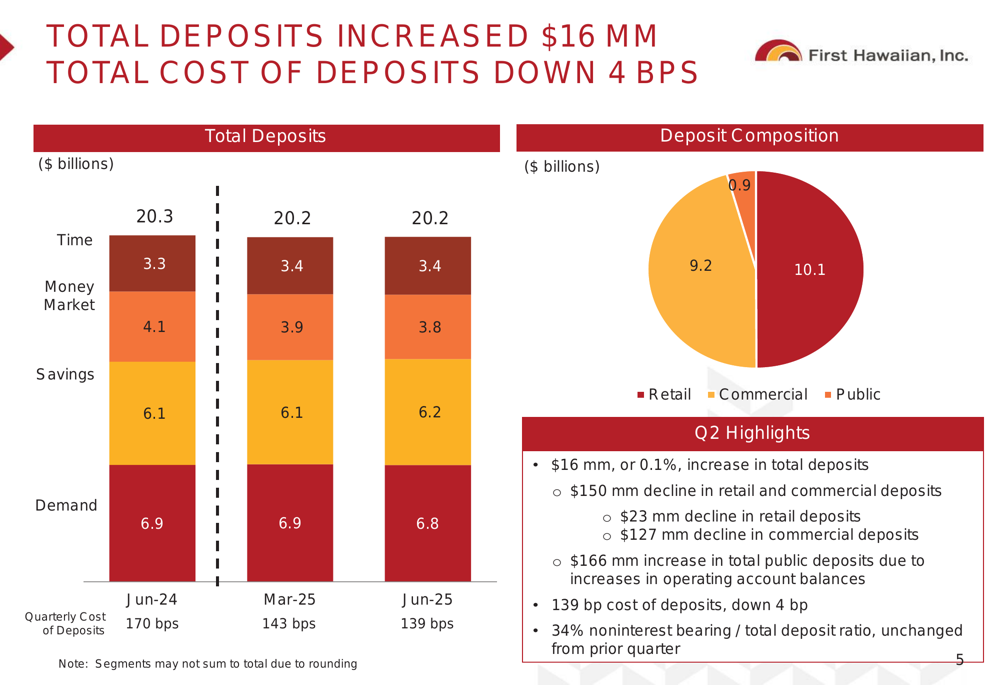
On the deposit side, First Hawaiian maintained a stable base with minimal overall change. The bank reported a $150 million decline in retail and commercial deposits, offset by a $166 million increase in public deposits. The cost of deposits decreased by 4 basis points to 139 basis points, while the noninterest-bearing deposit ratio remained unchanged at 34%.
The deposit trends and composition are illustrated in the following chart:
Net interest income increased to $163.6 million in Q2 2025, up from $160.5 million in the previous quarter. The net interest margin improved by 3 basis points to 3.11%, primarily driven by lower deposit costs. The cost of funds decreased by 4 basis points to 1.42%.
The following chart shows the net interest income and margin trends:
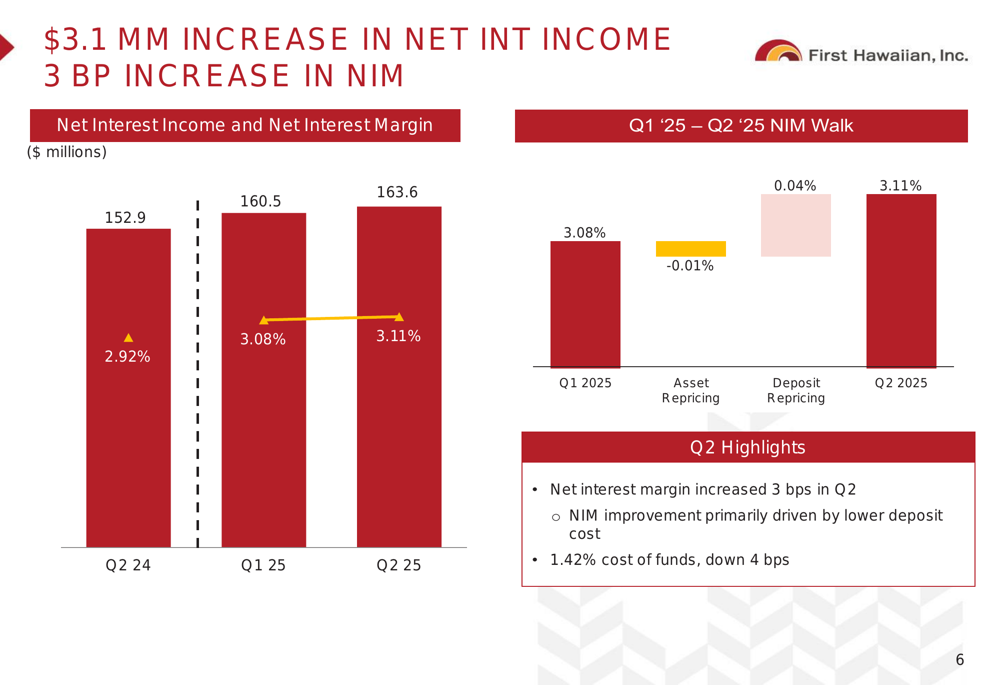
Noninterest income rose to $54.0 million from $50.5 million in Q1 2025, while noninterest expenses increased slightly to $124.9 million from $123.6 million. Despite the increase in expenses, the improved revenue helped drive the efficiency ratio down to 57.2%.
Asset Quality and Risk Management
First Hawaiian’s credit metrics showed some mixed signals during the quarter. The provision for credit losses decreased significantly to $4.5 million from $10.5 million in Q1 2025, reflecting improved overall credit outlook. Net charge-offs decreased to $3.3 million (0.09% of average loans and leases) from $3.8 million (0.11%) in the previous quarter.
However, nonperforming assets and loans 90+ days past due increased to $33.0 million (0.23% of total loans and leases) from $24.5 million (0.17%) in Q1. Commercial criticized assets also rose to $171.1 million (1.19% of total loans) from $145.3 million (1.02%).
The allowance for credit losses remained stable at 1.17% of total loans and leases, unchanged from the previous quarter. The following table provides a detailed breakdown of the allowance for credit losses by loan category:
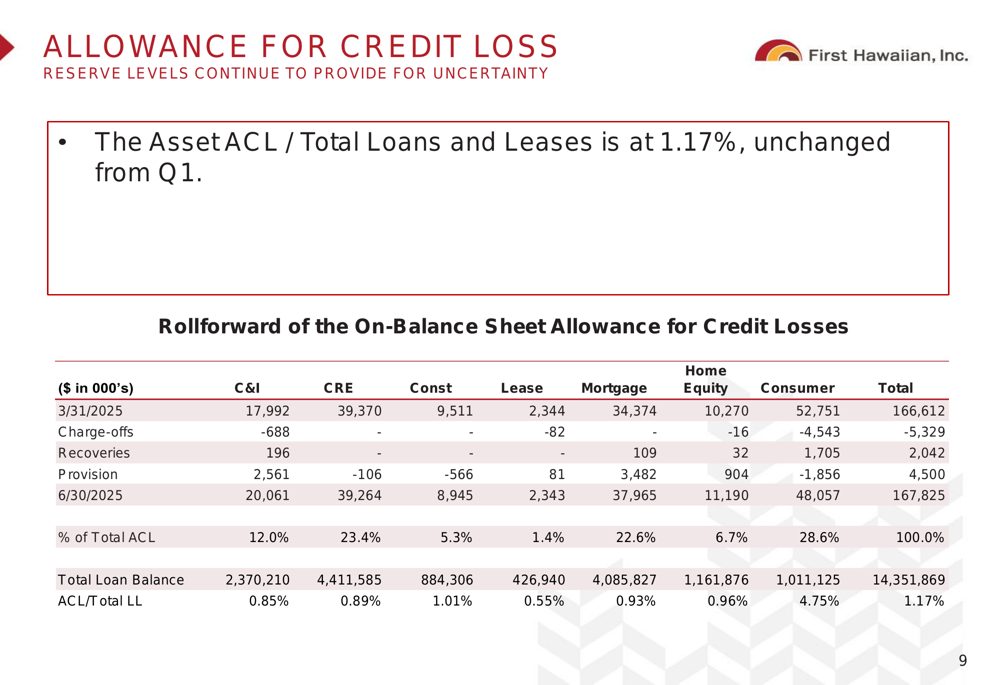
The commercial real estate portfolio, which accounts for $4.41 billion or 30.7% of total loans, showed a weighted average loan-to-value ratio of 58.4%. Multi-family loans had the highest criticized percentage at 14.1%, while the overall criticized percentage for the CRE portfolio was 4.4%.
Capital Management and Outlook
First Hawaiian maintained strong capital ratios, with the CET1 capital ratio improving to 13.03% from 12.93% in the previous quarter. The total capital ratio also increased to 14.28% from 14.17%.
The bank continued its share repurchase program, buying back 1.0 million shares during the quarter. Tangible book value per share increased to $13.63 from $13.15 in Q1 2025, representing a 3.7% quarterly growth.
First Hawaiian maintained its quarterly dividend at $0.26 per share, unchanged from the previous quarter. The dividend, combined with the share repurchase program, underscores management’s confidence in the bank’s financial position and future prospects.
While the presentation did not provide specific forward guidance, the improved profitability metrics and stable capital position suggest that First Hawaiian is well-positioned to navigate the current economic environment. The bank’s effective management of deposit costs and credit quality will be key factors to watch in the coming quarters, particularly as criticized assets have shown a slight upward trend.
The Q2 2025 results demonstrate continued improvement from the positive trend noted in Q1, with the significant increase in profitability metrics likely to be well-received by investors, as evidenced by the positive after-hours stock movement.
Full presentation:
This article was generated with the support of AI and reviewed by an editor. For more information see our T&C.