S&P 500 slips, but losses kept in check as Nvidia climbs ahead of results

Introduction & Market Context
Fulton Financial Corporation (NASDAQ:FULT) released its second quarter 2025 earnings presentation on July 16, 2025, revealing record operating net income and improved profitability metrics. The regional bank, which closed at $19.02 on July 15, down 2.81% for the day, continues to demonstrate resilience in a challenging interest rate environment.
The presentation highlights Fulton’s focus on disciplined growth, organizational efficiency, and maintaining a strong balance sheet position. These results come as regional banks navigate ongoing concerns about deposit stability and asset quality in a high interest rate environment.
Quarterly Performance Highlights
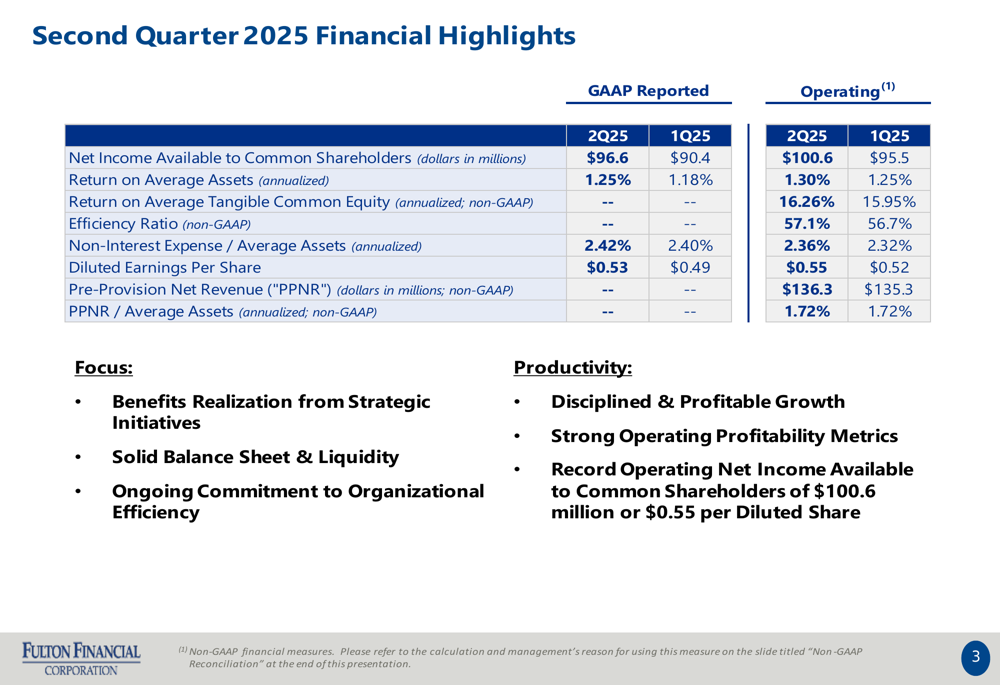
Fulton Financial reported record operating net income available to common shareholders of $100.6 million or $0.55 per diluted share in Q2 2025, up from $95.5 million or $0.52 per share in Q1 2025. On a GAAP basis, net income available to common shareholders reached $96.6 million ($0.53 per share), compared to $90.4 million ($0.49 per share) in the previous quarter.
The company’s return on average assets (ROAA) improved to 1.25% from 1.18% quarter-over-quarter on a GAAP basis, while operating ROAA increased to 1.30% from 1.25%. Return on average tangible common equity also strengthened to 16.26% from 15.95% in the first quarter.
As shown in the following financial highlights chart, Fulton demonstrated improvement across multiple key metrics:
Detailed Financial Analysis
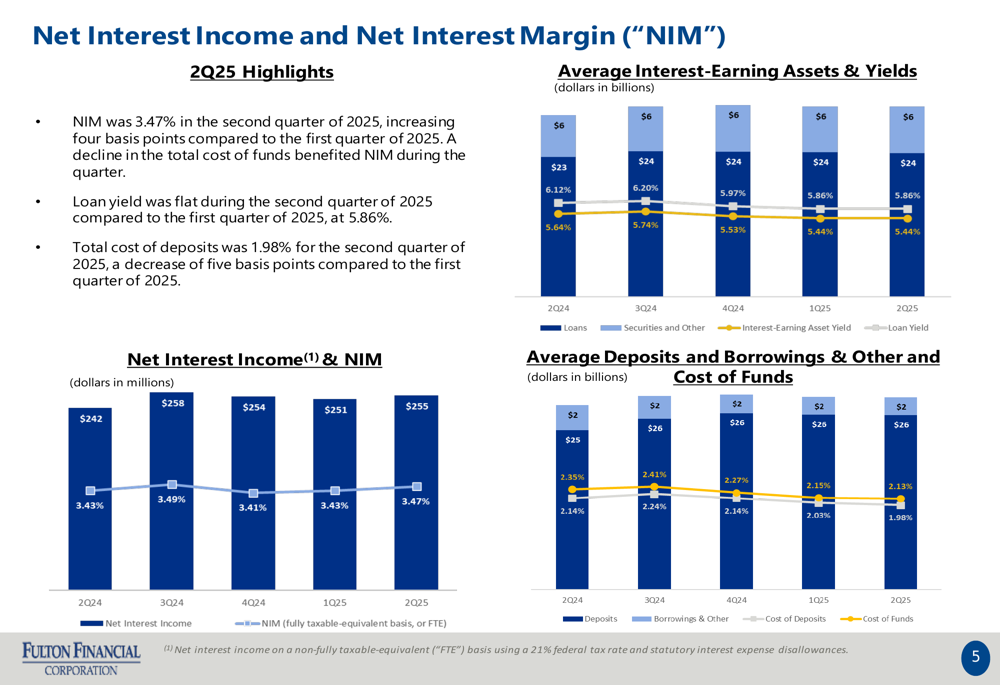
Net interest income increased to $254.9 million in Q2 2025 from $251.2 million in Q1 2025. The company maintained a net interest margin of 3.47%, supported by stable loan yields of 5.86% and a total cost of deposits of 1.98%.
The following chart illustrates the trends in net interest income and margin:
Non-interest income grew to $69.1 million, up $1.9 million from the previous quarter. This increase was primarily driven by higher commercial banking income from merchant and card fees, cash management, and capital markets revenue. Consumer revenue and wealth management also showed strong performance.
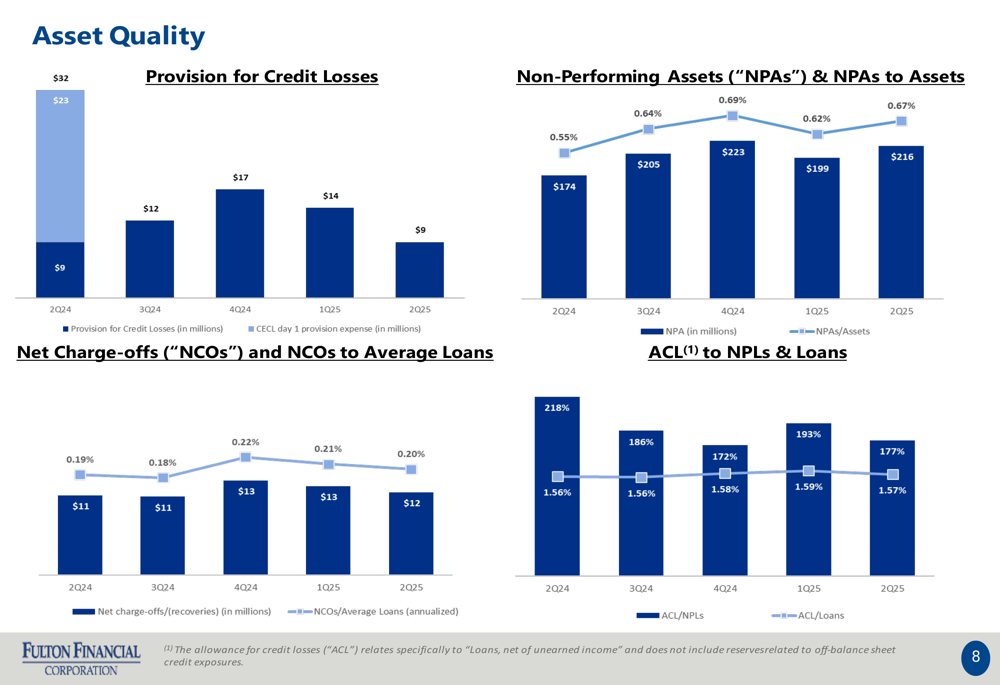
Provision for credit losses decreased significantly to $8.6 million from $13.9 million in Q1 2025, reflecting improved credit conditions. Net charge-offs remained stable at $12 million (0.20% of average loans), while non-performing assets increased slightly to $216 million (0.67% of assets).
The following asset quality metrics demonstrate Fulton’s prudent risk management approach:
Balance Sheet Strength and Risk Management
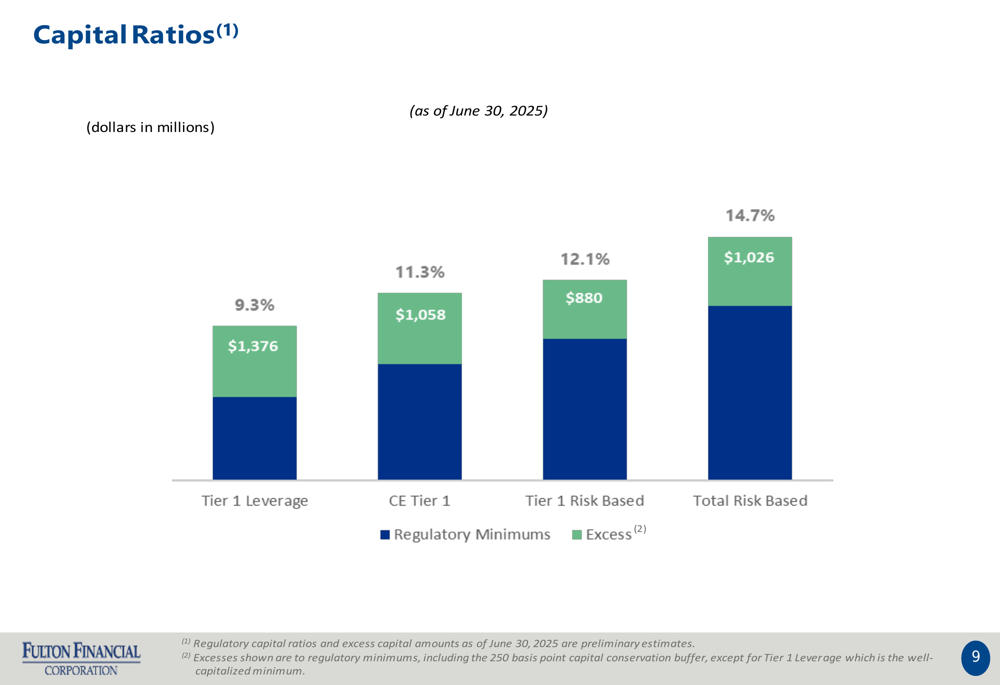
Fulton Financial maintains a strong capital position, with all regulatory ratios well above minimum requirements. The company reported a Tier 1 leverage ratio of 9.3%, Common Equity Tier 1 ratio of 11.3%, and a total risk-based capital ratio of 14.7%.
The following chart illustrates Fulton’s capital strength and excess capital position:
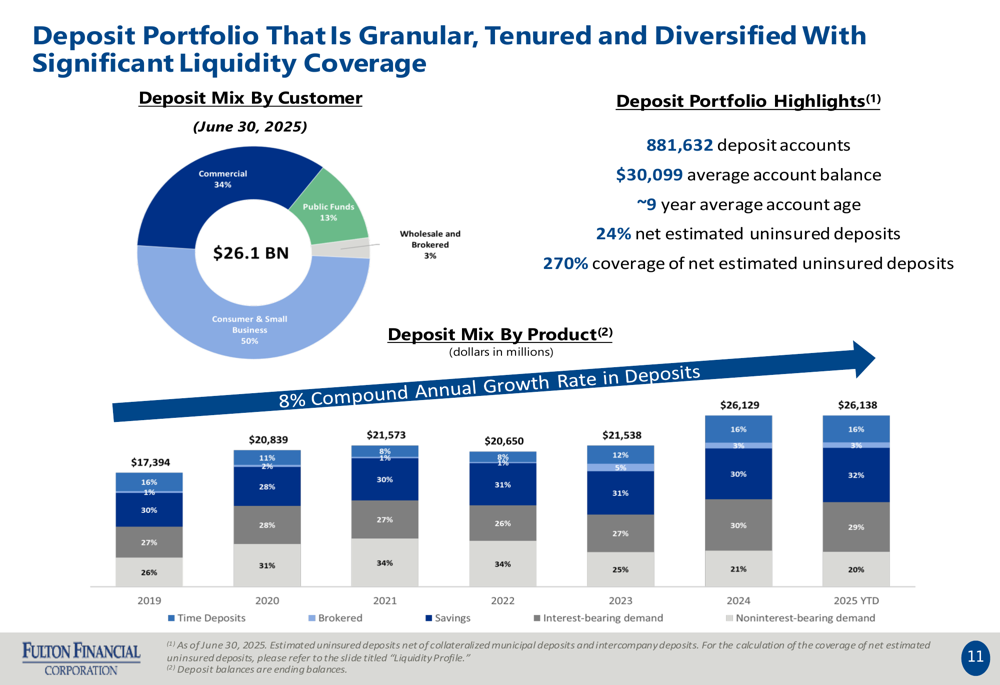
The bank’s deposit base remains stable with 881,632 accounts averaging approximately 9 years in age. Consumer and small business deposits represent 50% of the total deposit mix, followed by commercial (34%), public funds (13%), and wholesale/brokered deposits (3%). Only 24% of deposits are estimated to be uninsured, with 270% coverage of these uninsured deposits through available liquidity.
The deposit portfolio composition is illustrated in the following chart:
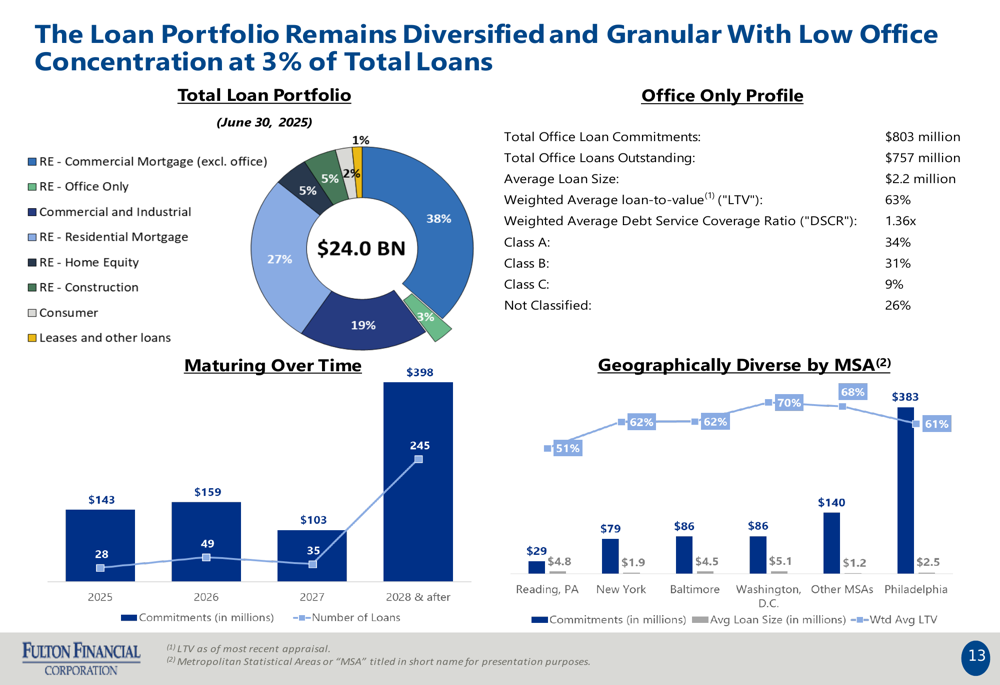
Fulton’s $24 billion loan portfolio is well-diversified across various sectors, with commercial and industrial loans comprising 38%, residential mortgages 27%, and consumer loans 19%. The company has limited exposure to higher-risk commercial real estate segments, with office loans representing just 5% of the total portfolio.
The loan portfolio diversification is shown in the following chart:
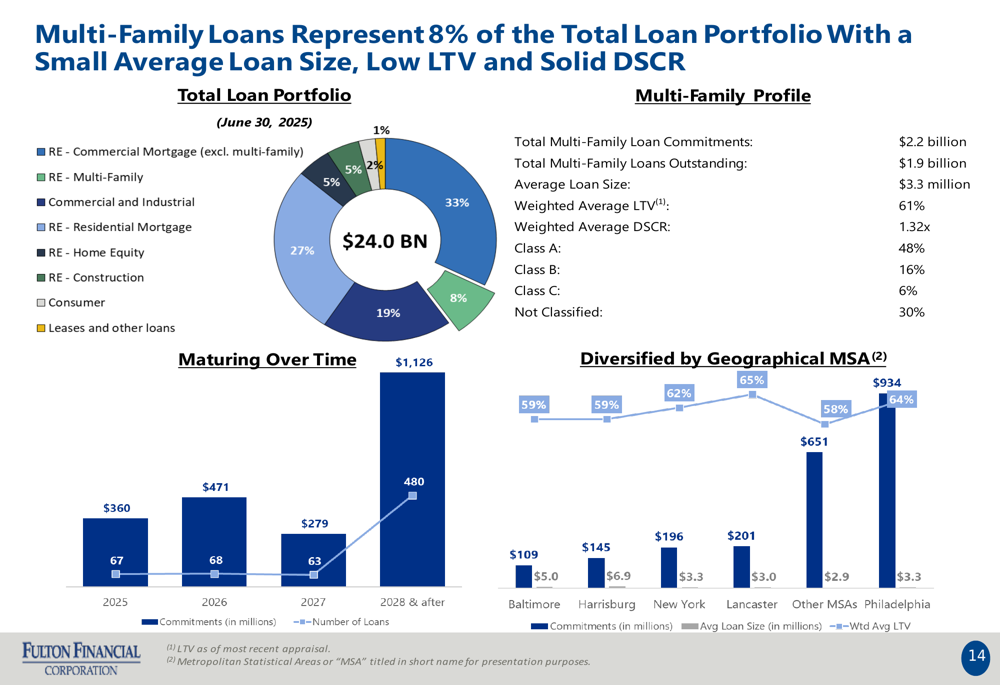
The bank has carefully managed its exposure to multi-family loans, which represent 8% of the total loan portfolio. Total (EPA:TTEF) multi-family loan commitments stand at $2.2 billion with $1.9 billion outstanding, as illustrated below:
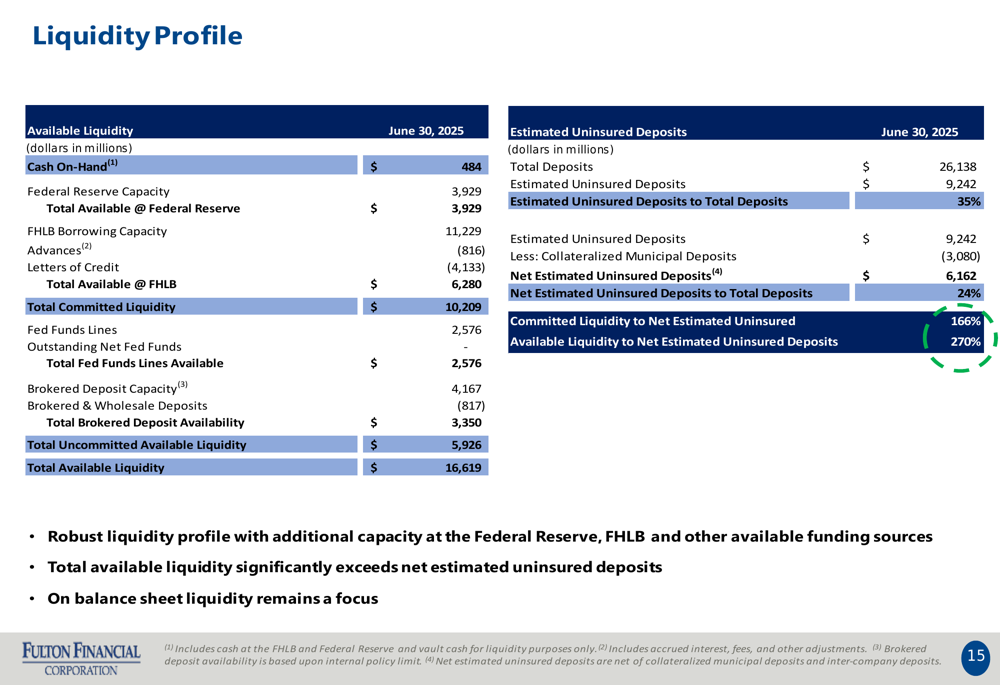
Fulton’s liquidity profile remains robust with $16.6 billion in total available liquidity, providing a 270% coverage ratio for net estimated uninsured deposits. This strong liquidity position offers significant protection against potential deposit outflows.
The detailed liquidity profile is shown here:
Forward-Looking Statements
For the full year 2025, Fulton Financial provided operating guidance including:
- Net interest income of $1.005-1.025 billion
- Provision for credit losses of $50-70 million
- Non-interest income of $265-280 million
- Operating non-interest expense of $750-765 million
- Effective tax rate of 18.5-19.5%
The company continues to focus on benefits realization from strategic initiatives, maintaining a solid balance sheet with ample liquidity, and driving organizational efficiency. Management emphasized its commitment to disciplined and profitable growth while maintaining strong operating profitability metrics.
Fulton’s balance sheet flexibility is positioned to benefit from the current interest rate environment, particularly as higher-rate time deposits mature and reprice at potentially lower rates in coming quarters. This could provide a gradual tailwind for net interest margin in late 2025 and early 2026.
With strong capital ratios, a diversified loan portfolio, and a stable deposit base, Fulton Financial appears well-positioned to navigate the current banking environment while pursuing strategic growth opportunities.
Full presentation:
This article was generated with the support of AI and reviewed by an editor. For more information see our T&C.