NextEra Energy stock rises after Google power deal report

Introduction & Market Context
Fulton Financial Corporation (NASDAQ:FULT) released its third-quarter 2025 results on October 22, reporting earnings that exceeded analyst expectations despite a challenging interest rate environment. The regional bank, with $32 billion in assets, delivered GAAP earnings per share of $0.53, surpassing the forecasted $0.49, while revenue reached $334.61 million against anticipated $332.35 million.
Despite the positive results, Fulton’s stock experienced a slight decline of 1.57% in regular trading, closing at $17.88, and fell an additional 1.06% in pre-market trading. The stock remains well below its 52-week high of $22.49, suggesting investors may be taking a cautious approach despite the company’s solid performance.
Quarterly Performance Highlights
Fulton Financial reported GAAP net income available to common shareholders of $97.9 million for Q3 2025, a slight increase from $96.6 million in Q2 2025. On an operating (non-GAAP) basis, net income reached $101.3 million, up from $100.6 million in the previous quarter.
As shown in the following financial highlights table, the company maintained strong profitability metrics while improving its efficiency ratio:
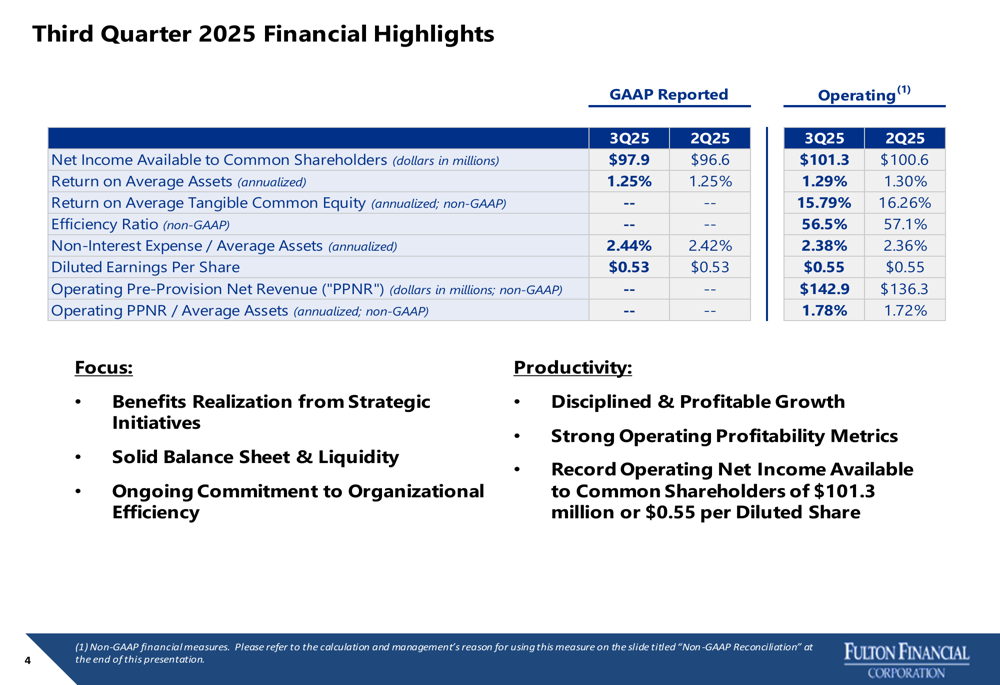
The bank’s efficiency ratio improved to 56.5% from 57.1% in the previous quarter, reflecting management’s focus on operational excellence. Operating pre-provision net revenue increased to $142.9 million from $136.3 million in Q2, demonstrating the company’s ability to generate higher revenue while controlling expenses.
Detailed Financial Analysis
Fulton’s income statement reveals solid performance across key metrics, with net interest income increasing by $9.3 million quarter-over-quarter to $264.2 million. This growth was partially offset by a modest increase in non-interest expense of $3.8 million.
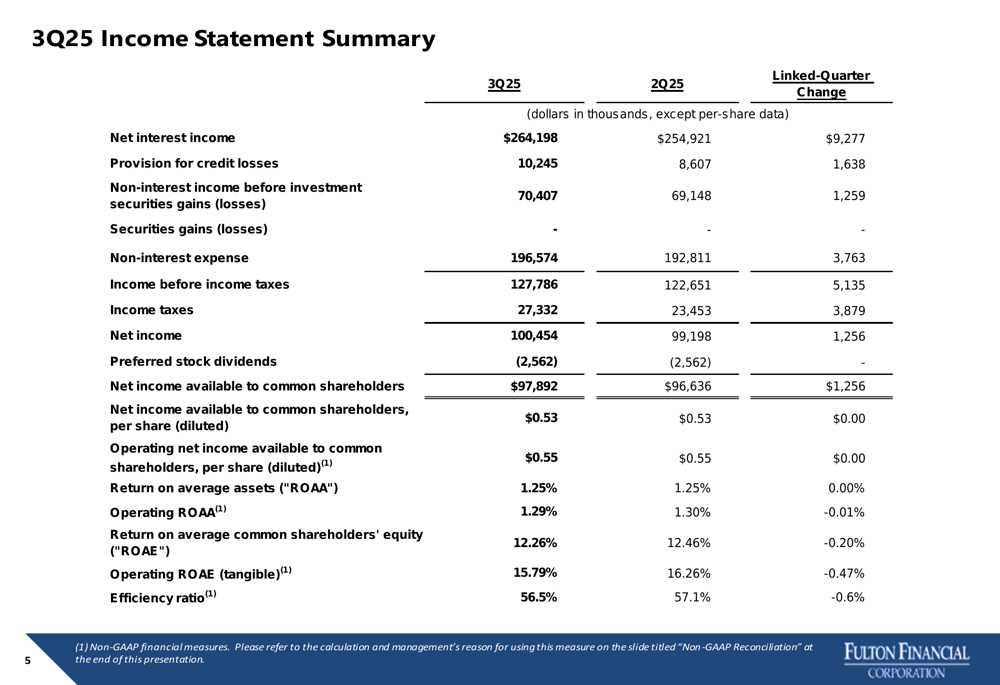
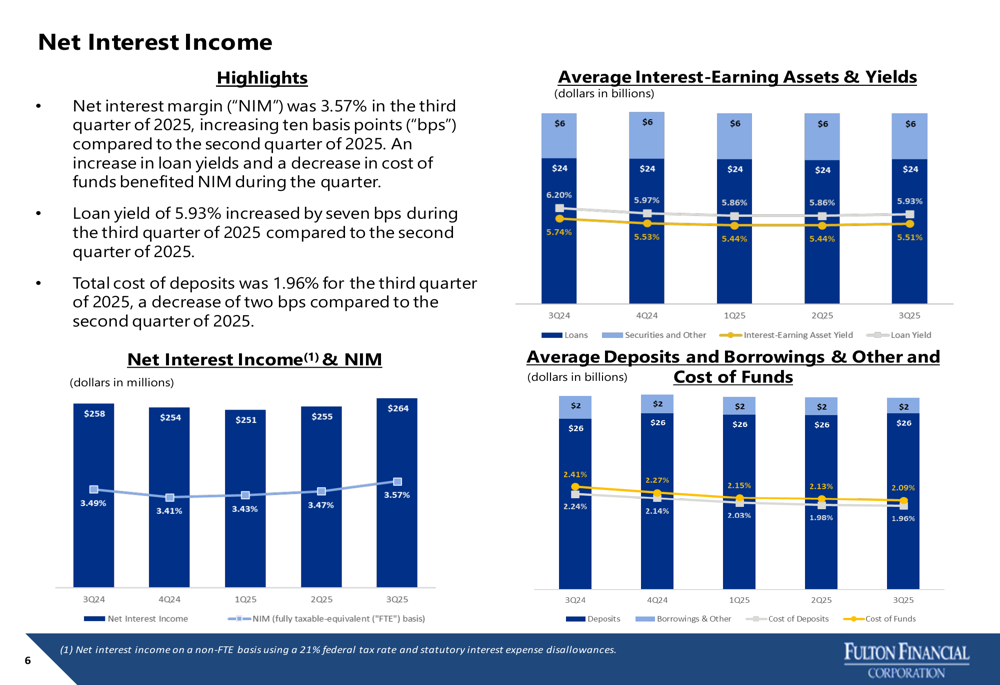
The most notable improvement came in net interest margin (NIM), which expanded by 10 basis points to 3.57% compared to the previous quarter. This expansion was driven by a 7 basis point increase in loan yields to 5.93%, while the cost of deposits decreased by 2 basis points to 1.96%.
The following chart illustrates the positive trend in NIM and net interest income over the past year:
CEO Curt Myers emphasized the company’s strategic focus during the earnings call, stating, "Our community banking strategy and regional scale continue to deliver customer value and strong results for our shareholders." He also highlighted the importance of organic growth, saying, "We are focused on continuing to generate organic growth so that we can drive positive operating leverage."
Revenue Diversification and Expense Management
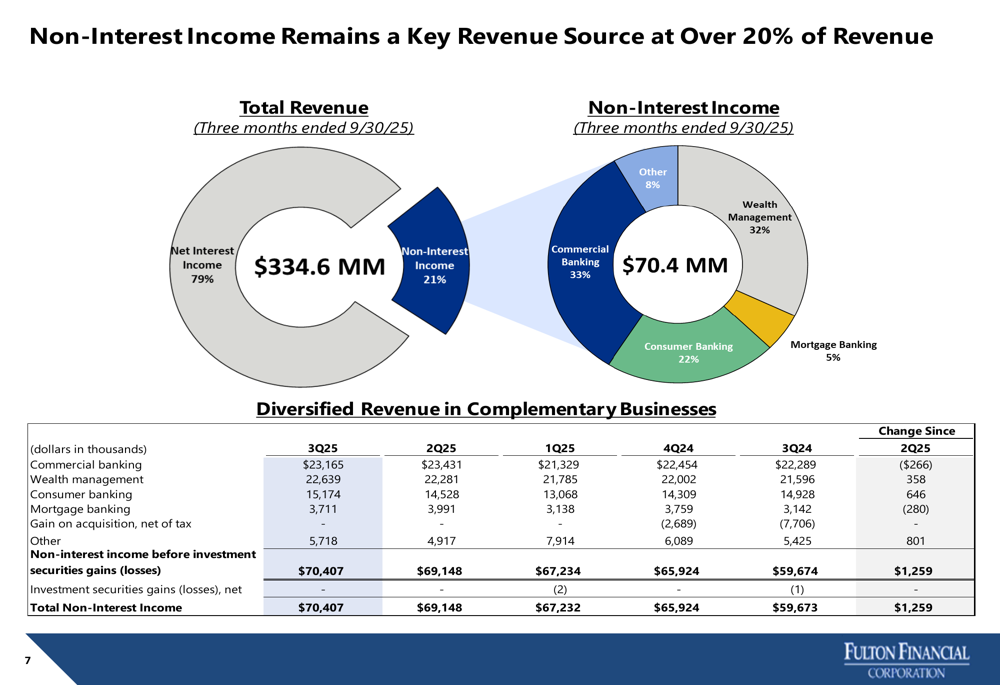
Fulton’s revenue streams remain well-diversified, with non-interest income accounting for 21% of total revenue. Commercial banking and wealth management represent the largest contributors to non-interest income at 33% and 32%, respectively.
The following chart breaks down the company’s non-interest income composition:
On the expense side, operating non-interest expense increased by $3.8 million on a linked-quarter basis, primarily due to higher incentive compensation expenses and an additional calendar day in the third quarter. Management continues to focus on operational efficiency, which is reflected in the improved efficiency ratio.
Asset Quality and Capital Position
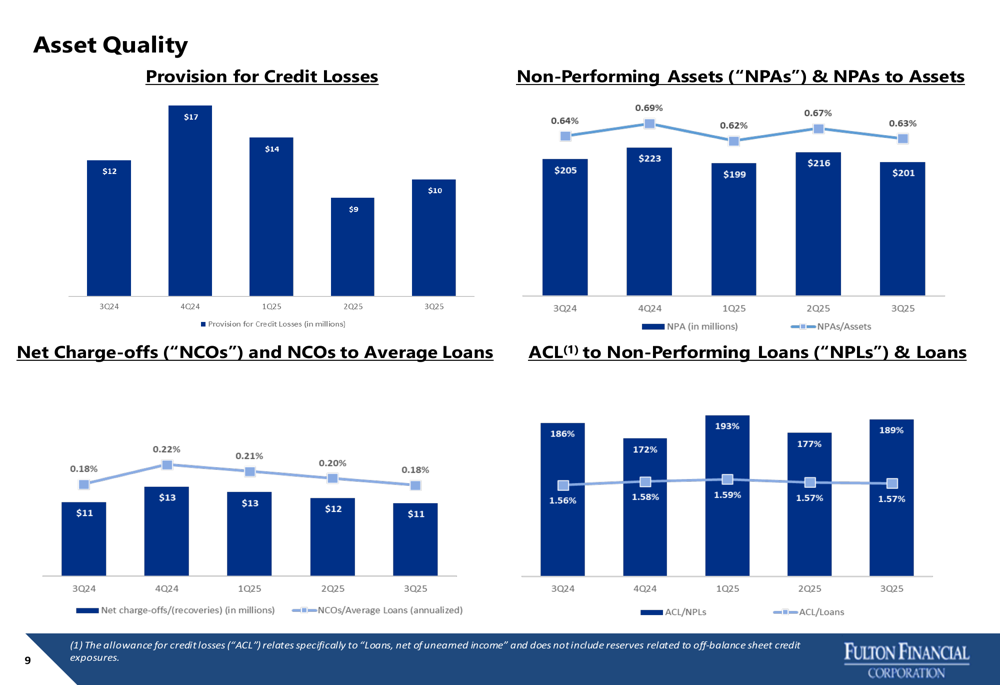
Fulton maintained stable asset quality metrics during the quarter. Non-performing assets decreased to $201 million (0.63% of assets) from $216 million (0.67%) in the previous quarter. Net charge-offs declined to $11 million (0.18% of average loans) from $12 million (0.20%).
The following charts illustrate the trends in asset quality metrics:
The company’s capital position remains strong, with regulatory capital ratios well above required minimums. Tier 1 leverage ratio stood at 9.5%, common equity tier 1 at 11.5%, tier 1 risk-based at 12.3%, and total risk-based capital at 14.9%.
Strategic Positioning and Market Presence
Fulton Financial operates 200 financial centers across Pennsylvania, Maryland, Virginia, Delaware, and New Jersey, positioning itself as a community bank with regional scale. The company’s market capitalization is approximately $3.1 billion, with current valuation at 8.9x trailing twelve months diluted EPS of $1.91 and 1.2x tangible book value.
The following map illustrates Fulton’s geographic footprint and key metrics:
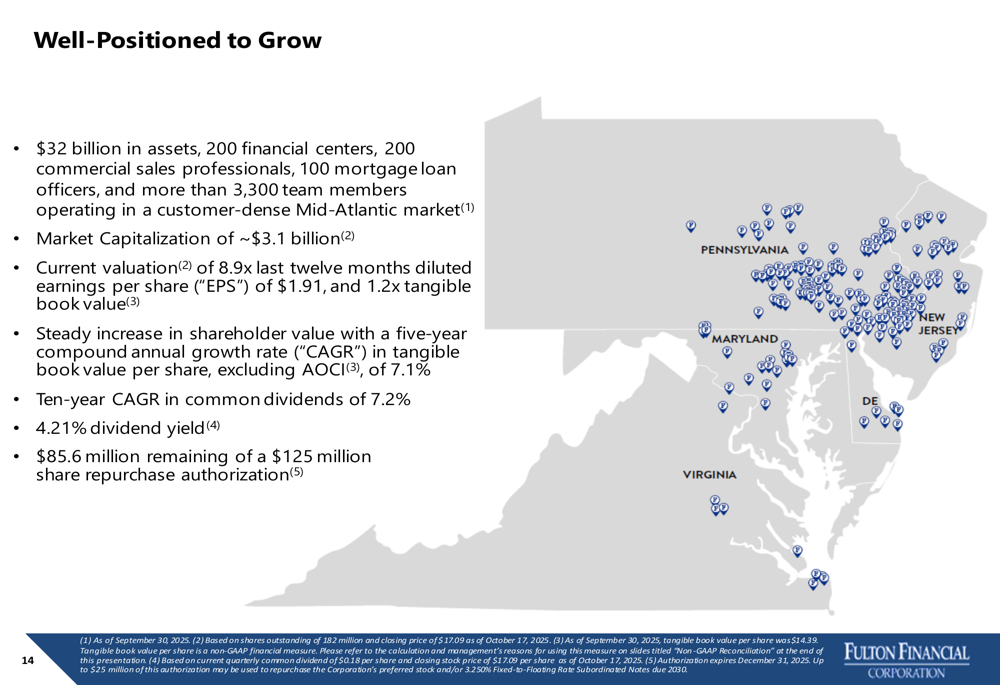
The company has demonstrated a commitment to shareholder returns, with a five-year compound annual growth rate (CAGR) in tangible book value per share of 7.1% and a ten-year CAGR in common dividends of 7.2%. The current dividend yield stands at 4.21%, and the company has $85.6 million remaining from its $125 million share repurchase authorization.
Loan and Deposit Portfolio Diversification
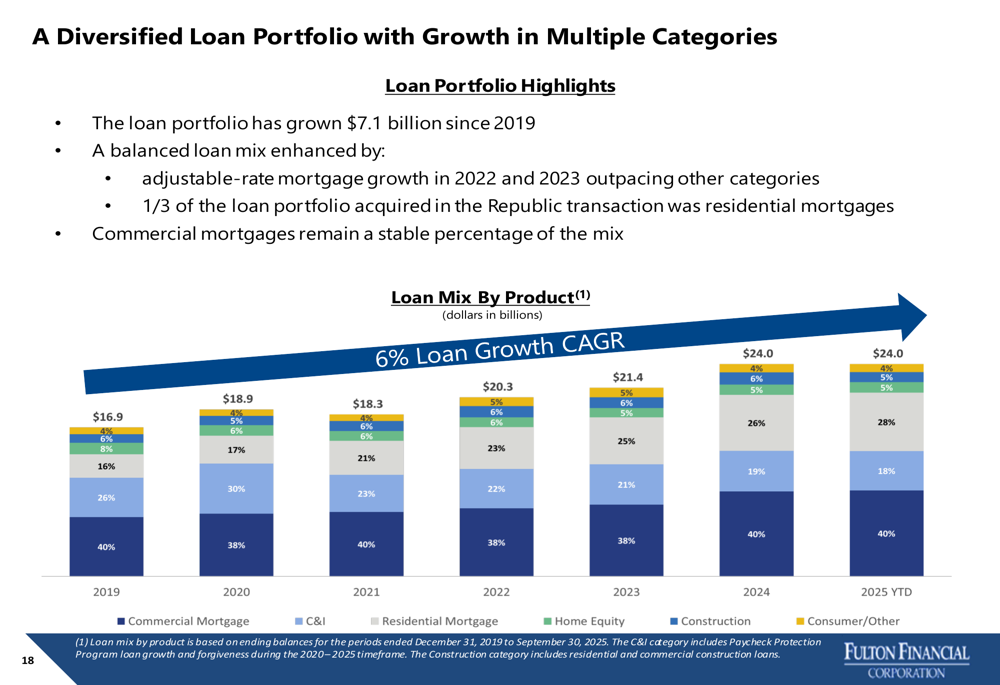
Fulton’s loan portfolio has grown by $7.1 billion since 2019, with a notable shift toward residential mortgages, which now comprise 28% of the portfolio compared to 16% in 2019. Commercial mortgages remain the largest component at 40%, while commercial and industrial (C&I) loans have decreased from 26% to 18% over the same period.
The following chart shows the evolution of Fulton’s loan portfolio mix:
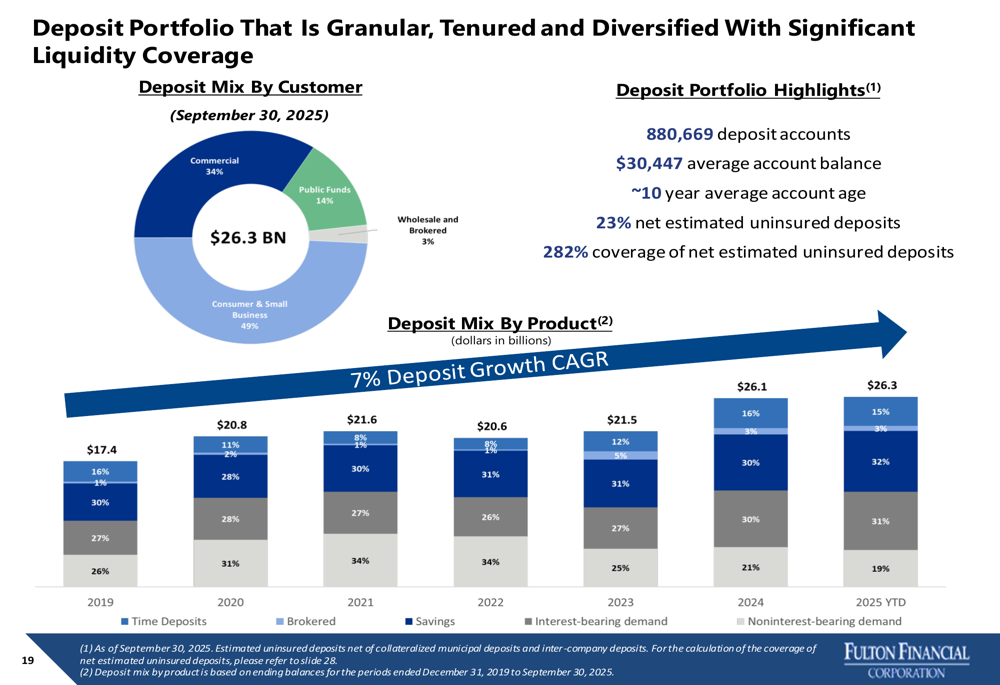
On the deposit side, Fulton maintains a granular and diversified base with 880,669 deposit accounts and an average account balance of $30,447. The company has successfully reduced its reliance on time deposits, which decreased from 26% of total deposits in 2019 to 19% in 2025 YTD, while increasing its proportion of savings and interest-bearing demand deposits.
The deposit portfolio composition is illustrated below:
Forward-Looking Statements
Fulton Financial updated its 2025 guidance to reflect recent Federal Reserve rate cuts, projecting net interest income between $1.025 billion and $1.035 billion. This guidance incorporates expected federal funds target rate cuts of 25 basis points in both October and December.
The company lowered its provision for credit losses range to $45-55 million, reflecting actual performance to date and expected low single-digit loan growth. Non-interest income is projected at $270-280 million, while operating non-interest expense is expected to be in the range of $750-760 million.
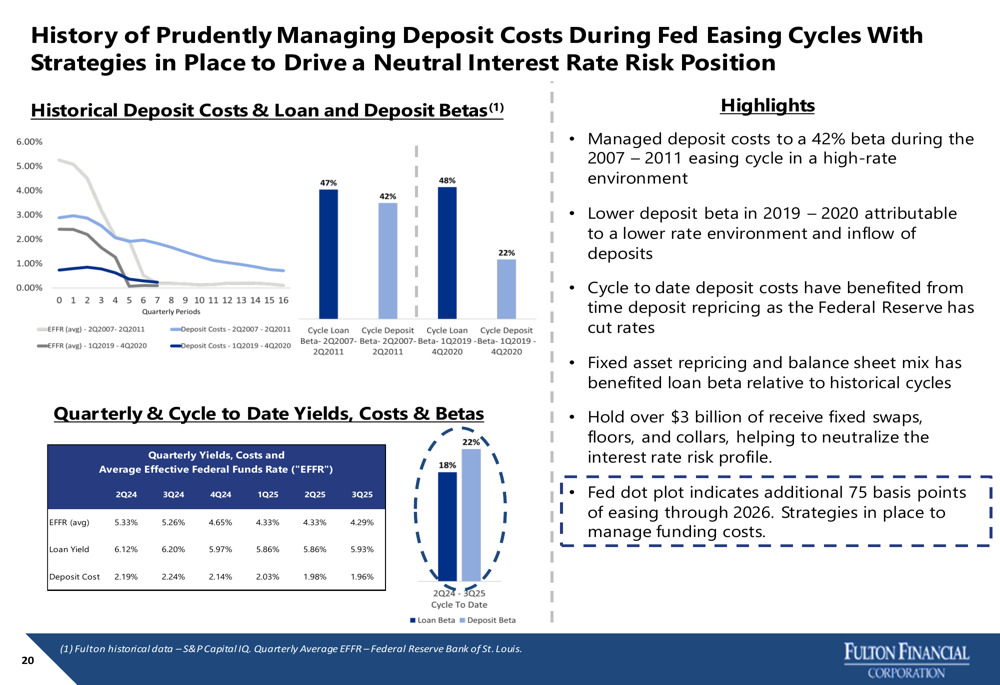
Fulton’s historical performance in managing deposit costs during previous Fed easing cycles positions it well for the current environment. The company has implemented strategies to neutralize interest rate risk, including holding over $3 billion in receive-fixed swaps, floors, and collars.
Looking ahead, Fulton Financial appears well-positioned to navigate the changing interest rate environment, supported by its diversified business model, strong deposit franchise, and effective balance sheet management. The company’s community banking strategy and regional scale continue to deliver value to customers and shareholders, as evidenced by its strong financial performance in the third quarter of 2025.
Full presentation:
This article was generated with the support of AI and reviewed by an editor. For more information see our T&C.