Beamr video compression achieves up to 50% improvement for AVs

The Hanover Insurance Group, Inc. (NYSE:THG) presented its second quarter 2025 results on July 31, 2025, revealing significant improvements in profitability and underwriting performance across all business segments. The company reported operating income per diluted share of $4.35, up from $3.87 in Q1 2025, continuing its strong momentum into the second quarter.
Quarterly Performance Highlights
Hanover delivered exceptional second quarter results, with net and operating income per diluted share of $4.30 and $4.35 respectively, representing a substantial increase from $1.12 and $1.88 in the prior-year quarter. The company achieved net and operating return on equity of 20.1% and 18.7%, significantly outperforming the 6.4% and 9.0% returns from Q2 2024.
As shown in the following comprehensive overview of key metrics, the company demonstrated strong performance across multiple financial indicators:
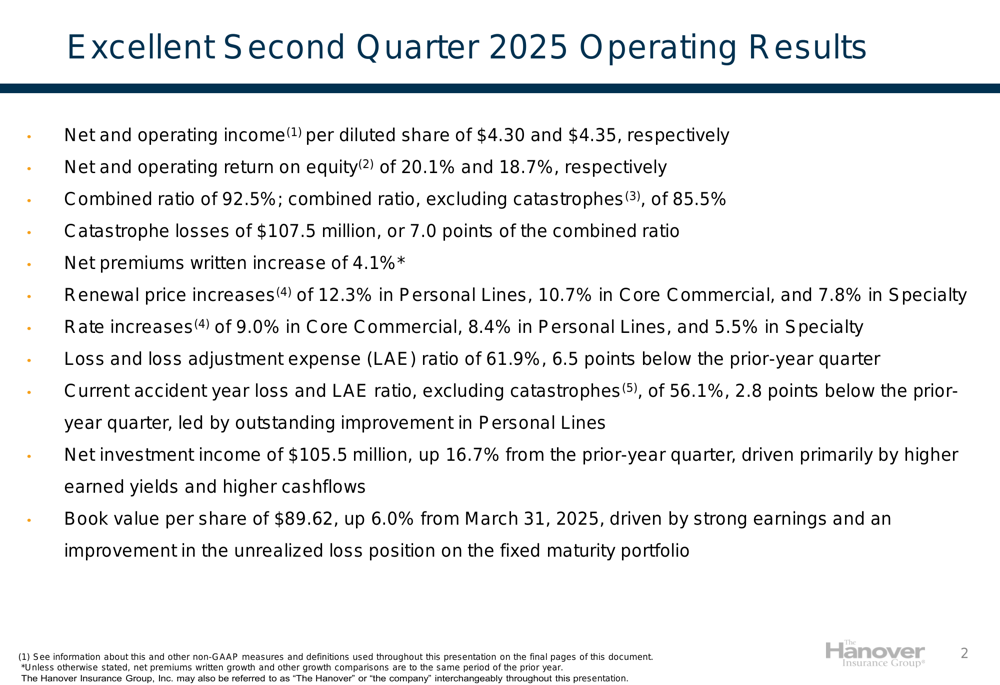
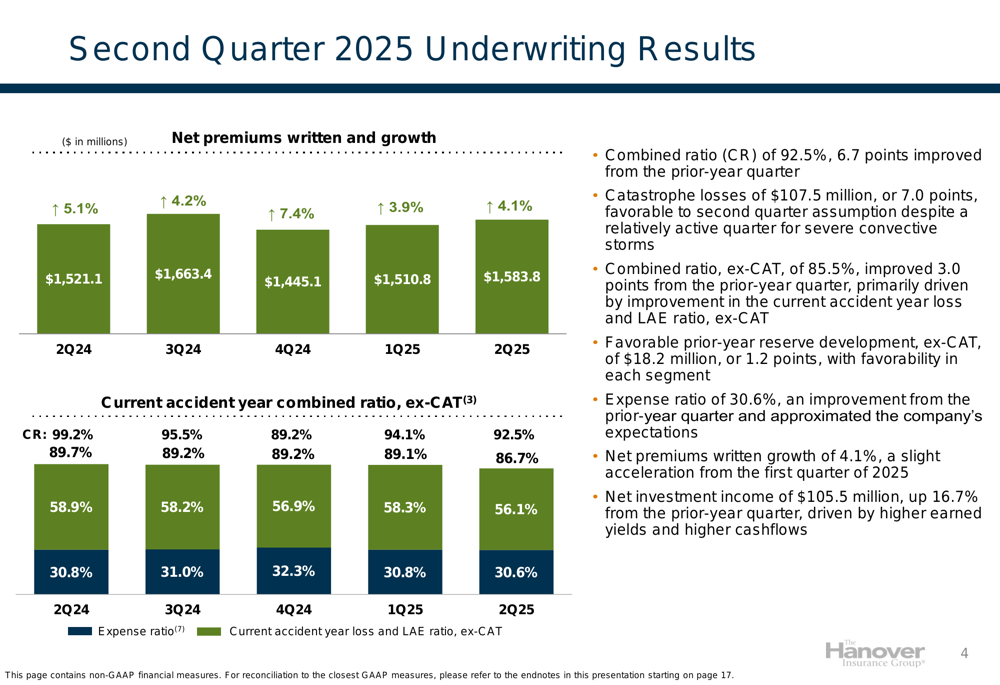
The company’s combined ratio improved to 92.5%, compared to 99.2% in the prior-year quarter, with the combined ratio excluding catastrophes at 85.5%. Catastrophe losses totaled $107.5 million, or 7.0 points of the combined ratio, which was favorable to the company’s second quarter assumptions.
The consolidated financial results show substantial year-over-year improvement in both quarterly and year-to-date performance:
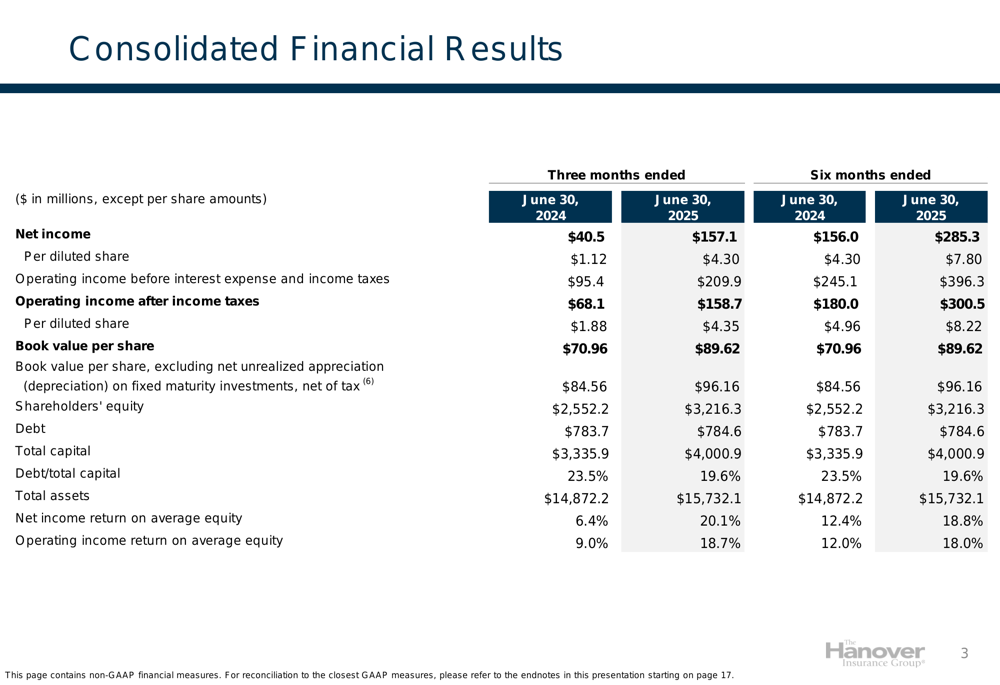
Net premiums written increased by 4.1% to $1,583.8 million, while the company continued to implement significant rate increases across all segments. Book value per share grew to $89.62, up 6.0% from March 31, 2025, and 26.3% from June 30, 2024.
The following chart illustrates the company’s premium growth trend and improving combined ratio over the past five quarters:
Segment Performance Analysis
Core Commercial
Hanover’s Core Commercial segment reported a combined ratio of 93.0% for the quarter, slightly higher than the 91.8% in the prior-year quarter. However, the current accident year combined ratio, excluding catastrophes, was 89.4%, only marginally higher than the 89.1% in Q2 2024.
The detailed underwriting results for Core Commercial show stable performance despite increased catastrophe losses:
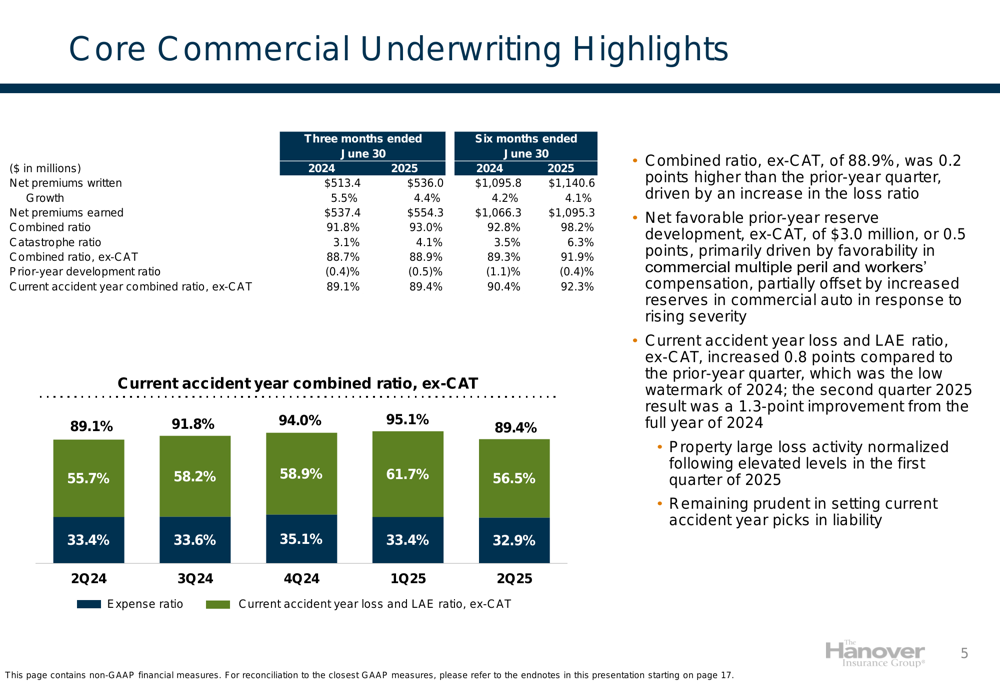
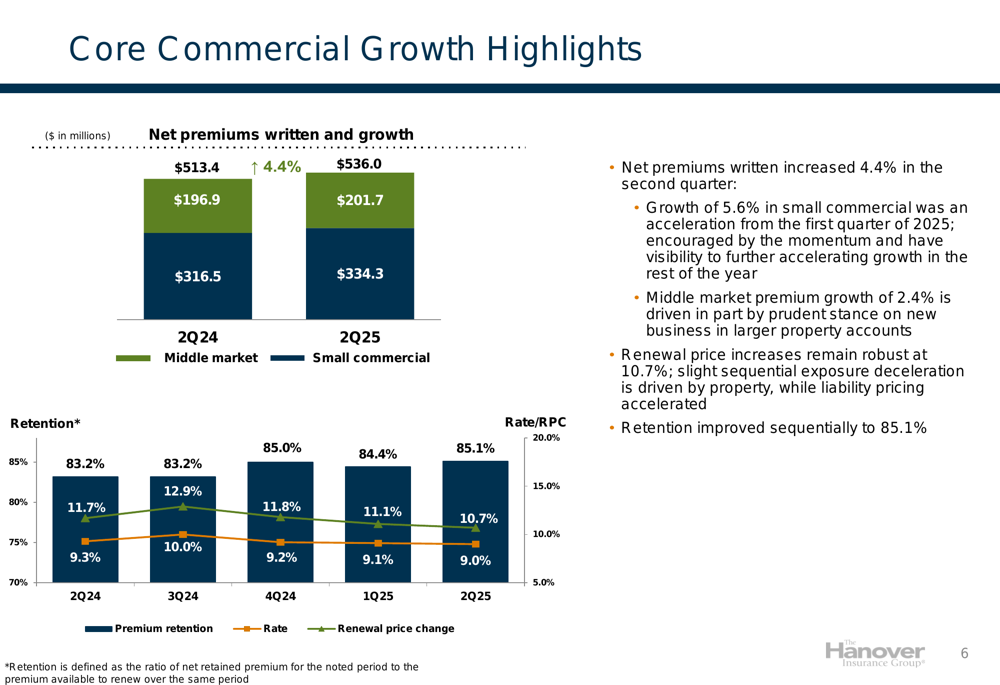
Net premiums written in Core Commercial grew by 4.4% to $536.0 million, with middle market premiums increasing by 5.6% and small commercial by 2.4%. Renewal price increases remained robust at 10.7%, while retention improved sequentially to 85.1%.
The following chart demonstrates the segment’s growth metrics and pricing trends:
Specialty
The Specialty segment delivered exceptional results, with a combined ratio of 86.5%, improving 6.6 points from 93.1% in the prior-year quarter. The combined ratio excluding catastrophes was 82.4%, a 4.0-point improvement from Q2 2024.
The segment’s underwriting performance shows significant improvement in both catastrophe and non-catastrophe metrics:
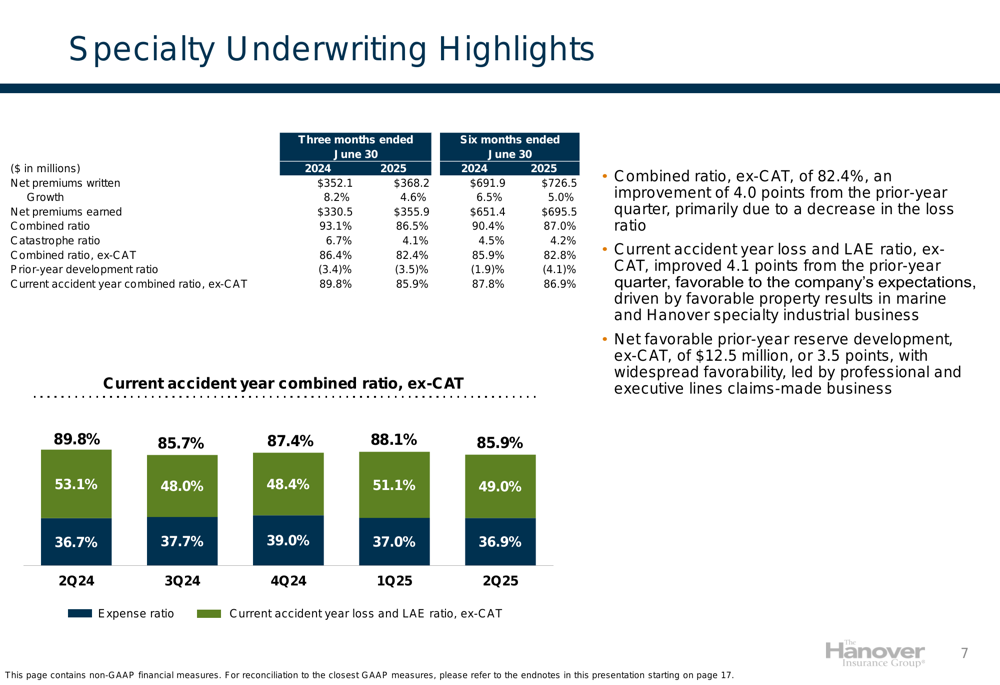
Net premiums written in Specialty grew by 4.6% to $368.2 million, with strong performance across most profitable lines. The company maintained disciplined underwriting in certain property lines while capturing growth opportunities elsewhere.
Personal Lines
Personal Lines showed the most dramatic improvement among all segments, with the combined ratio decreasing to 95.5% from 109.1% in the prior-year quarter. The combined ratio excluding catastrophes improved by 5.1 points to 84.4%.
The following chart details the segment’s underwriting performance:
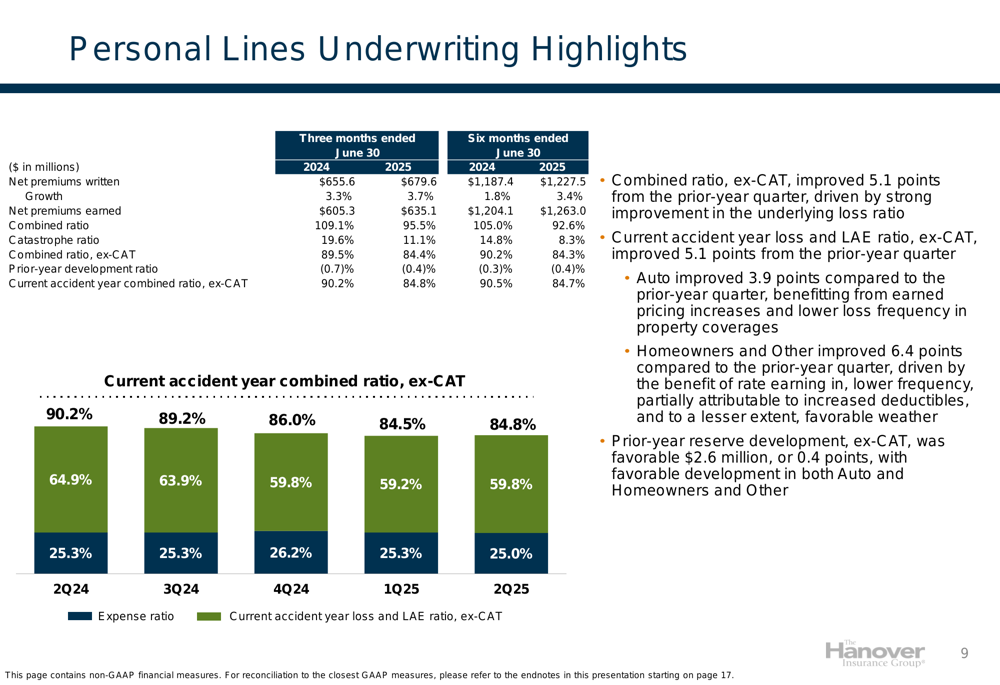
Net premiums written in Personal Lines increased by 3.7% to $679.6 million, with approximately 8% growth in target diversification states. The company continued to implement significant pricing actions, with renewal price increases of 12.3% overall and 15.7% in homeowners.
Investment Performance
Hanover reported net investment income of $105.5 million for the quarter, a 16.7% increase from the prior-year quarter. This growth was primarily driven by higher yields on fixed maturities, with the earned yield increasing to 4.24% from 3.53% in Q2 2024.
The following chart illustrates the company’s investment income trends and portfolio composition:
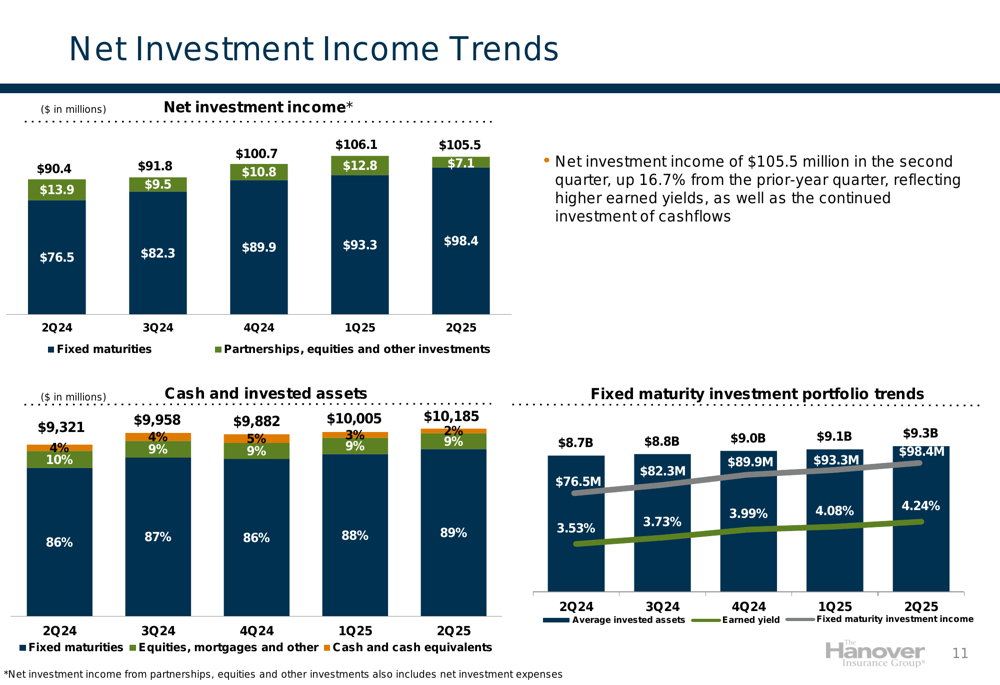
The company maintains a high-quality investment portfolio with 95% of fixed maturity securities rated as investment grade. The portfolio has a weighted average quality rating of A+ and a duration of 4.4 years, providing a solid foundation for stable investment returns.
Forward-Looking Statements
Based on the strong Q2 results, Hanover appears well-positioned to continue its positive momentum into the second half of 2025. The company’s strategic pricing actions and disciplined underwriting approach have yielded significant improvements in profitability across all segments.
The Q2 results align with and exceed the expectations set during the Q1 earnings call, where management anticipated increased premium growth and strong underwriting profitability. The company has successfully executed its margin recapture strategy and catastrophe mitigation plans, as evidenced by the improved combined ratios across all segments.
Hanover’s stock closed at $166.45 on July 30, 2025, down 0.73% for the day, but remains well within its 52-week range of $130.60 to $178.68. The strong Q2 results may provide positive momentum for the stock, which has already delivered impressive returns of 7.98% year-to-date and 29.73% over the past year, according to the company’s Q1 earnings report.
With continued pricing discipline, improving underwriting results, and strong investment performance, Hanover Insurance Group demonstrates a solid foundation for sustainable profitability and shareholder value creation in the remainder of 2025 and beyond.
Full presentation:
This article was generated with the support of AI and reviewed by an editor. For more information see our T&C.