Nvidia among investors in xAI’s $20 bln capital raise- Bloomberg

Introduction & Market Context
Helix Energy Solutions Group Inc . (NYSE:HLX) released its second quarter 2025 earnings presentation on July 24, showing a significant year-over-year decline in financial performance amid challenging market conditions. The offshore energy services provider, which focuses on well intervention, robotics, and decommissioning, reported a 17% drop in revenue compared to the same period last year.
The company’s presentation highlighted its strategic positioning across three key areas: maximizing existing reserves, lowering decommissioning costs, and supporting offshore renewables. This diversification strategy has become increasingly important as Helix navigates a challenging energy market environment.
Quarterly Performance Highlights
Helix reported Q2 2025 revenue of $302 million, down from $365 million in Q2 2024. The company posted a net loss of $3 million (-$0.02 per share), a significant decline from the $32 million profit ($0.21 per share) achieved in the same quarter last year. Adjusted EBITDA fell to $42 million from $97 million year-over-year.
The financial results also represent a deterioration from Q1 2025, when the company reported a positive EPS of $0.02 and net income of $3 million, suggesting increasing headwinds as 2025 progresses.
As shown in the following summary of financial results:
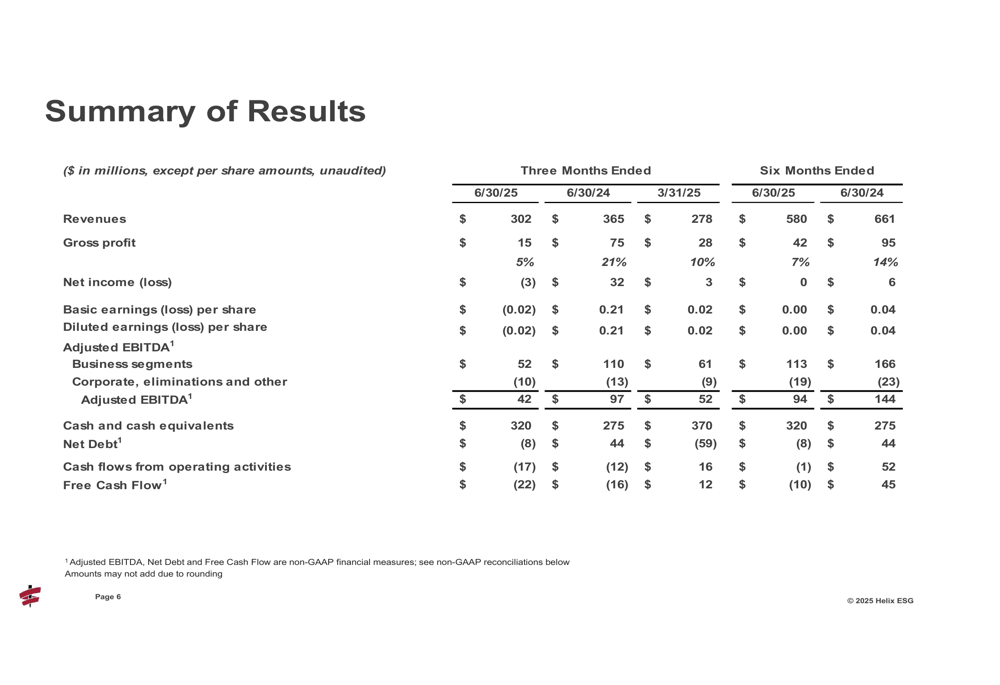
The company’s gross profit margin contracted sharply to 5% from 21% in the prior-year period, reflecting operational challenges and pricing pressures. Cash flow also turned negative, with operating cash flows of -$17 million and free cash flow of -$22 million for the quarter.
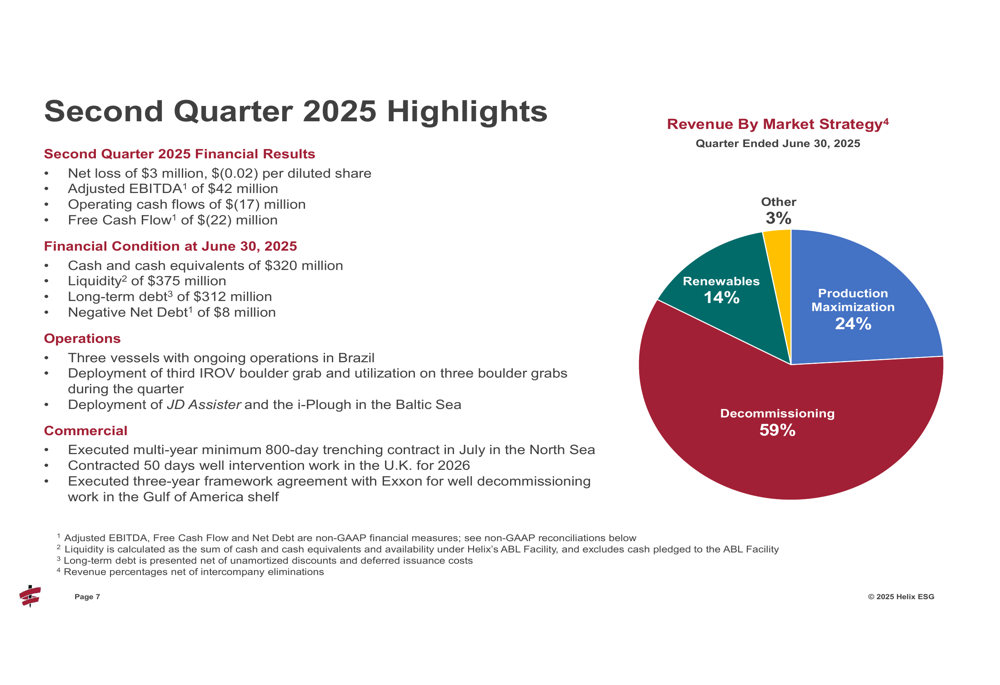
The revenue breakdown by market strategy reveals Helix’s increasing focus on decommissioning, which now accounts for 59% of revenue, followed by production maximization at 24%, renewables at 14%, and other services at 3%.
This strategic revenue mix is illustrated in the following quarterly highlights:
Segment Analysis
Helix’s performance showed significant divergence across its business segments. The Well Intervention segment, which generated $157 million in revenue, posted a gross loss of $12 million (negative 8% margin). This underperformance was partially offset by the Robotics segment, which delivered $86 million in revenue with a robust gross profit of $22 million (25% margin). The Shallow Water Abandonment segment contributed $51 million in revenue with a modest $1 million gross profit (3% margin).
The detailed segment results demonstrate this performance divergence:
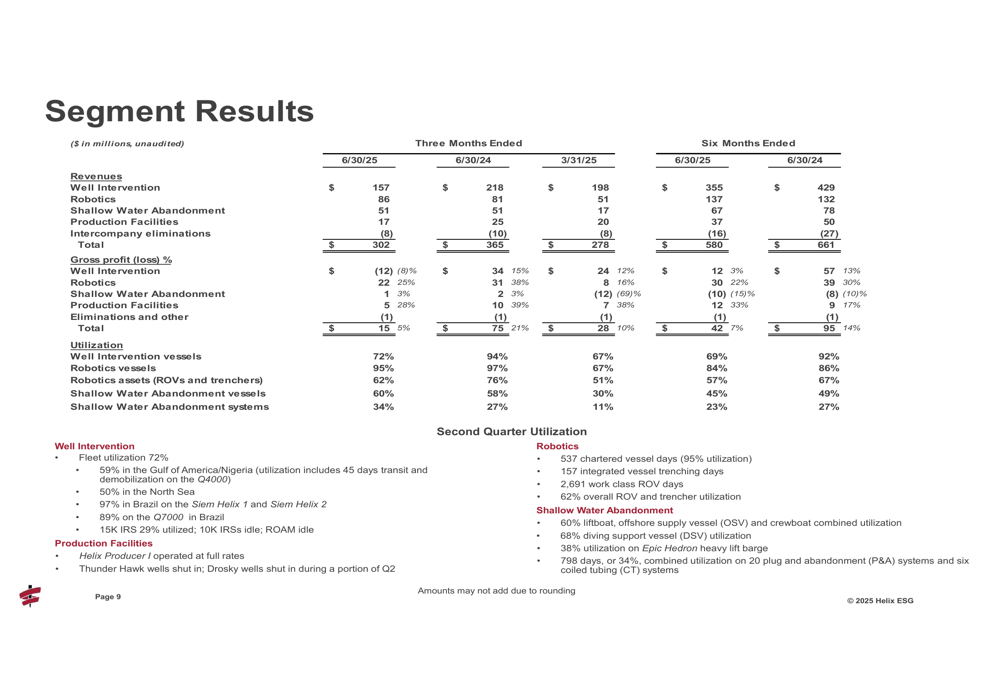
Vessel utilization rates varied widely across the fleet. In the Well Intervention segment, the Q5000 vessel showed particularly low utilization at just 37%, while others like the Well Enhancer and Siem Helix 2 achieved 100% utilization. The Robotics segment maintained strong utilization rates, with Grand Canyon II and Shelia Bordelon both at 100% and Grand Canyon III at 82%.
Financial Position and Capital Allocation
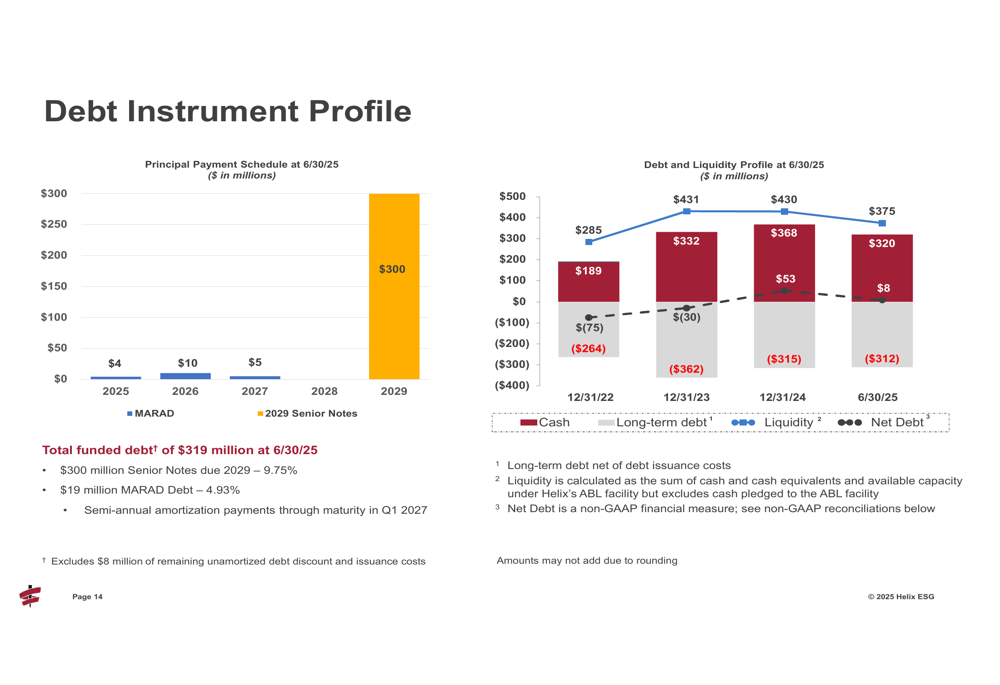
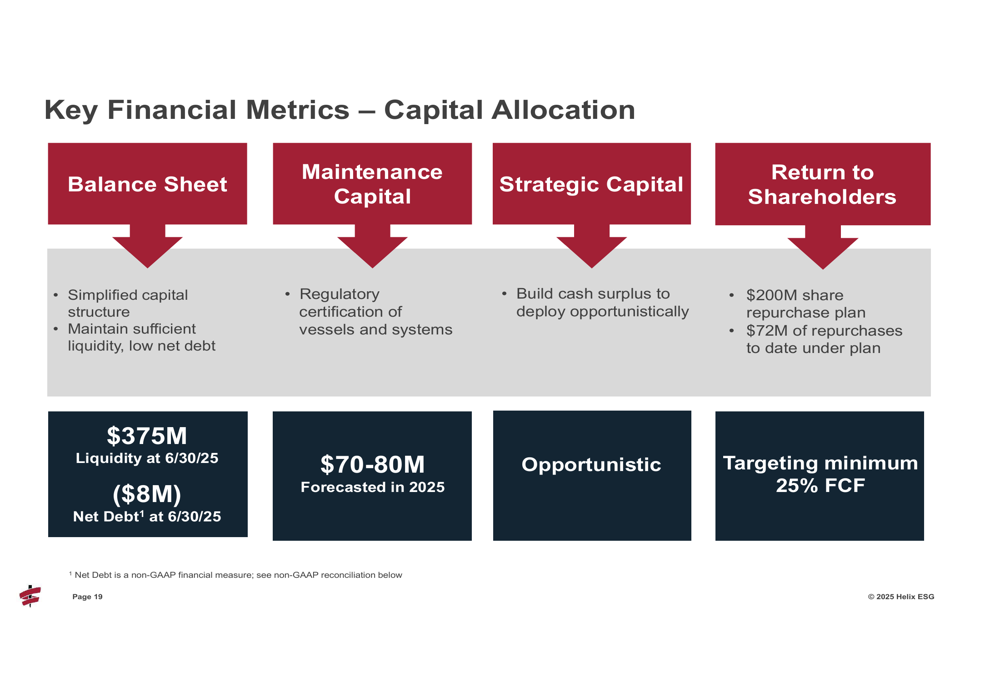
Despite operational challenges, Helix maintained a strong financial position with $320 million in cash and cash equivalents as of June 30, 2025, though this represents a decline from the $370 million reported at the end of Q1. The company’s total liquidity stood at $375 million, with long-term debt of $312 million resulting in a negative net debt position of $8 million.
The company’s debt profile and liquidity position are detailed in the following chart:
Helix continues to prioritize shareholder returns, targeting a minimum of 25% of free cash flow for share repurchases. The company has a $200 million share repurchase plan in place, with $72 million of repurchases completed to date. This capital allocation framework balances maintaining balance sheet strength with returning capital to shareholders.
The company’s capital allocation priorities are outlined as follows:
2025 Outlook
Looking ahead, Helix provided full-year 2025 guidance with revenue projected between $1,200 million and $1,300 million and Adjusted EBITDA between $225 million and $265 million. The company expects capital additions of $70-80 million and forecasts free cash flow of $90-140 million for the year.
The 2025 forecast is presented in detail here:
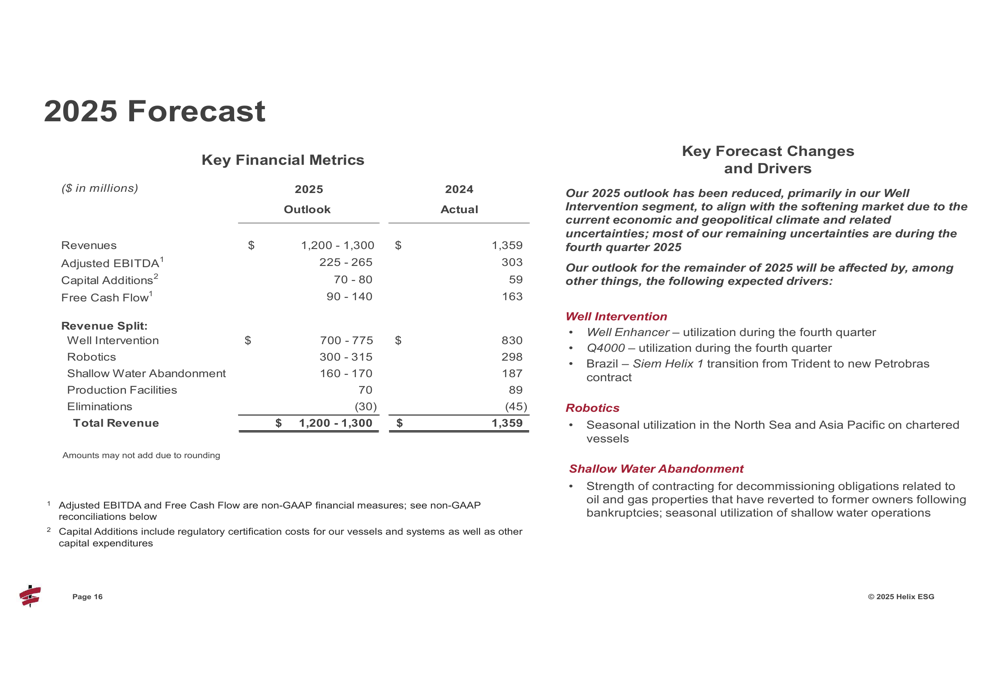
By segment, Helix expects continued contracted work for its Q5000 and Q4000 vessels in the Well Intervention division, while the Seawell vessel remains warm-stacked. The Robotics segment is anticipated to perform well, with the Grand Canyon II expected to be highly utilized with contracted ROV support work in the Asia Pacific region.
In the after-hours trading following the earnings release, Helix’s stock rose slightly by 0.31% to $6.55, after gaining 6.43% during the regular trading session. The stock remains well below its 52-week high of $12.89, reflecting ongoing investor concerns about the company’s performance trajectory.
The company’s seasonal business pattern typically shows stronger performance in Q2 and Q3, with weaker results in Q1 and Q4. However, the current Q2 results break this pattern with weaker-than-expected performance during what should be a stronger seasonal period, raising questions about the remainder of 2025.
Full presentation:
This article was generated with the support of AI and reviewed by an editor. For more information see our T&C.