ION expands ETF trading capabilities with Tradeweb integration

Introduction & Market Context
Hoist Finance AB (STO:HOFI) presented its second quarter 2025 results on July 25, showing a mixed financial performance characterized by declining headline profits but improving underlying metrics. The debt purchasing specialist, which acquires non-performing loans from financial institutions, continues to expand its investment portfolio despite facing higher funding costs in the current interest rate environment.
The company’s stock has shown resilience over the past year, with fundamentals data indicating a 44.17% return over the previous 12 months. Hoist Finance shares closed at SEK 94 on July 24, 2025, up 1.02% on the day, and remain well above their 52-week low of SEK 60.20.
Quarterly Performance Highlights
Hoist Finance reported profit before tax of SEK 310 million for Q2 2025, representing an 18% decrease compared to SEK 377 million in the same quarter last year. However, the company emphasized its underlying profit before tax of SEK 335 million, which improved from SEK 315 million year-over-year.
As shown in the following financial summary chart, the company’s net interest income grew modestly by 4% to SEK 885 million, while total operating expenses decreased by 11% to SEK 732 million, demonstrating effective cost management:
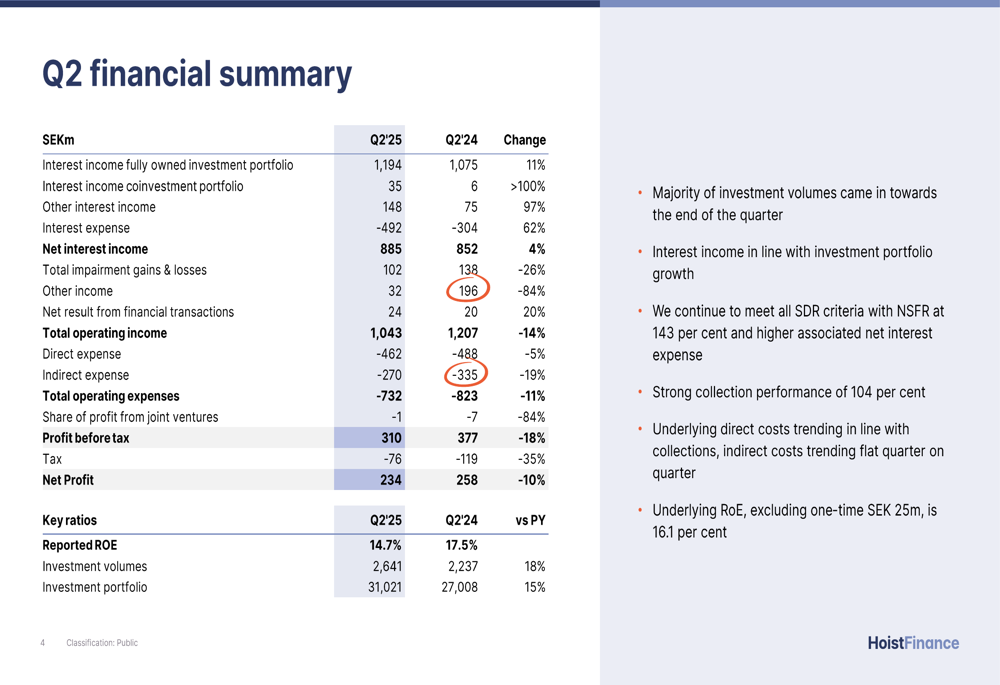
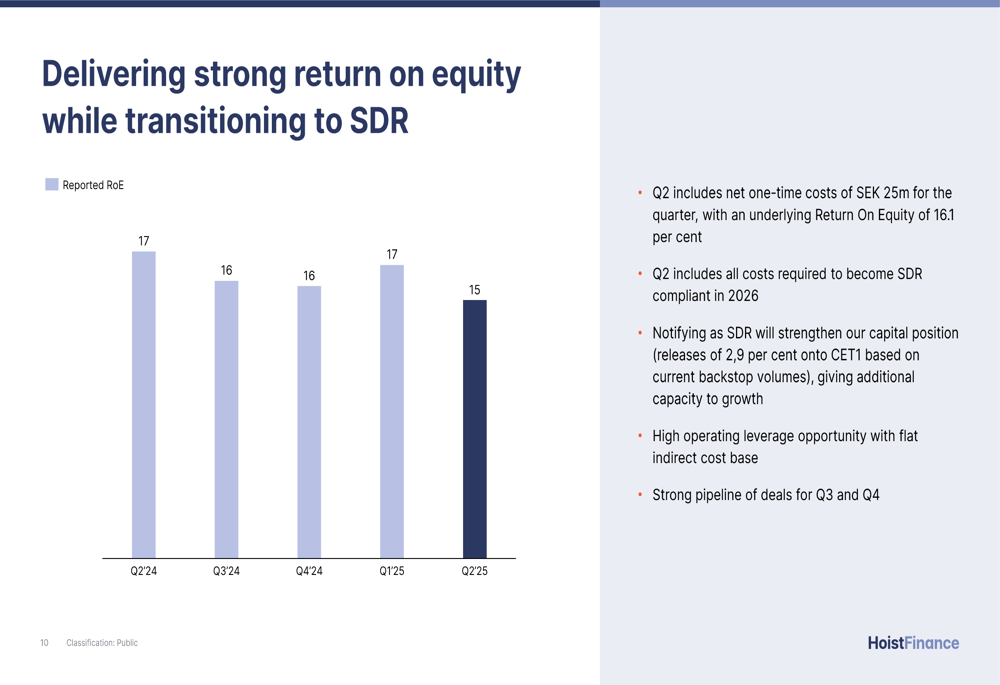
Return on equity declined to 14.7% from 17.5% in Q2 2024, continuing a downward trend observed in Q1 2025 when ROE was 16.7%. However, the company highlighted an underlying ROE of 16.1% for Q2 2025, compared to 13.7% in the same period last year.
The following chart illustrates the ROE trend over the past five quarters:
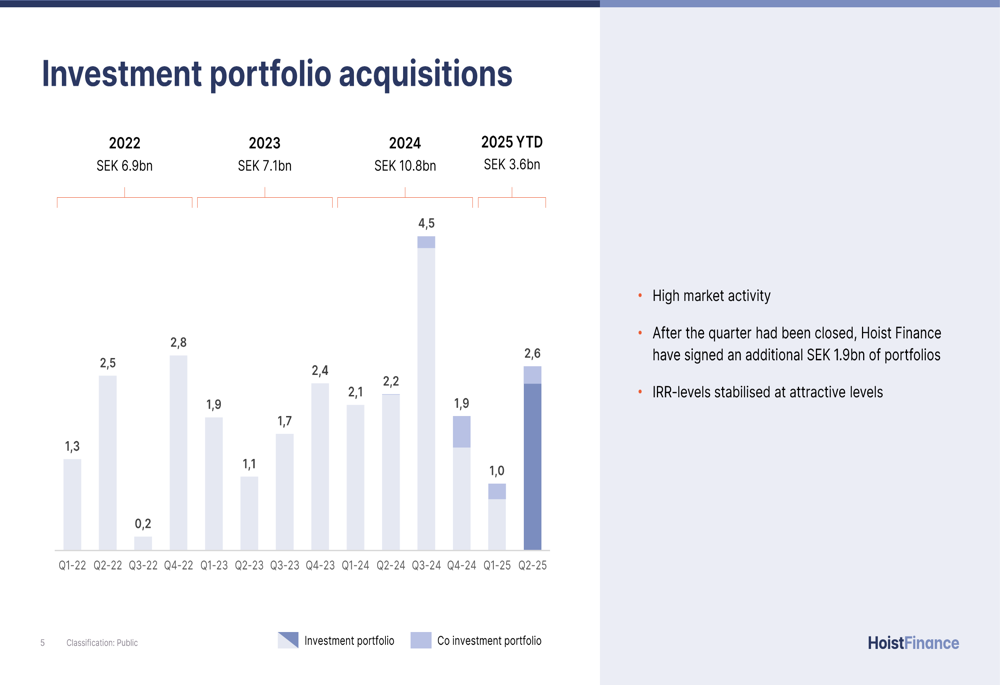
Portfolio investments remained robust at SEK 2.6 billion during the quarter, representing an 18% increase from Q2 2024. This activity expanded Hoist Finance’s total investment portfolio to SEK 31 billion, a 15% year-over-year increase. The company also disclosed an additional SEK 1.9 billion in portfolio investments signed after the quarter closed.
The investment trend over recent years is visualized in this chart:
Detailed Financial Analysis
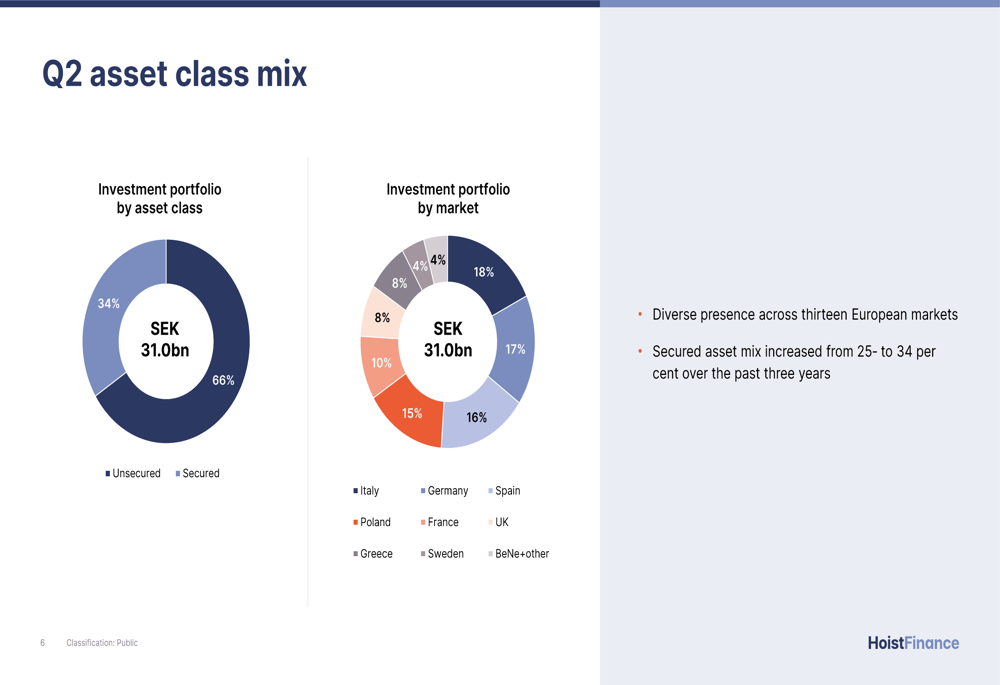
Hoist Finance’s asset portfolio maintains a strategic balance between secured and unsecured debt, with 66% secured assets and 34% unsecured assets. Geographically, the portfolio is well-diversified across major European markets, with Italy (18%), Germany (17%), Spain (16%), and France (15%) representing the largest exposures.
The following chart breaks down the company’s asset class mix and geographical distribution:
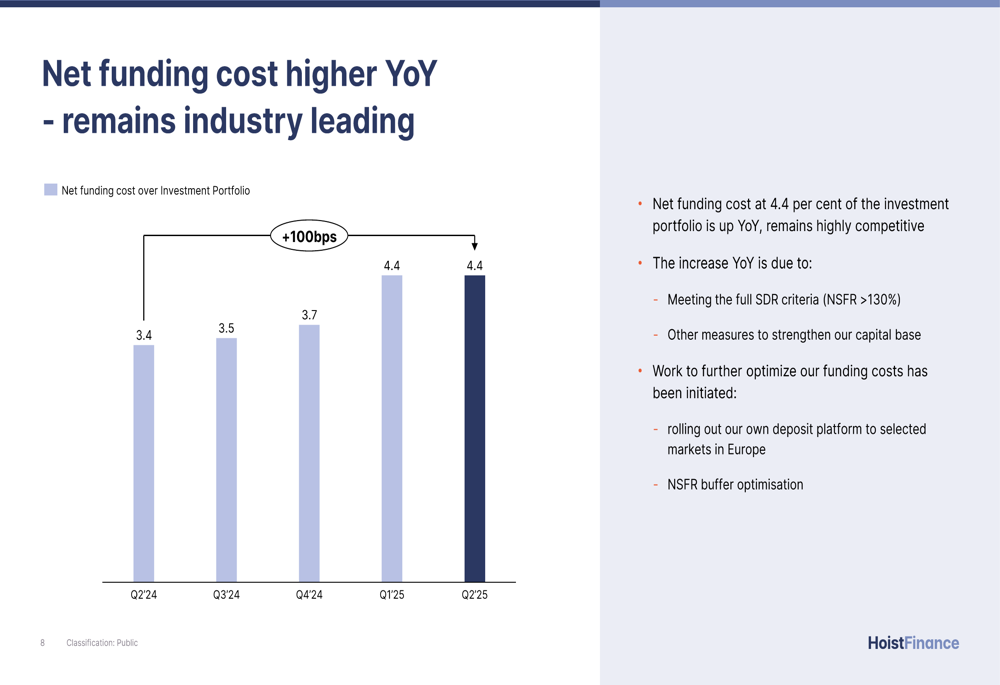
A notable challenge for Hoist Finance has been rising funding costs, which increased by 100 basis points year-over-year to 4.4% in Q2 2025. This increase was attributed to measures taken to meet Specialized Debt Restructurer (SDR) criteria, particularly the Net Stable Funding Ratio (NSFR) requirement of over 130%.
The following chart illustrates the rising trend in net funding costs:
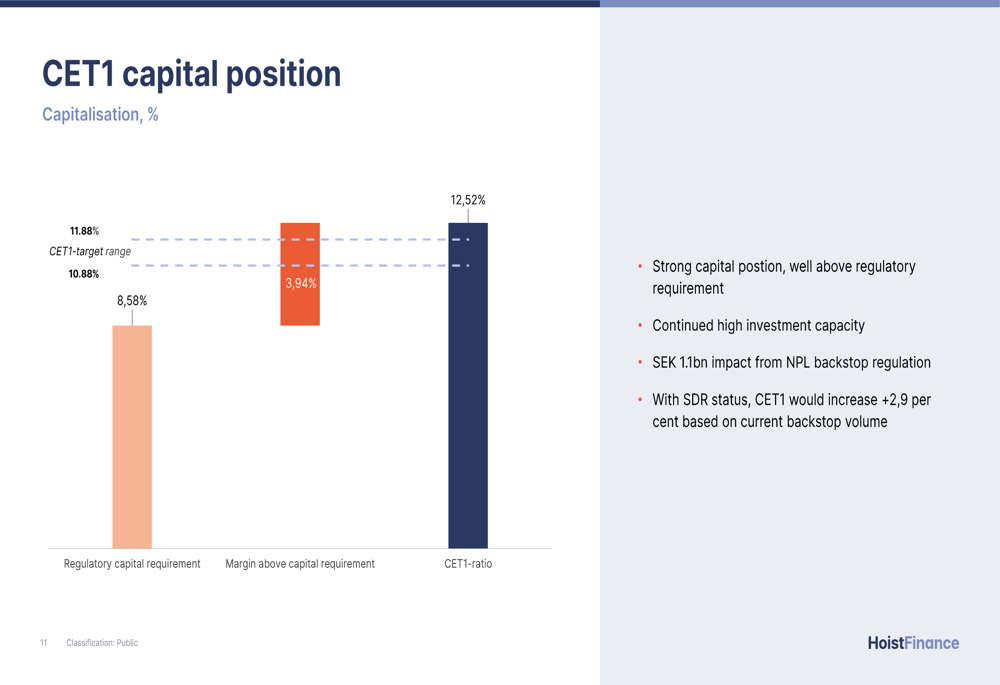
Despite these higher funding costs, Hoist Finance maintains a strong capital position with a Common Equity Tier 1 (CET1) ratio of 12.52%, significantly above the regulatory requirement of 8.58%. This capital buffer provides continued investment capacity for portfolio acquisitions.
The company’s capital position is illustrated in this chart:
Strategic Initiatives
Hoist Finance continues to progress toward qualifying as a Specialized Debt Restructurer (SDR) by 2026, which would strengthen its capital position by releasing approximately 2.9% onto CET1 based on current backstop volumes. The company already meets all SDR criteria, including maintaining an NSFR above 130% (currently at 143%).
In July 2025, Moody’s Ratings affirmed all ratings and assessments of Hoist Finance while changing the outlook on the group’s long-term issuer and senior unsecured debt ratings to positive from stable, reflecting improved financial fundamentals.
The company has initiated efforts to optimize funding costs, including plans to roll out its own deposit platform to selected European markets and optimize its NSFR buffer. These initiatives aim to counteract the rising funding costs that have pressured profitability.
Forward-Looking Statements
Looking ahead, Hoist Finance emphasized its strong pipeline of deals for Q3 and Q4 2025, suggesting continued portfolio growth. Management highlighted the company’s high operating leverage opportunity with a flat indirect cost base, which should support improved profitability if collection performance remains strong.
The company summarized its outlook with these key points:
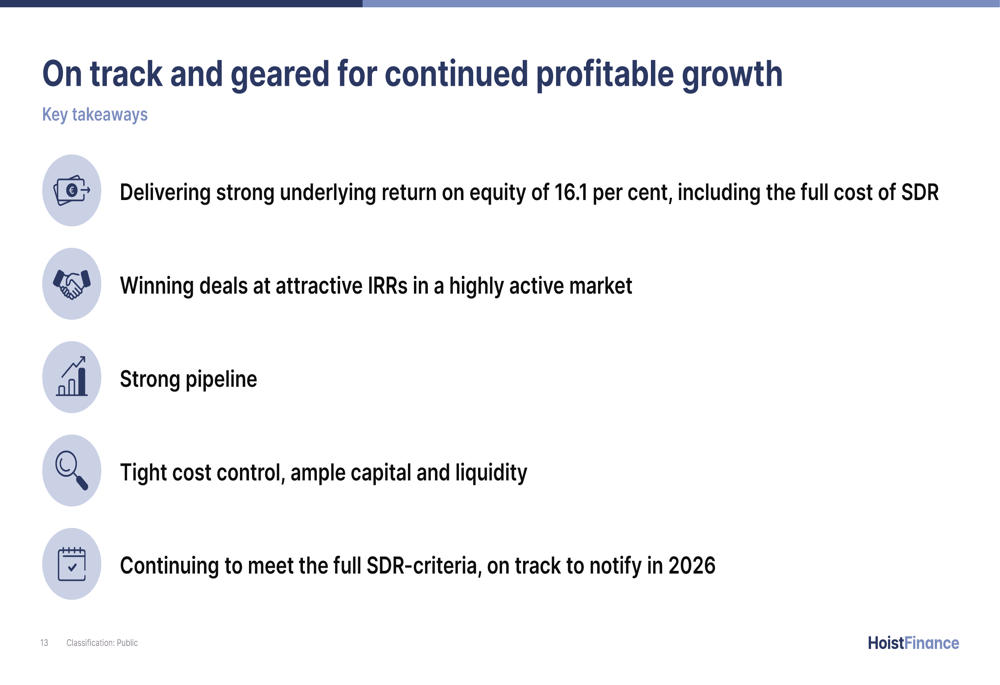
Collections performance remains robust at 104% across markets, though slightly below the 106% reported in Q2 2024. This metric, combined with tight cost control and strong capital and liquidity positions, positions Hoist Finance to pursue continued growth despite macroeconomic uncertainties.
The Q2 2025 results represent a shift from Q1 2025, when the company reported a 19% increase in profit before tax. This change highlights the challenges Hoist Finance faces in maintaining profitability amid rising funding costs, even as it successfully expands its investment portfolio and improves operational efficiency.
Full presentation:
This article was generated with the support of AI and reviewed by an editor. For more information see our T&C.