Crispr Therapeutics shares tumble after significant earnings miss

Introduction & Market Context
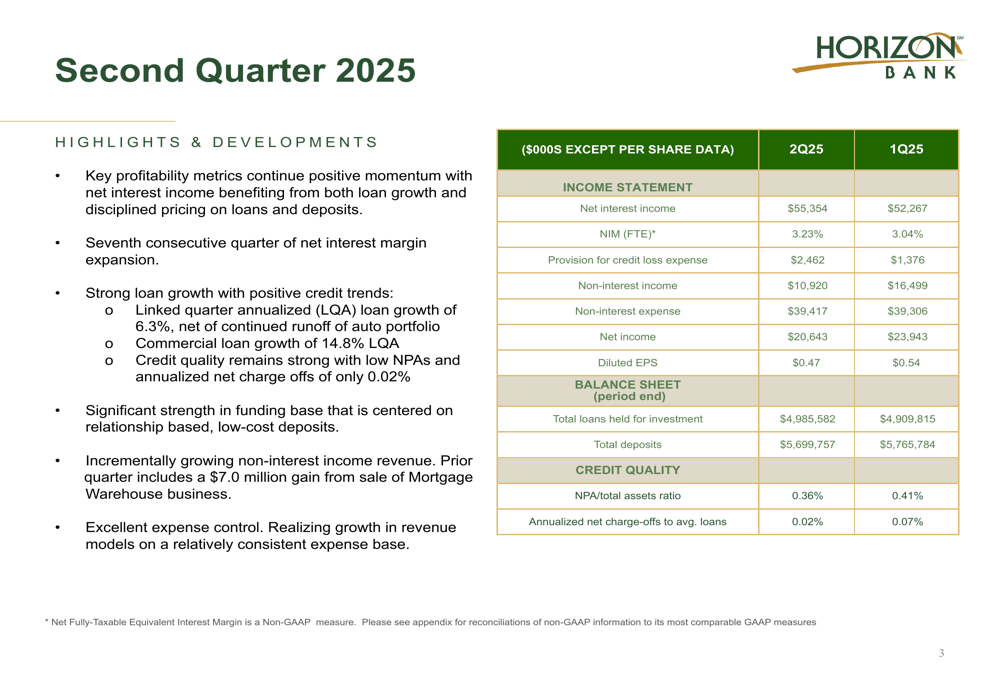
Horizon Bancorp (NASDAQ:HBNC) presented its second quarter 2025 results on July 24, 2025, highlighting continued margin expansion and robust commercial loan growth. The Midwestern bank reported diluted earnings per share of $0.47 for Q2, down from $0.54 in the previous quarter, primarily due to a one-time gain in Q1 from the sale of its mortgage warehouse business.
The bank’s stock closed at $15.92 on July 23, 2025, trading within its 52-week range of $12.70 to $19.18. Following strong Q1 results that exceeded analyst expectations, Horizon continues to position itself as a stable regional banking player focused on relationship-based lending in its core Midwestern markets.
Quarterly Performance Highlights
Horizon reported net income of $20.64 million for Q2 2025, compared to $23.94 million in the previous quarter. This decline was largely attributable to lower non-interest income, which fell to $10.92 million from $16.50 million in Q1, when the bank recorded a $7.0 million gain from the sale of its mortgage warehouse business.
The bank’s net interest income showed significant improvement, increasing to $55.35 million from $52.27 million in the previous quarter. This 5.9% sequential growth reflects Horizon’s continued success in expanding its net interest margin.
As shown in the following chart of key financial metrics:
Loan Portfolio and Credit Quality
Horizon’s total loans held for investment grew by $75.8 million or 1.5% from the previous quarter to $4.99 billion. This growth was driven primarily by commercial loans, which increased by $117 million and now represent 66% of the bank’s total loan portfolio. The commercial growth helped offset intentional runoff in the lower-yielding indirect auto portfolio.
The bank’s strategic focus on commercial lending is illustrated in this loan composition chart:
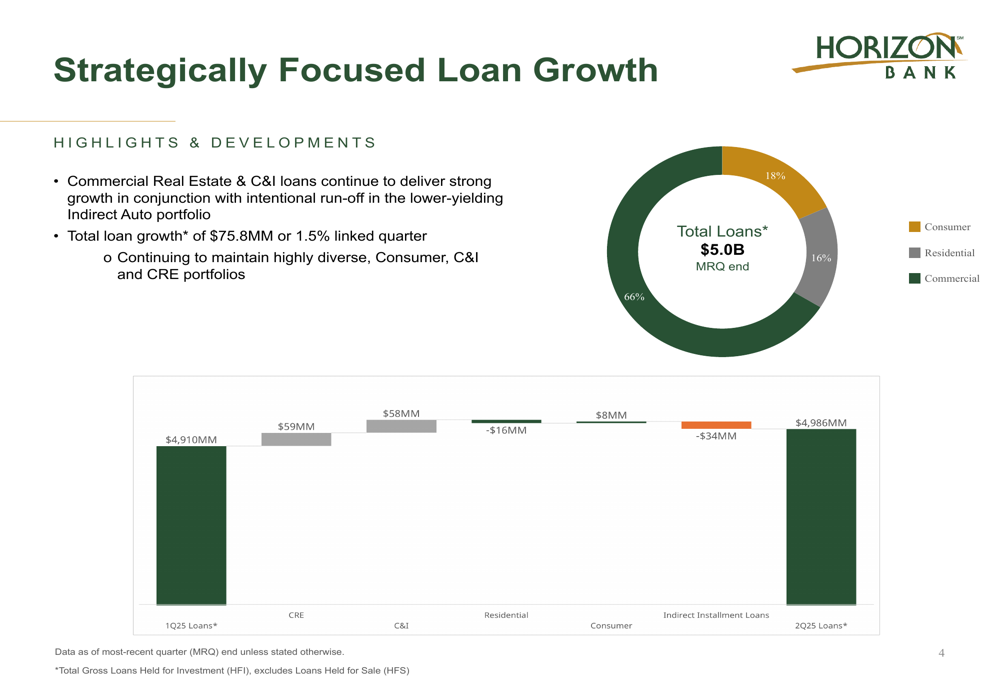
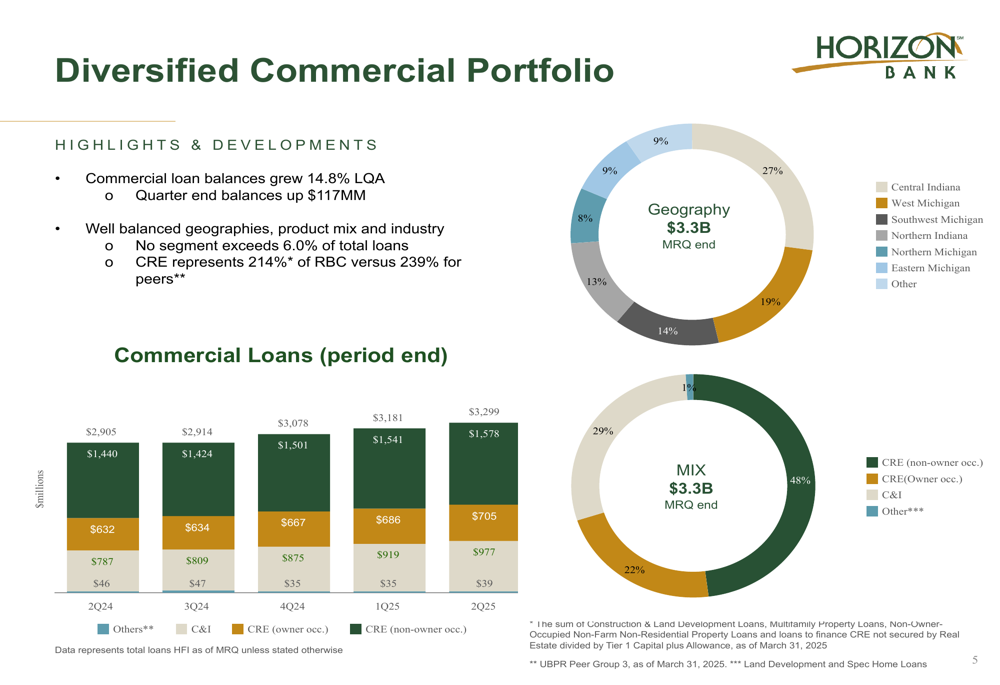
Commercial loan balances grew at an annualized rate of 14.8% during the quarter, with particularly strong performance in commercial real estate and C&I lending. Horizon maintains a well-diversified commercial portfolio across geographies and industries, with no segment exceeding 6.0% of total loans.
The following chart demonstrates the bank’s commercial portfolio diversification:
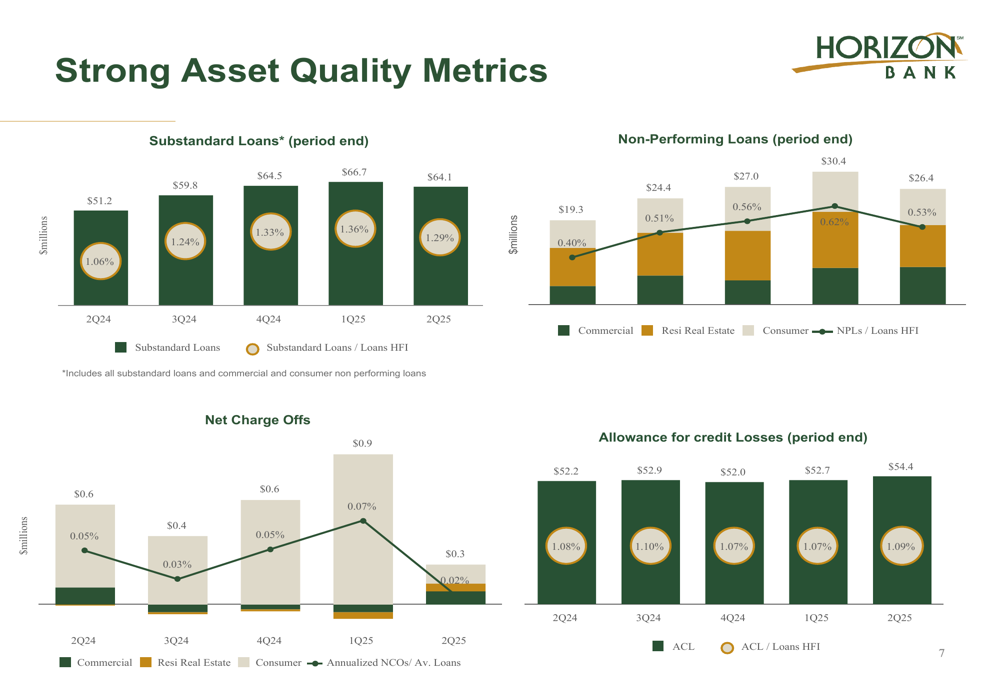
Credit quality metrics remained strong, though showing slight increases in watched assets. Non-performing loans increased to $26.4 million or 0.53% of total loans, up from 0.40% a year earlier. Similarly, substandard loans rose to $64.1 million (1.29% of total loans) from $51.2 million (1.06%) in Q2 2024. The allowance for credit losses held steady at 1.08% of total loans.
These credit quality trends are illustrated in the following chart:
Net Interest Margin and Funding
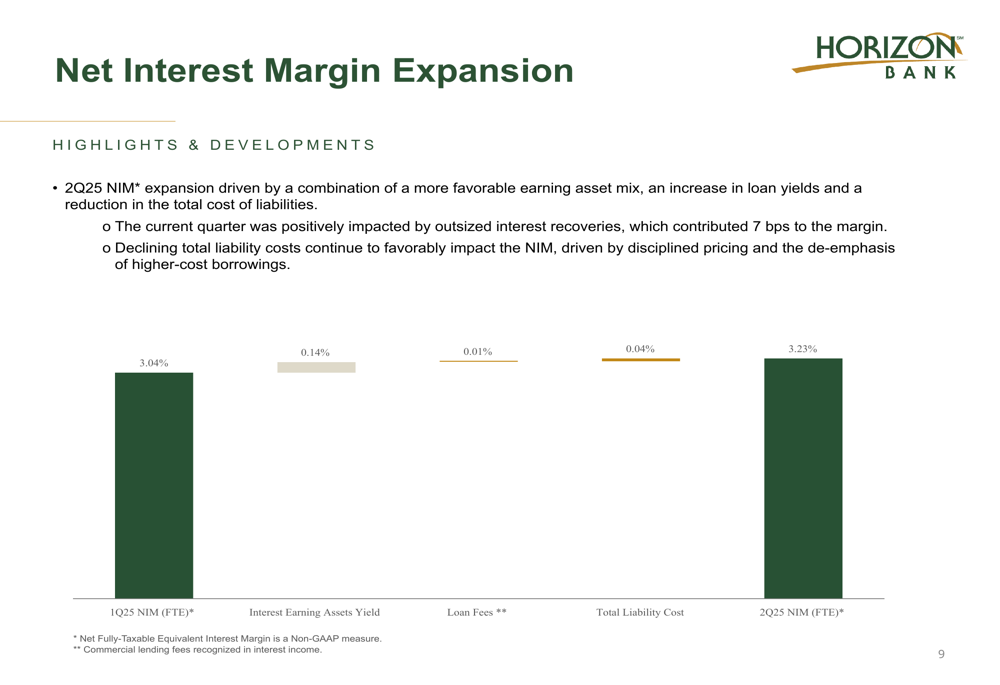
A key highlight of Horizon’s Q2 results was the continued expansion of its net interest margin (NIM), which increased to 3.23% from 3.04% in the previous quarter. This marks the seventh consecutive quarter of NIM expansion for the bank, reflecting improved earning asset mix, higher loan yields, and reduced funding costs.
The quarter’s NIM was positively impacted by outsized interest recoveries, which contributed 7 basis points to the margin. The bank’s disciplined pricing approach and reduced reliance on higher-cost borrowings also contributed to margin improvement.
The following chart breaks down the components of Horizon’s NIM expansion:
On the funding side, Horizon reported total deposits of $5.70 billion, slightly down from $5.77 billion in the previous quarter. The bank continues to focus on relationship-based core deposits, with particular emphasis on treasury management services for commercial clients and primary banking relationships in the public sector.
Capital Position and Outlook
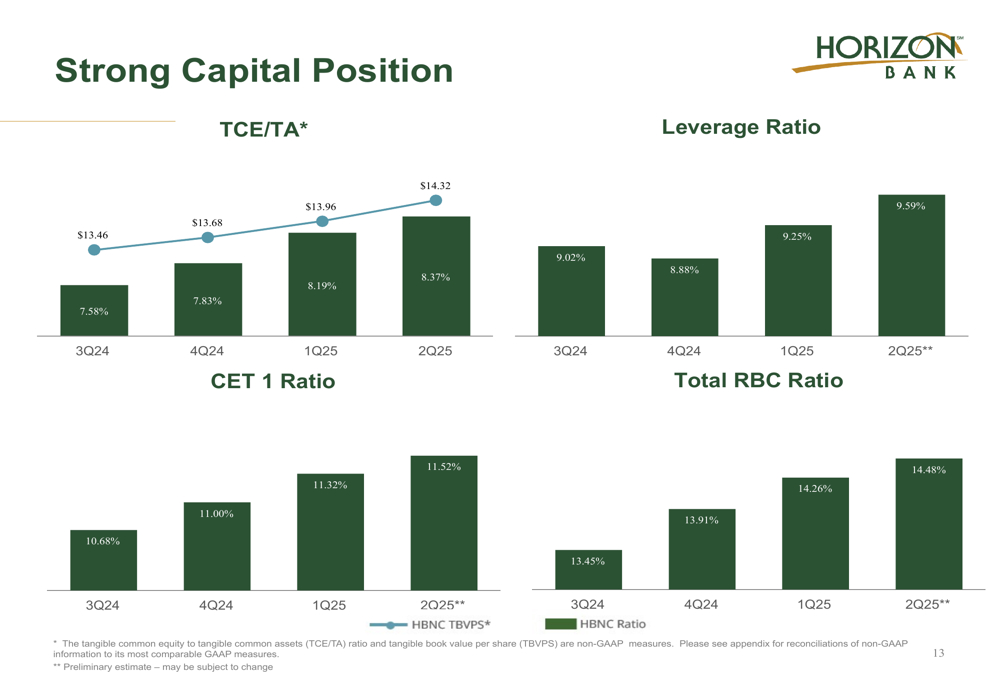
Horizon maintained a strong capital position in Q2 2025, with improving metrics across all key ratios. The bank’s TCE/TA ratio increased to 8.37% from 7.58% in Q3 2024, while its CET 1 ratio improved to 11.52% from 10.68% over the same period.
The following chart illustrates Horizon’s strengthening capital position:
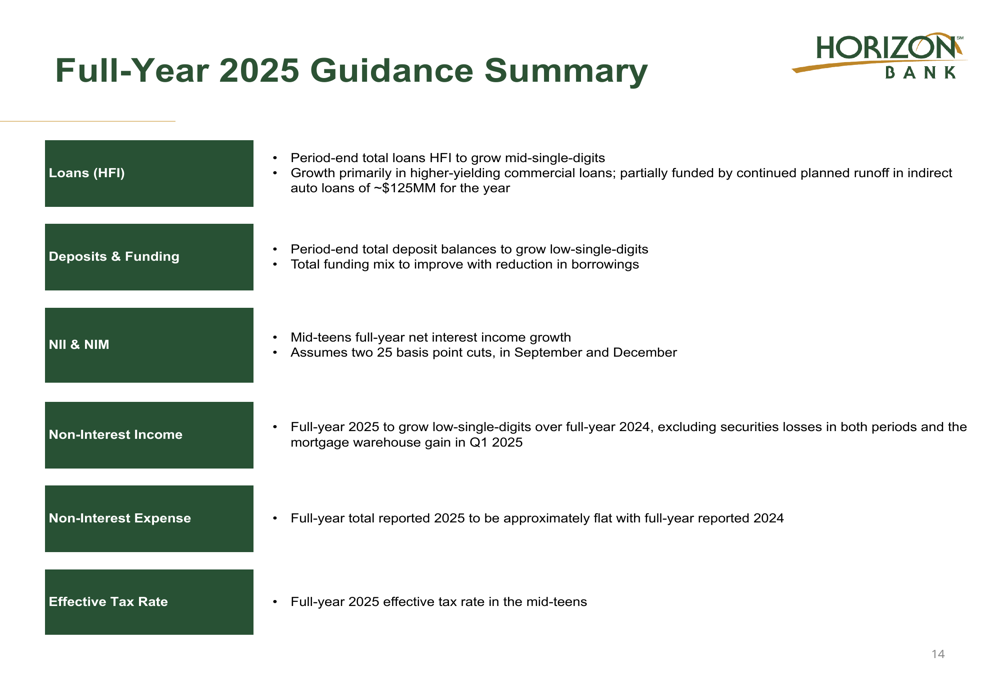
Looking ahead, Horizon provided full-year 2025 guidance that includes:
- Mid-single-digit loan growth, primarily in higher-yielding commercial loans
- Low-single-digit deposit growth with improved funding mix
- Mid-teens net interest income growth
- Low-single-digit non-interest income growth (excluding securities losses and one-time gains)
- Flat non-interest expenses compared to 2024
- Effective tax rate in the mid-teens
The guidance assumes two 25 basis point interest rate cuts by the Federal Reserve in September and December 2025, aligning with broader market expectations for monetary policy easing.
Horizon’s strategic focus remains on its core Midwestern markets, where it continues to leverage its relationship-based banking model to drive quality loan growth while maintaining strong credit standards. The bank’s improving margin and capital position provide a solid foundation for navigating the evolving interest rate environment through the remainder of 2025.
Full presentation:
This article was generated with the support of AI and reviewed by an editor. For more information see our T&C.