Novo Nordisk, Eli Lilly fall after Trump comments on weight loss drug pricing

Introduction & Market Context
HP Inc (NYSE:HPQ) reported its third-quarter fiscal year 2025 results on August 27, showing modest revenue growth and earnings within the company’s previously provided guidance range. The technology giant posted a 3% year-over-year revenue increase, driven primarily by strength in its Personal Systems segment, while the Printing business continued to face headwinds.
The company’s stock showed a slight positive reaction in aftermarket trading, rising 0.7% to $27.20, a notable improvement from the significant 12.61% drop following its Q2 results. This suggests investors may be gaining confidence in HP’s recovery trajectory and strategic initiatives, particularly around AI-powered devices.
Quarterly Performance Highlights
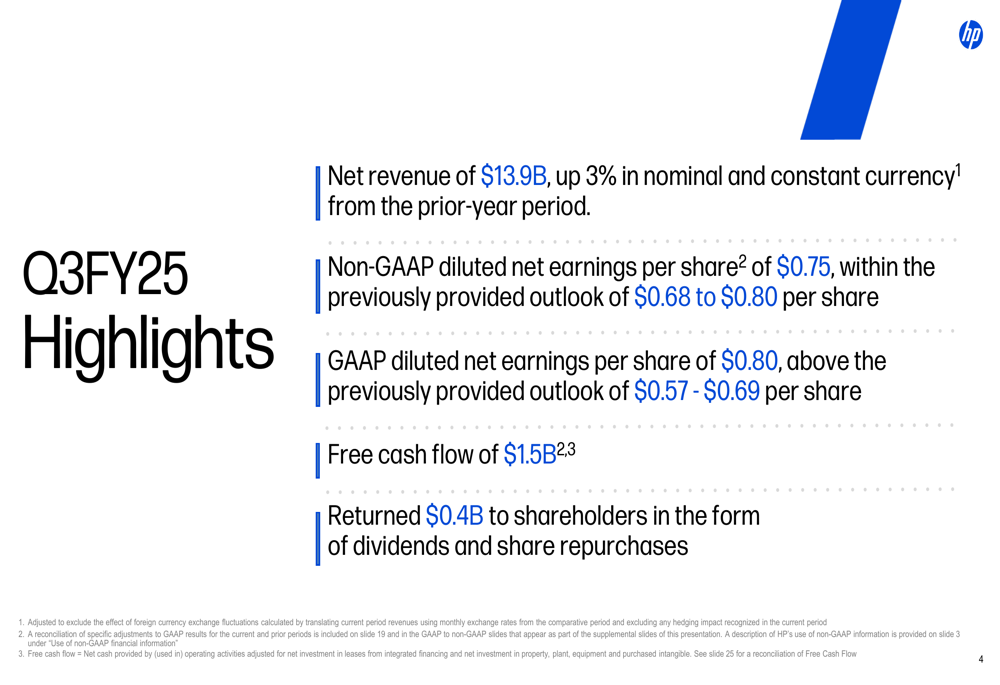
HP delivered $13.9 billion in net revenue for Q3 FY25, representing a 3% increase in both nominal and constant currency terms compared to the prior-year period. Non-GAAP diluted earnings per share came in at $0.75, within the company’s previously provided outlook range of $0.68 to $0.80 per share. GAAP diluted EPS exceeded expectations at $0.80, surpassing the outlook of $0.57 to $0.69 per share.
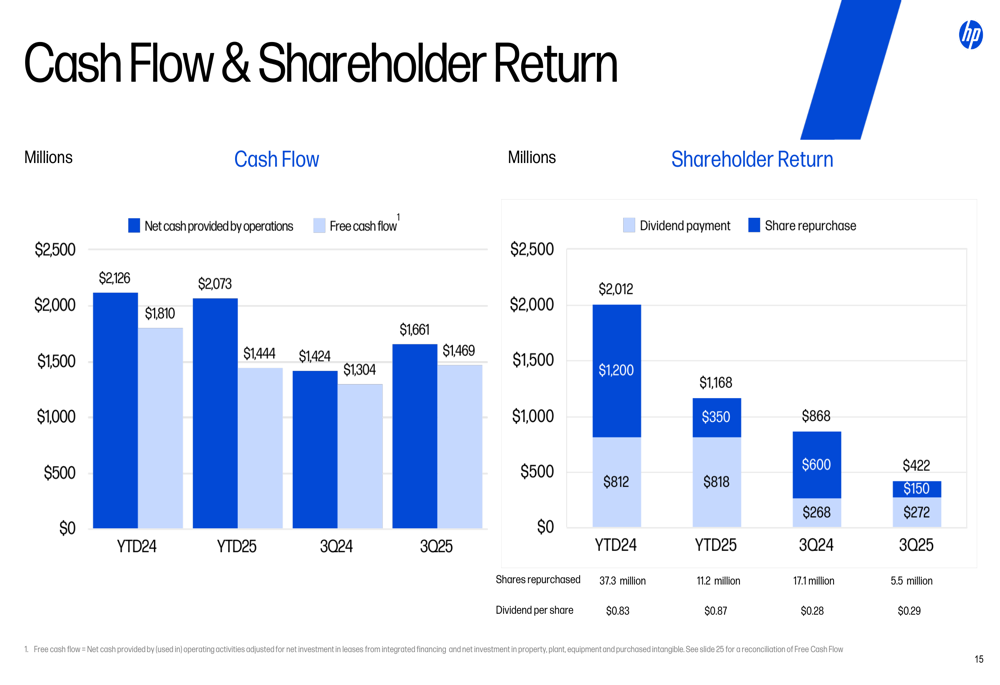
As shown in the following financial highlights slide, the company generated $1.5 billion in free cash flow and returned $0.4 billion to shareholders through dividends and share repurchases:
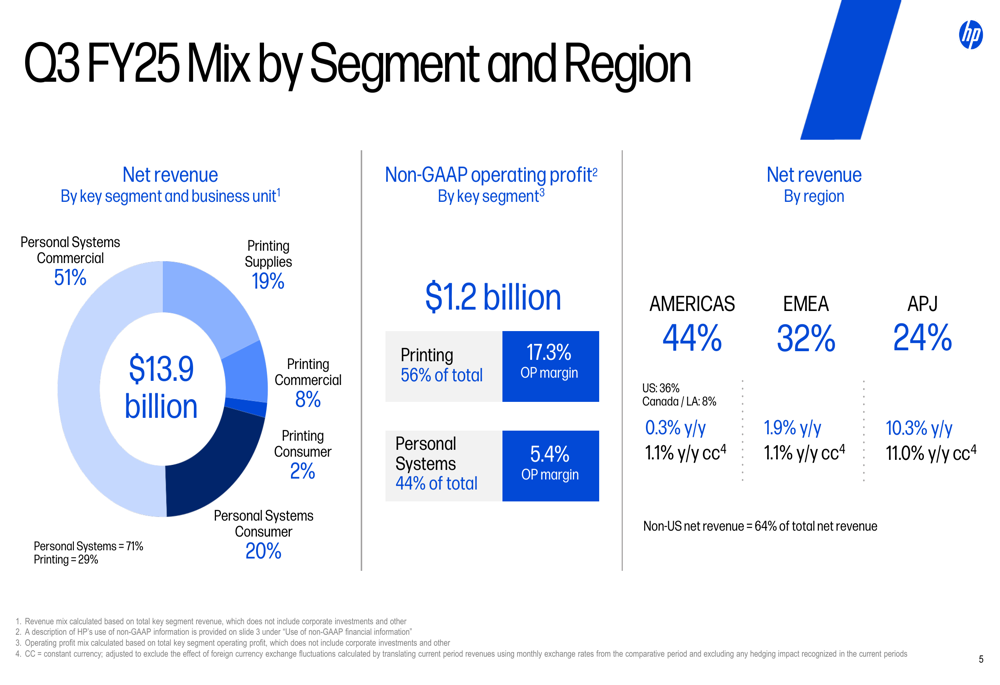
The company’s business mix continues to be dominated by Personal Systems, which accounted for 71% of total revenue, with Printing representing the remaining 29%. From a profitability standpoint, however, Printing contributed 56% of the total operating profit despite its smaller revenue share, highlighting its higher margin profile.
The following chart illustrates HP’s revenue and segment mix for the quarter:
Detailed Financial Analysis
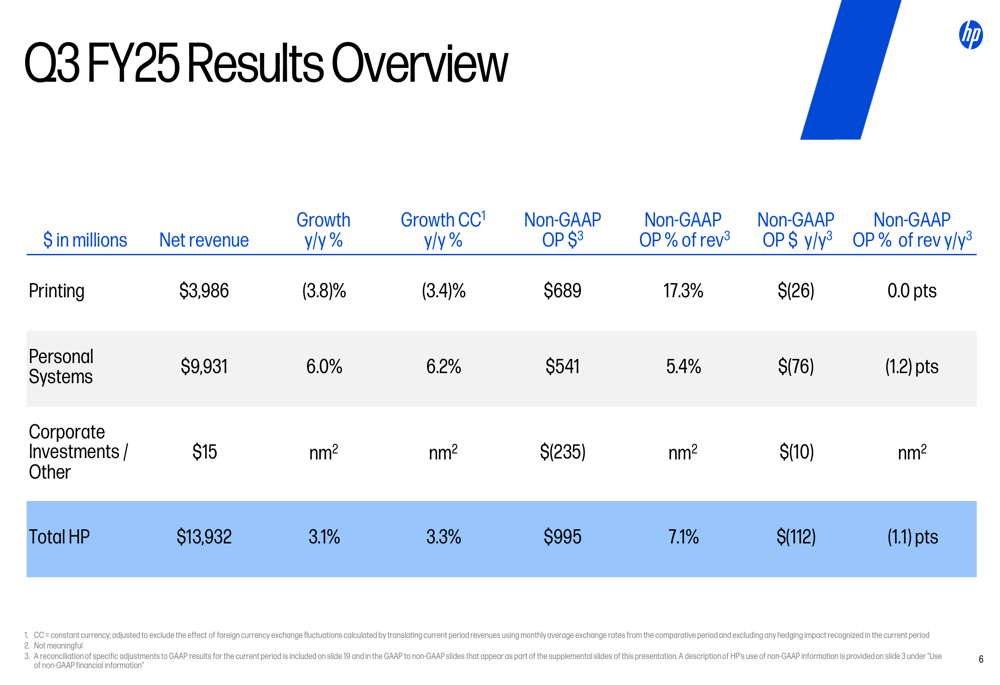
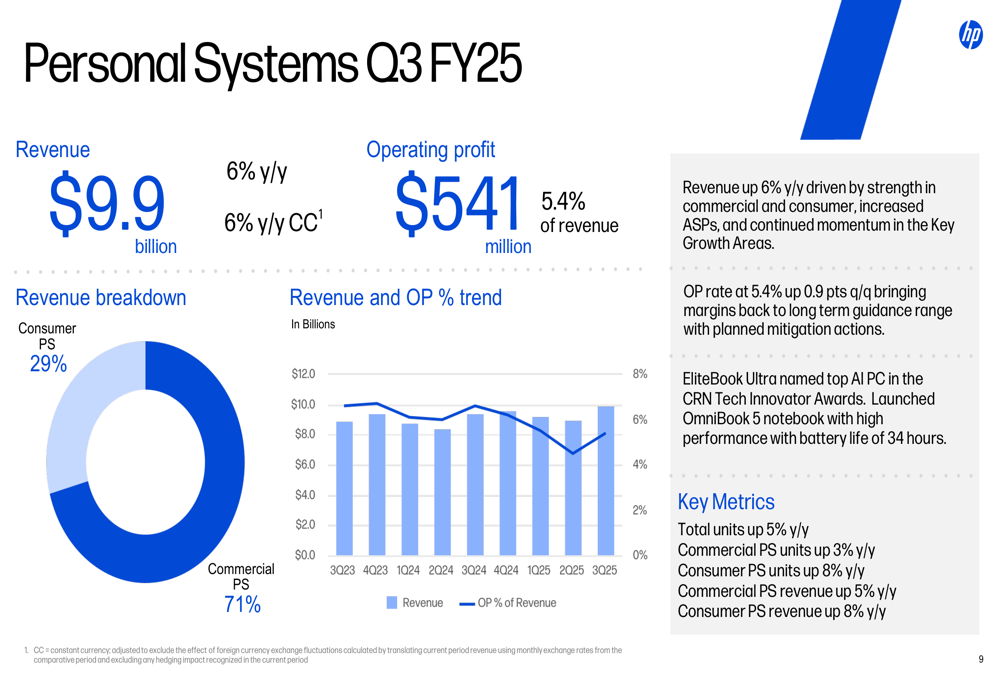
Breaking down the performance by segment, HP’s Personal Systems division showed solid growth with revenue of $9.9 billion, up 6.0% year-over-year (6.2% in constant currency). However, the segment’s operating profit declined by $76 million compared to the prior year, resulting in an operating margin of 5.4%.
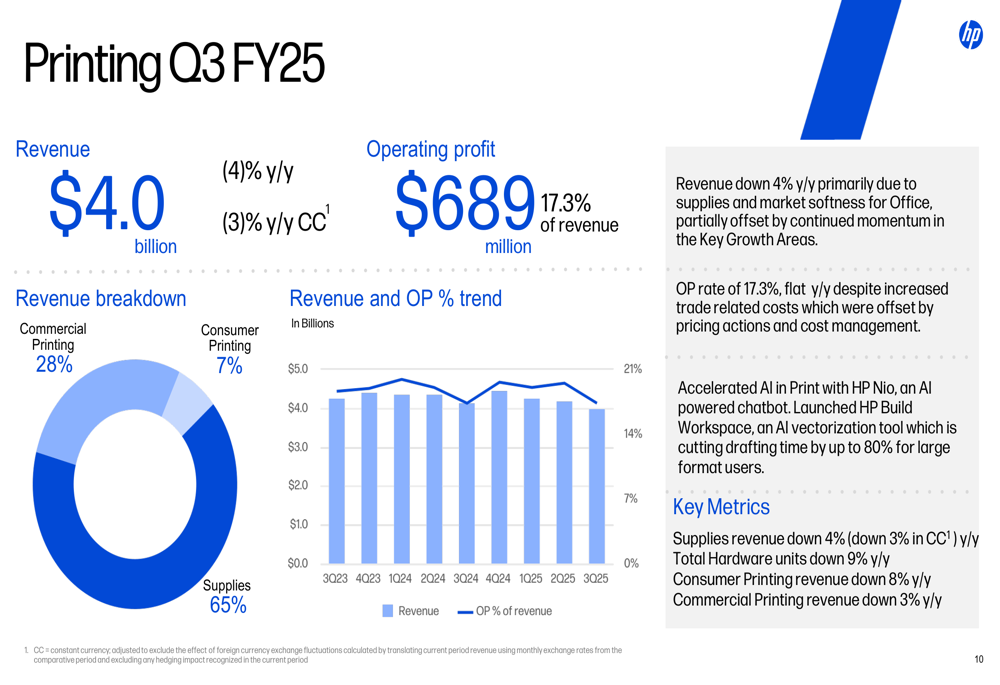
The Printing segment continued to face challenges with revenue of $4.0 billion, down 3.8% year-over-year (3.4% in constant currency). Operating profit for Printing was $689 million, representing a 17.3% margin but down $26 million from the previous year.
The following table provides a comprehensive overview of HP’s segment performance:
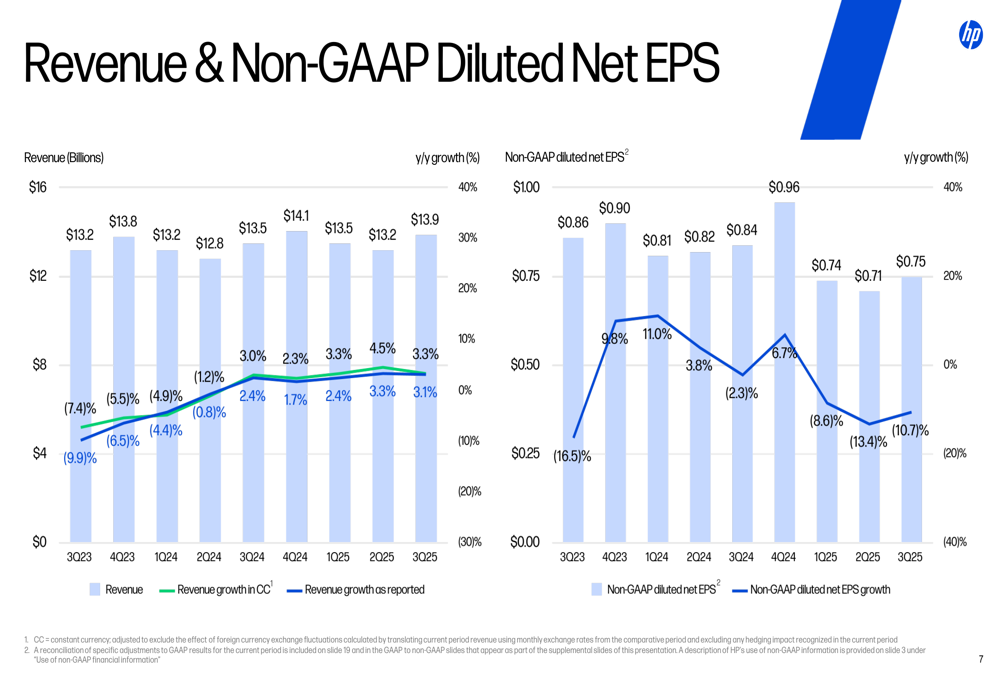
Looking at historical trends, HP’s revenue has been gradually recovering after several quarters of decline, while non-GAAP EPS has been more volatile, showing a year-over-year decline of 10.7% in the current quarter:
Segment Analysis
HP’s Personal Systems segment showed broad-based strength across both commercial and consumer markets. Total units increased by 5% year-over-year, with commercial units up 3% and consumer units growing by 8%. Revenue growth was similarly balanced, with commercial revenue up 5% and consumer revenue increasing by 8%.
The company highlighted its AI PC momentum, noting that these devices now represent over 25% of the PC mix, with double-digit sequential revenue growth. Product innovations like the EliteBook Ultra and OmniBook 5 with 34-hour battery life were featured as competitive differentiators.
The following slide details the Personal Systems performance:
The Printing segment continued to face structural challenges, with total hardware units declining by 9% year-over-year. Supplies revenue, which accounts for 65% of the segment’s revenue, decreased by 4% (3% in constant currency). Consumer printing revenue fell by 8%, while commercial printing revenue declined by 3%.
Despite these challenges, HP is focusing on innovation in the printing space, highlighting AI-powered solutions like HP Nio chatbot and HP Build Workspace, an AI vectorization tool:
Strategic Initiatives
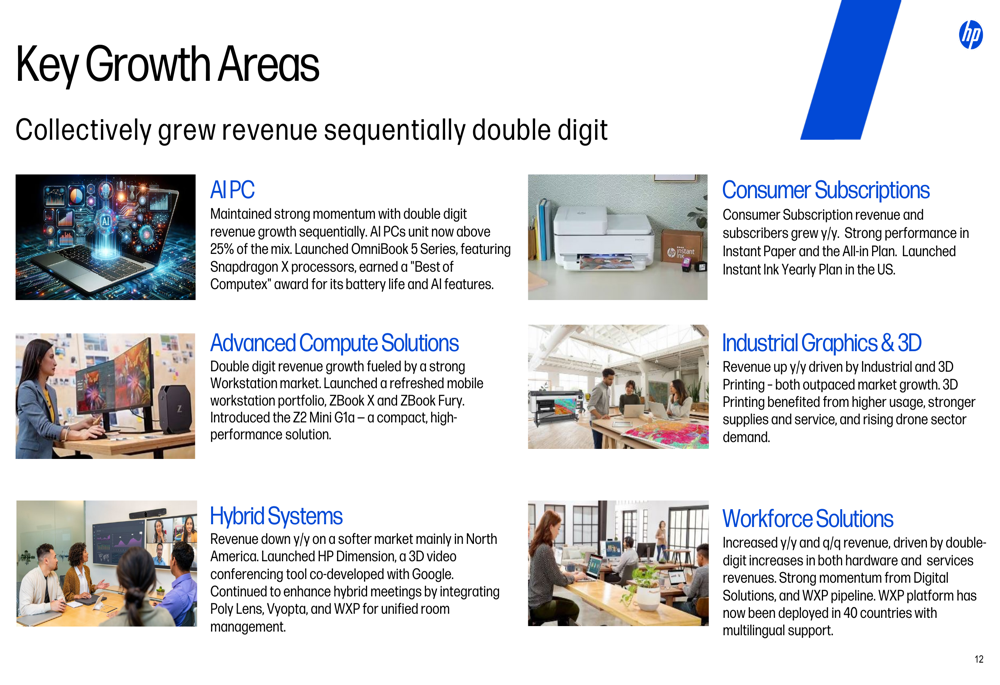
HP identified several key growth areas that are driving its strategic focus. AI PCs remain at the forefront, with the company reporting strong momentum and increasing mix. Advanced Compute Solutions showed double-digit revenue growth, fueled by strength in the Workstation market.
Other growth areas include Consumer Subscriptions, where both revenue and subscribers grew year-over-year, and Industrial Graphics & 3D, which saw revenue growth driven by Industrial and 3D Printing. The company’s Workforce Solutions also showed positive momentum with increased revenue both year-over-year and sequentially.
As shown in the following slide, HP is pursuing a diversified growth strategy across multiple segments:
Balance Sheet and Cash Flow
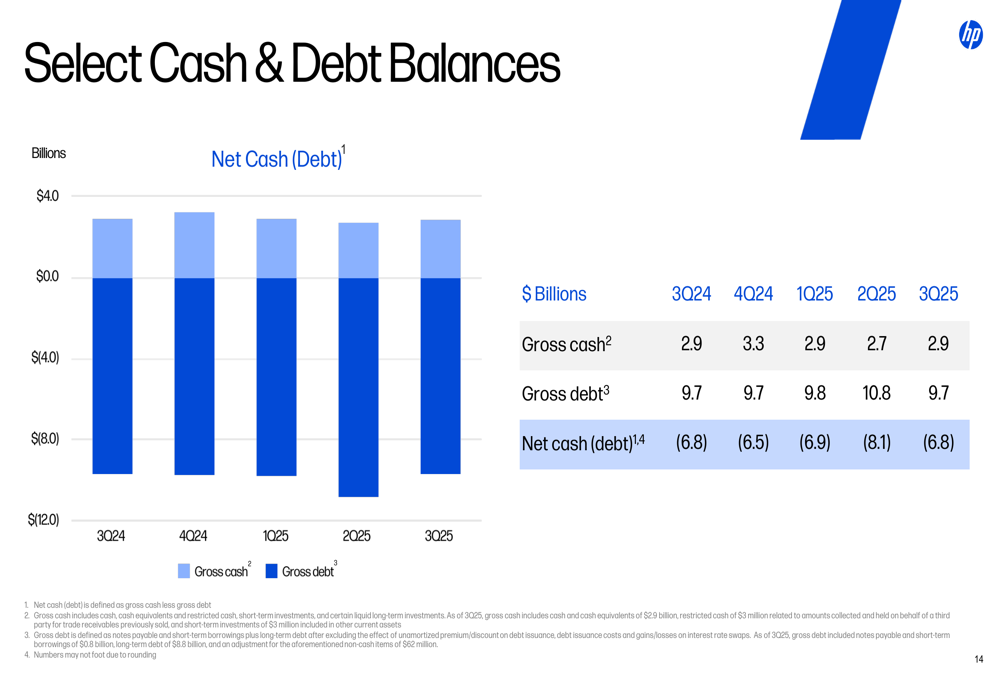
HP maintained a stable financial position with gross cash of $2.9 billion at the end of Q3 FY25, unchanged from the same period last year. Gross debt stood at $9.7 billion, resulting in a net debt position of $6.8 billion. The company’s debt position has fluctuated somewhat over recent quarters but remains at similar levels to the prior year.
The following chart illustrates HP’s cash and debt balances:
Cash flow generation remained strong with $1.5 billion in free cash flow for the quarter. Year-to-date, HP has generated $1.7 billion in free cash flow, down slightly from $1.8 billion in the comparable period last year. The company returned $0.4 billion to shareholders in Q3, including $0.3 billion in dividends and $0.1 billion in share repurchases. The quarterly dividend was $0.29 per share, up from $0.28 in the prior year.
The following slide details HP’s cash flow and shareholder return activities:
Forward-Looking Statements
Looking ahead to Q4 FY25, HP provided guidance for GAAP diluted net EPS of $0.75 to $0.85 and non-GAAP diluted net EPS of $0.87 to $0.97. For the full fiscal year 2025, the company expects free cash flow to be in the range of $2.6 billion to $3.0 billion.
The company also addressed the impact of tariffs on its business, providing a detailed breakdown by region and product category. HP is implementing various mitigation strategies, including building manufacturing capacity outside of China and forming government partnerships to navigate the complex trade environment.
The tariff situation remains a significant factor in HP’s outlook, with the company noting varying rates across different regions and product categories. China-originated products face the highest tariffs, ranging from 20% to 45% for computing products and 38%+ for printing products.
Conclusion
HP’s Q3 FY25 results show signs of stabilization and modest growth after several challenging quarters. The Personal Systems segment is leading the recovery, driven by strong AI PC adoption and balanced growth across commercial and consumer markets. While the Printing segment continues to face structural headwinds, the company is focusing on innovation and digital services to offset the decline in traditional hardware and supplies.
The company’s financial position remains solid with strong cash flow generation and consistent shareholder returns. Looking ahead, HP’s strategic focus on AI-powered devices, advanced computing solutions, and digital services positions it to navigate the evolving technology landscape, though tariffs and global trade dynamics remain significant challenges to monitor.
Full presentation:
This article was generated with the support of AI and reviewed by an editor. For more information see our T&C.