Oracle stock falls after report reveals thin margins in AI cloud business

Ingram Micro Holding Ltd (NYSE:INGM) delivered strong financial results in its Q2 2025 earnings presentation released on August 6, 2025, highlighting double-digit revenue growth and continued progress on its transformation into a platform business. The technology distributor reported net sales of $12.8 billion, up 10.2% year-over-year, while advancing its Xvantage digital platform strategy.
Quarterly Performance Highlights
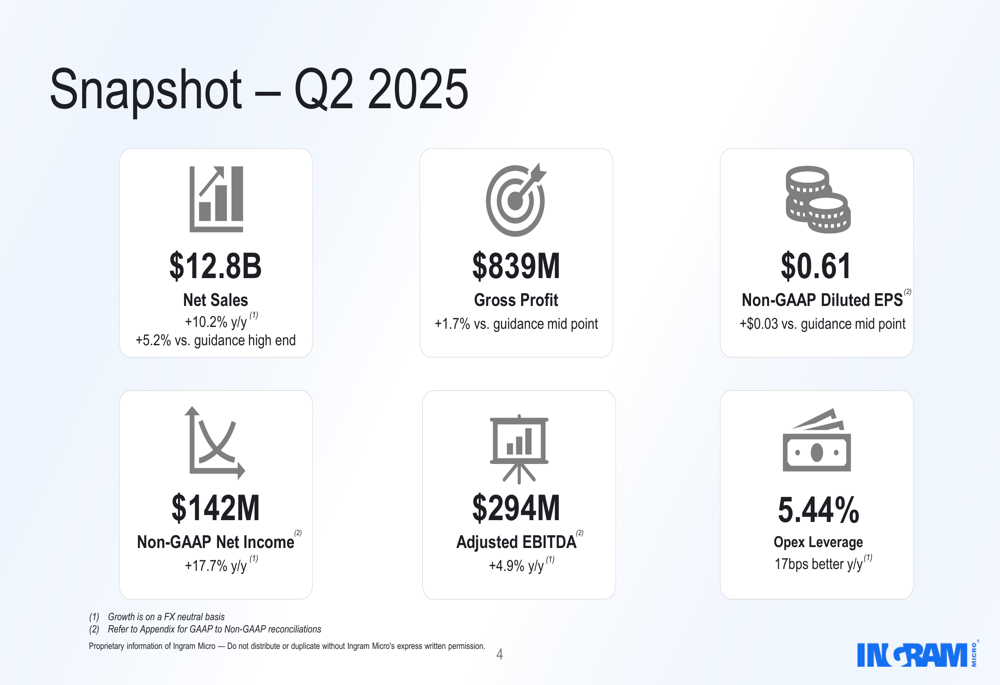
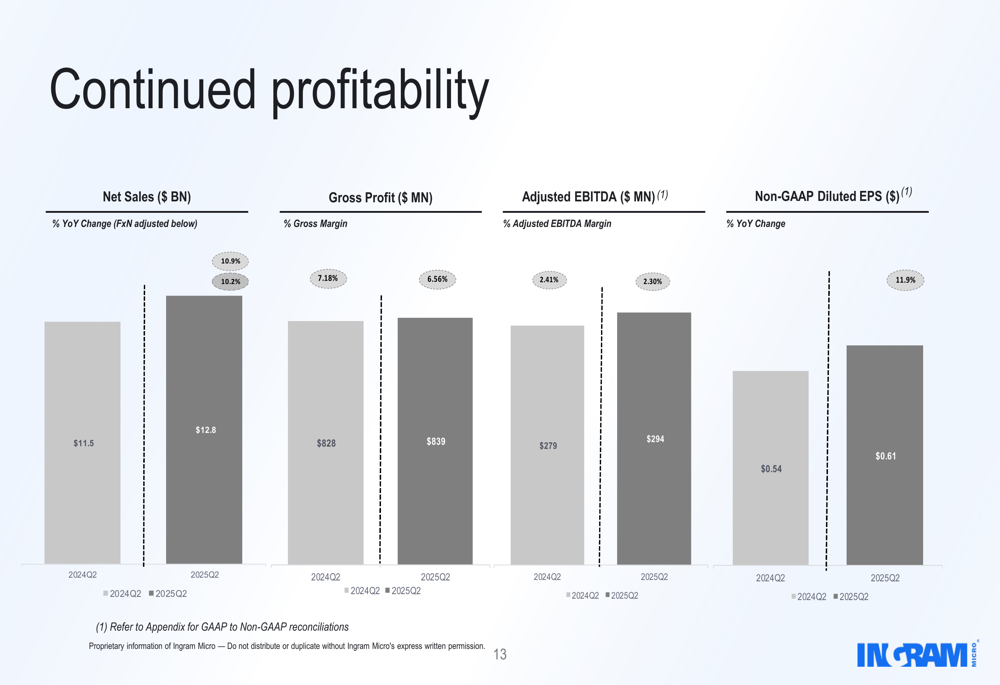
Ingram Micro reported solid financial metrics across the board for Q2 2025, exceeding guidance on several key indicators. Net sales reached $12.8 billion, representing a 10.2% year-over-year increase and surpassing the high end of guidance by 5.2%. Gross profit grew to $839 million, up 1.7% compared to the guidance midpoint.
The company’s non-GAAP diluted earnings per share came in at $0.61, exceeding the guidance midpoint by $0.03, while non-GAAP net income rose 17.7% year-over-year to $142 million. Adjusted EBITDA increased 4.9% to $294 million compared to the same period last year.
As shown in the following financial snapshot from the presentation, Ingram Micro demonstrated improved operational efficiency with operating expenses at 5.44% of net sales, a 17 basis point improvement year-over-year:
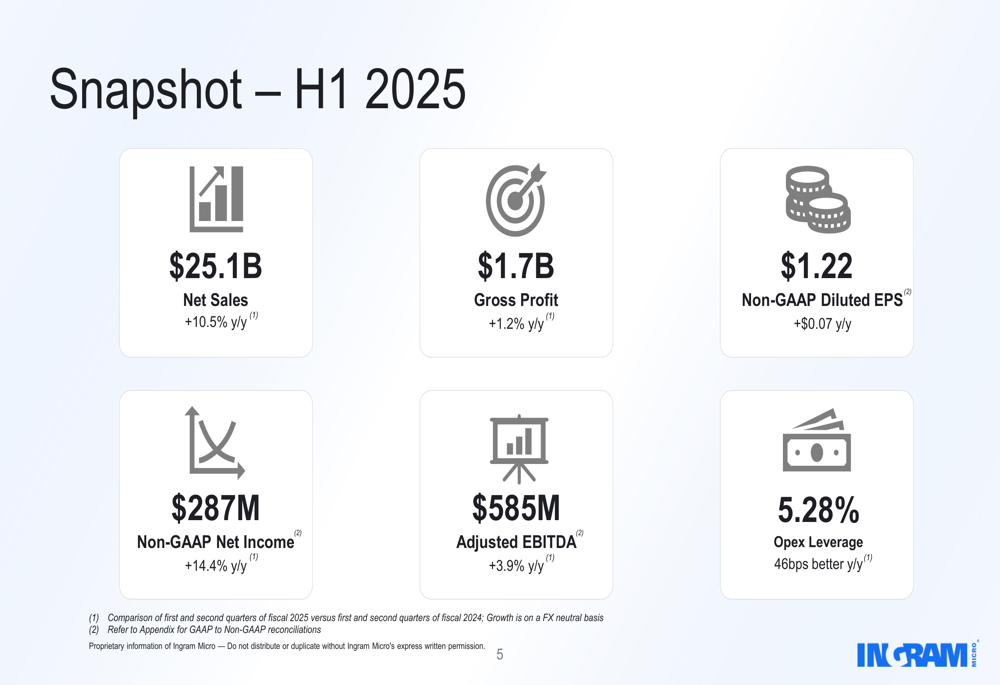
For the first half of 2025, Ingram Micro maintained its growth trajectory with net sales of $25.1 billion, up 10.5% year-over-year. H1 2025 non-GAAP net income reached $287 million, a 14.4% increase, while adjusted EBITDA grew 3.9% to $585 million. The company achieved significant operational leverage with operating expenses at 5.28% of net sales, a 46 basis point improvement compared to H1 2024.
The presentation highlighted particularly strong performance in Client and Endpoint solutions, with growth concentrated in lower-cost-to-serve and lower-margin geographies. While SMB customers returned to moderate growth, large enterprise customers grew at a faster pace.
Strategic Initiatives: Platform Business and AI
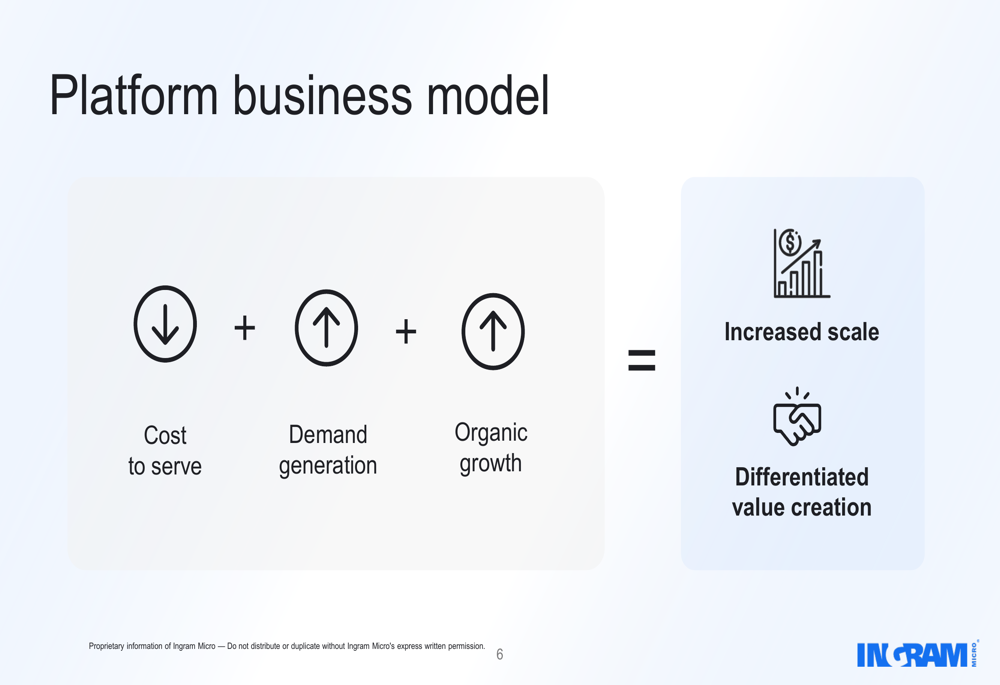
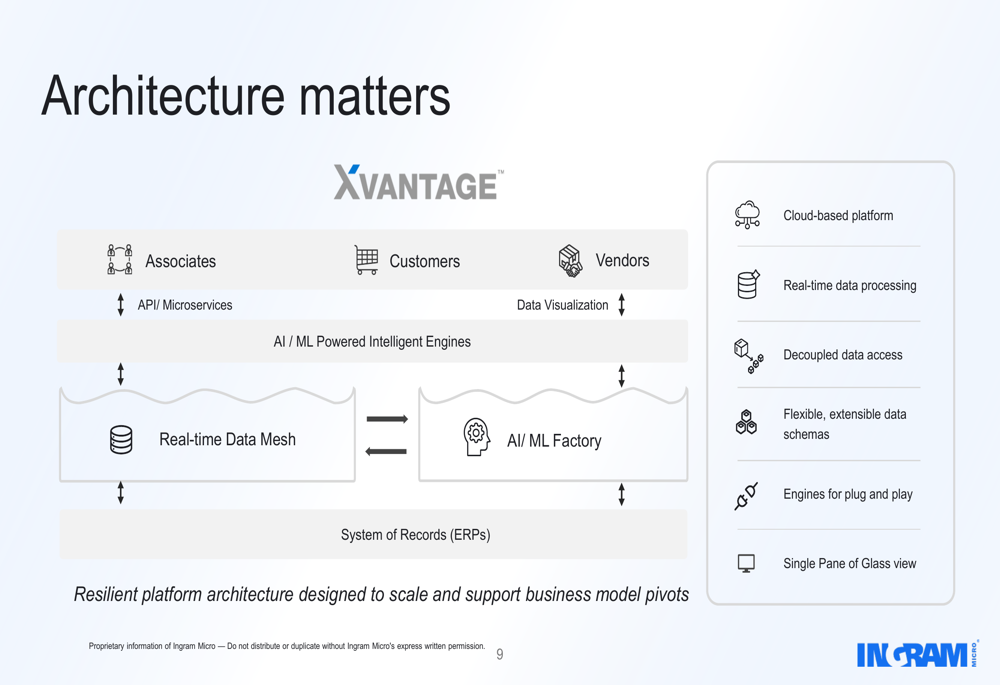
A central theme of Ingram Micro’s presentation was its ongoing transformation into a platform business through the Xvantage Digital Platform. The company outlined its platform business model, which aims to decrease cost to serve while increasing demand generation and organic growth to create differentiated value:
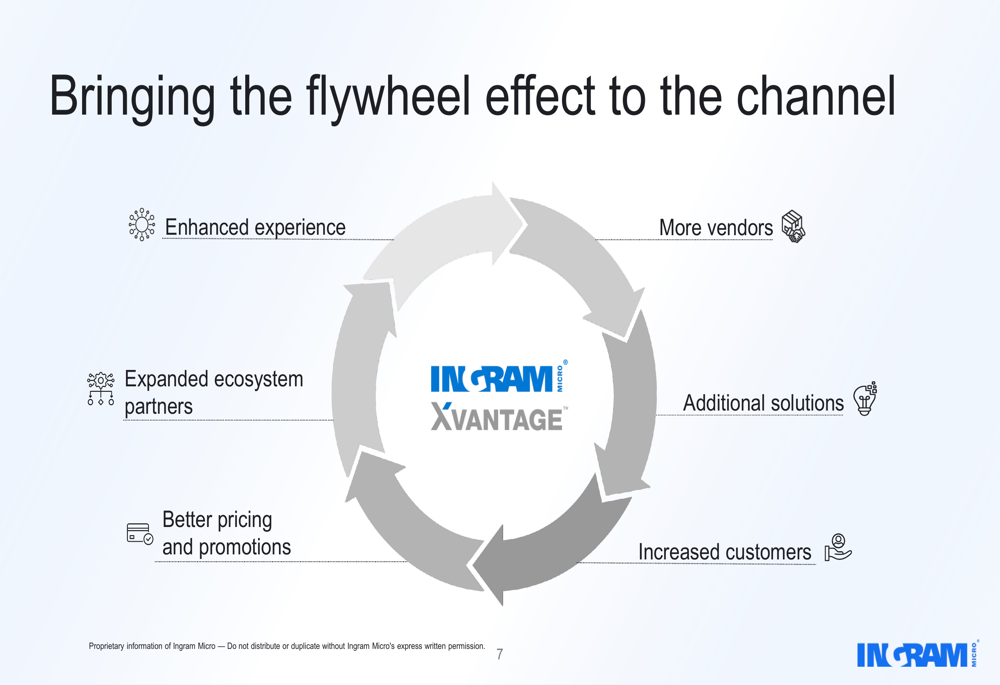
The company is leveraging what it calls a "flywheel effect" through its Xvantage platform, creating a positive feedback loop that connects vendors, customers, solutions, and pricing in an integrated ecosystem:
Artificial intelligence features prominently in Ingram Micro’s strategy, with the company implementing AI across multiple business functions. The presentation detailed how AI is being used to reimagine the B2B journey, from vendor onboarding and product data management to customer interactions, order management, and supply chain optimization:

The company emphasized the importance of its platform architecture, highlighting features such as cloud-based infrastructure, real-time data processing, flexible data schemas, and a "single pane of glass" view for users:
Geographic Revenue Distribution
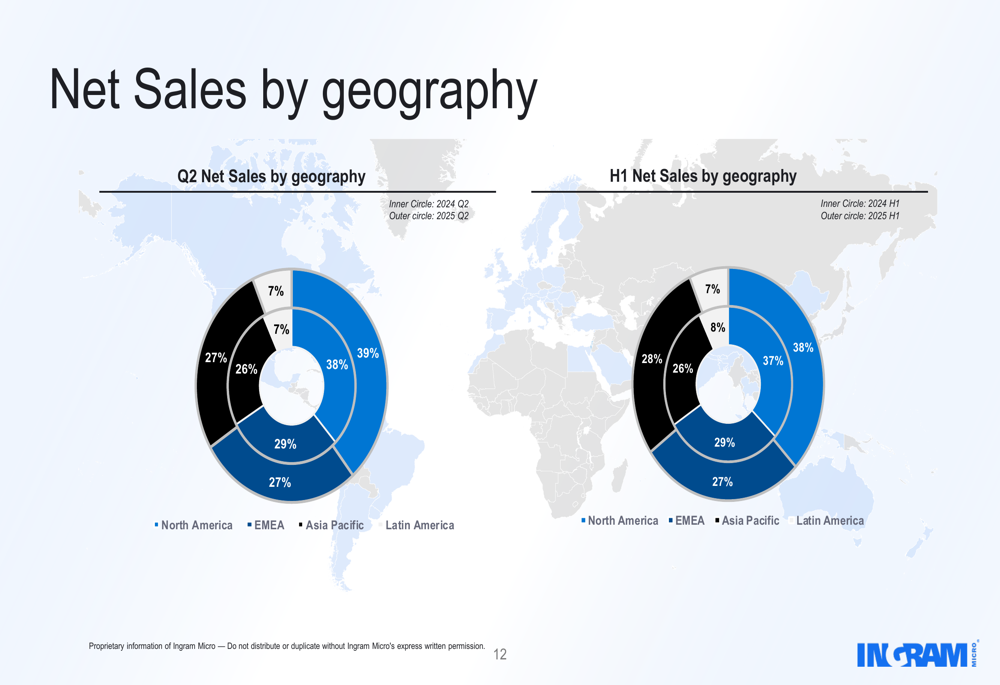
Ingram Micro’s revenue shows significant geographic diversification, with Latin America emerging as the largest contributor at 39% of Q2 2025 net sales, followed by North America (27%), EMEA (26%), and Asia Pacific (7%). This distribution reflects the company’s global reach and its growth in emerging markets:
The company’s profitability metrics show year-over-year improvements across key financial indicators, reinforcing the effectiveness of its strategic initiatives:
Financial Position and Forward Guidance
Ingram Micro maintains a strong balance sheet with $3.3 billion of available liquidity under its Revolving Credit Facility. The company’s leverage ratios remain manageable with total debt at 2.8x TTM Adjusted EBITDA and net debt at 2.2x TTM Adjusted EBITDA. During the quarter, Ingram Micro refinanced its Term Loan Credit Facility to reduce the interest rate by 50 basis points.
Looking ahead to Q3 2025, the company provided the following guidance:
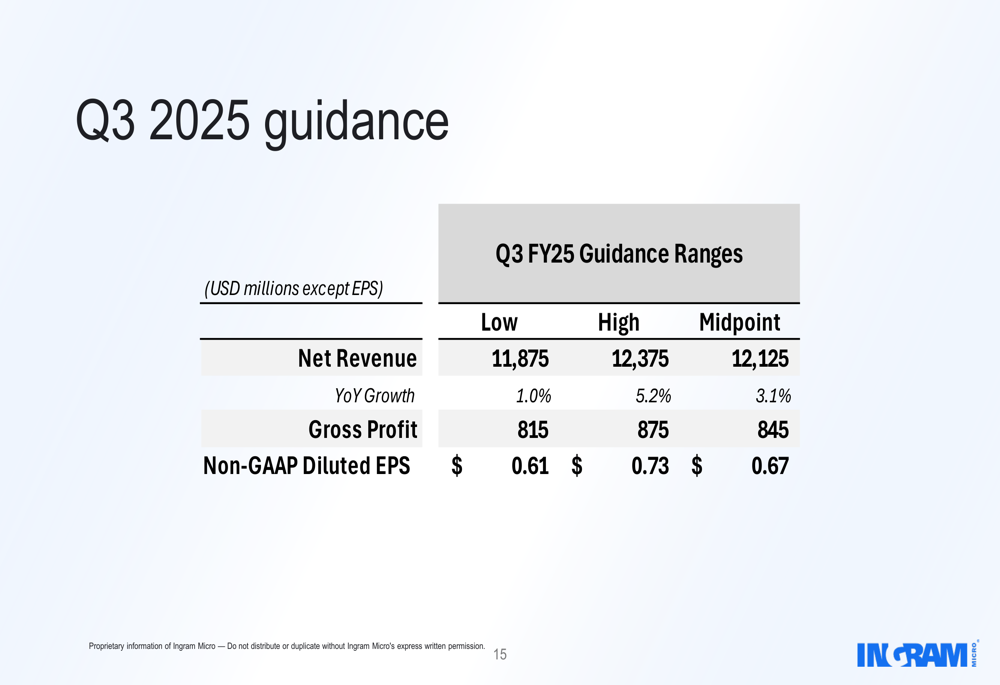
The guidance suggests continued growth but at a more moderate pace, with projected year-over-year revenue growth between 1.0% and 5.2% (midpoint 3.1%). Non-GAAP diluted EPS is expected to range from $0.61 to $0.73.
Market Context
Ingram Micro’s stock closed at $19.23 on August 6, 2025, down 2.03% for the day, but showed signs of recovery with a 1.4% gain to $19.50 in after-hours trading. The stock has been trading in a 52-week range of $14.25 to $25.69.
The Q2 results follow a solid Q1 2025, where the company reported similar revenue growth of 11% year-over-year but missed analyst EPS expectations. The consistent EPS of $0.61 in both Q1 and Q2 suggests stable performance, though the company continues to face challenges with relatively weak gross profit margins, which stood at 6.56% in Q2 2025 compared to 7.18% in Q2 2024.
Ingram Micro’s focus on its platform business model and AI integration appears to be yielding operational efficiencies, as evidenced by the reduction in operating expenses as a percentage of revenue. However, the modest growth in gross profit relative to revenue growth indicates ongoing margin pressures in the competitive technology distribution market.
Full presentation:
This article was generated with the support of AI and reviewed by an editor. For more information see our T&C.