Uber stock surges after Nvidia partnership announcement

Introduction & Market Context
InvenTrust Properties Corp (NYSE:IVT) released its Q2 2025 investor presentation on July 30, showcasing strong operational performance driven by its strategic focus on grocery-anchored retail centers in high-growth Sun Belt markets. The company’s stock closed at $27.36 on July 29, up 1.94% for the day, with after-hours trading showing a slight decline of 1.68% to $26.90.
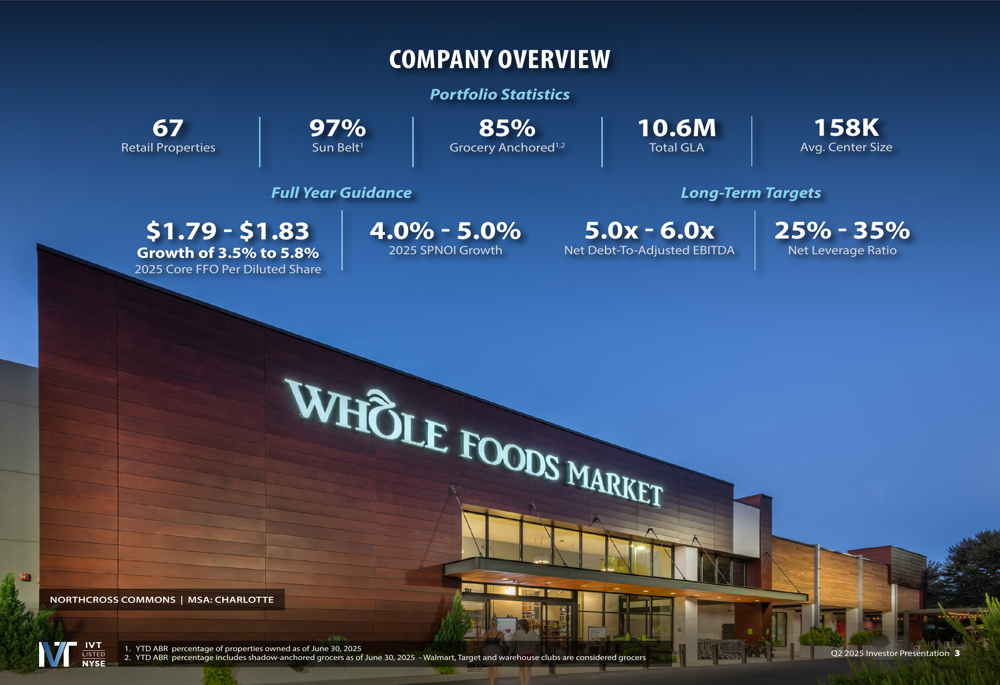
The presentation highlights InvenTrust’s portfolio of 67 retail properties, with 97% located in the Sun Belt region and 85% grocery-anchored. This strategic positioning aligns with favorable demographic trends, as the Sun Belt population growth is expected to substantially outpace the national average at 6.7% versus 0.5%.
Quarterly Performance Highlights
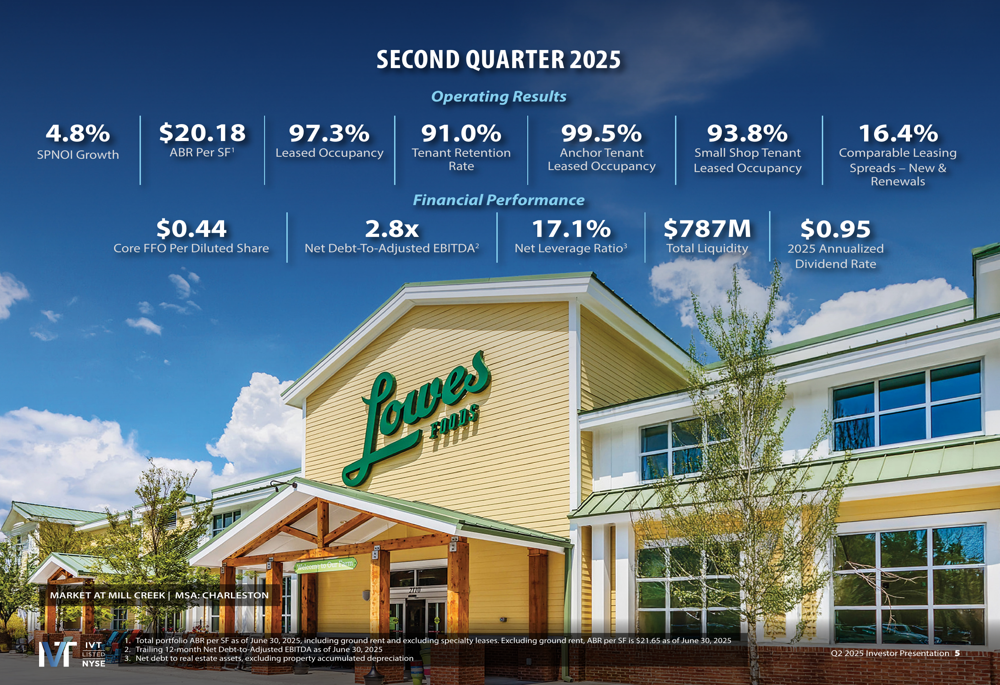
InvenTrust reported solid Q2 2025 results with same property net operating income (SPNOI) growth of 4.8%, exceeding the company’s full-year guidance range of 4.0% to 5.0%. The company achieved Core FFO per diluted share of $0.44, maintaining the momentum from Q1’s $0.46 per share reported earlier this year.
Operational metrics remained strong, with leased occupancy holding steady at 97.3%, including impressive anchor tenant occupancy of 99.5% and small shop occupancy of 93.8%. The company also reported robust leasing spreads of 16.4% for new leases and renewals combined, with a tenant retention rate of 91.0%.
Strategic Initiatives
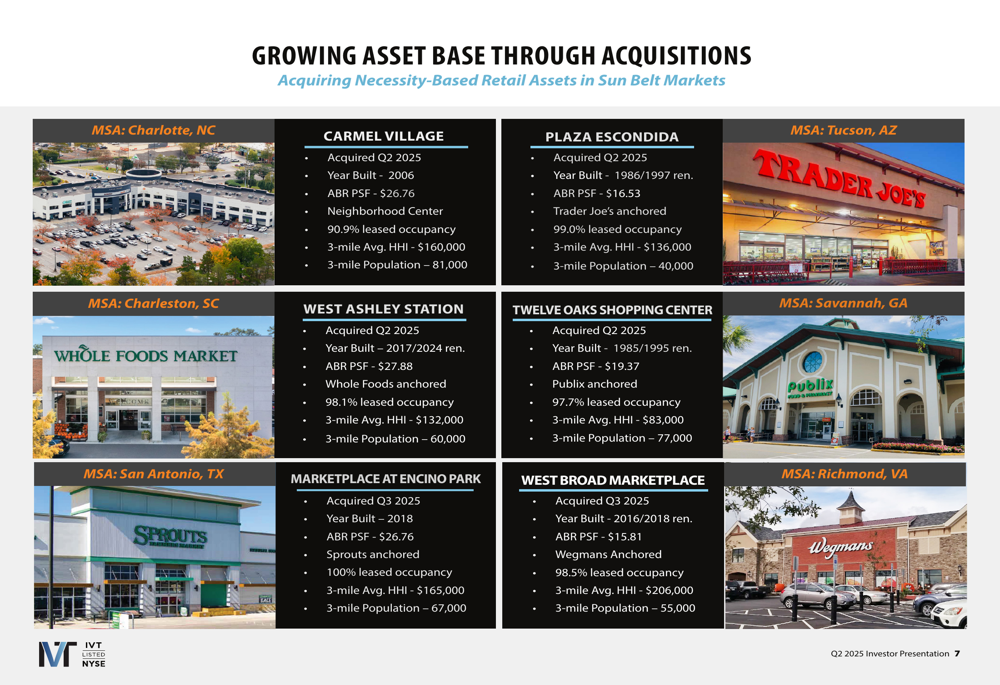
InvenTrust continues to execute its strategy of concentrating investments in high-growth Sun Belt markets while planning to exit its Southern California assets, which represented 9% of annualized base rent (ABR) as of March 31, 2025. The company is actively tracking over $1 billion in acquisition opportunities, focusing on open-air retail formats in target markets.
Recent acquisitions align with this strategy, including properties in Charlotte, NC; Tucson, AZ; Charleston, SC; Savannah, GA; San Antonio, TX; and Richmond, VA. These markets feature strong demographic profiles with above-average household incomes and population growth.
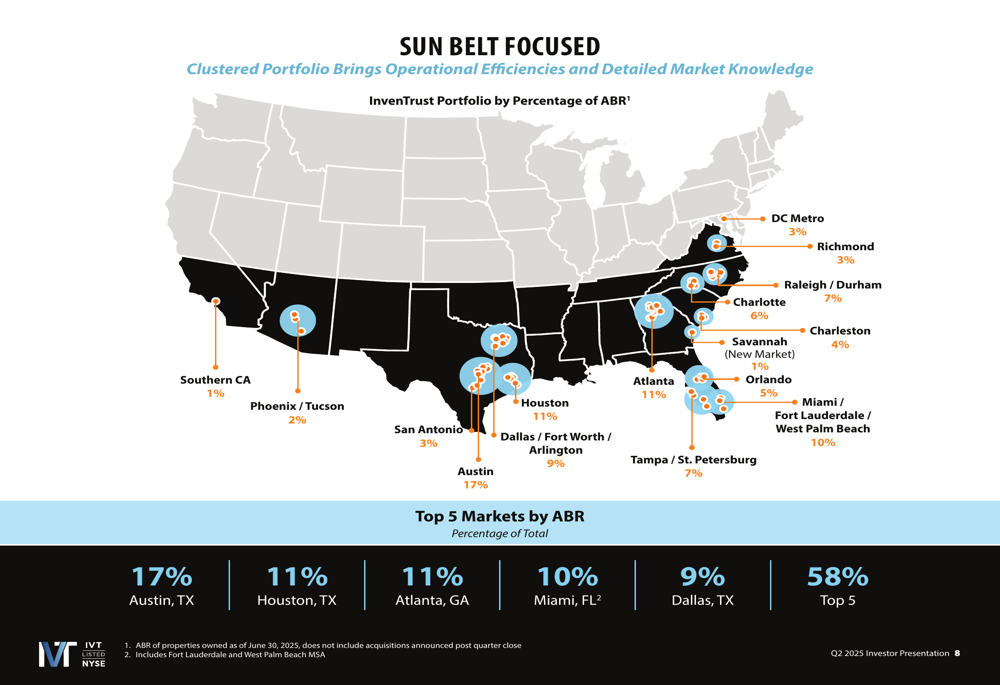
The company’s geographic concentration shows a strategic focus on five key markets that represent 58% of ABR: Austin (17%), Houston (11%), Atlanta (11%), Miami (10%), and Dallas (9%). This concentration enables operational efficiencies while maintaining exposure to diverse, high-growth metropolitan areas.
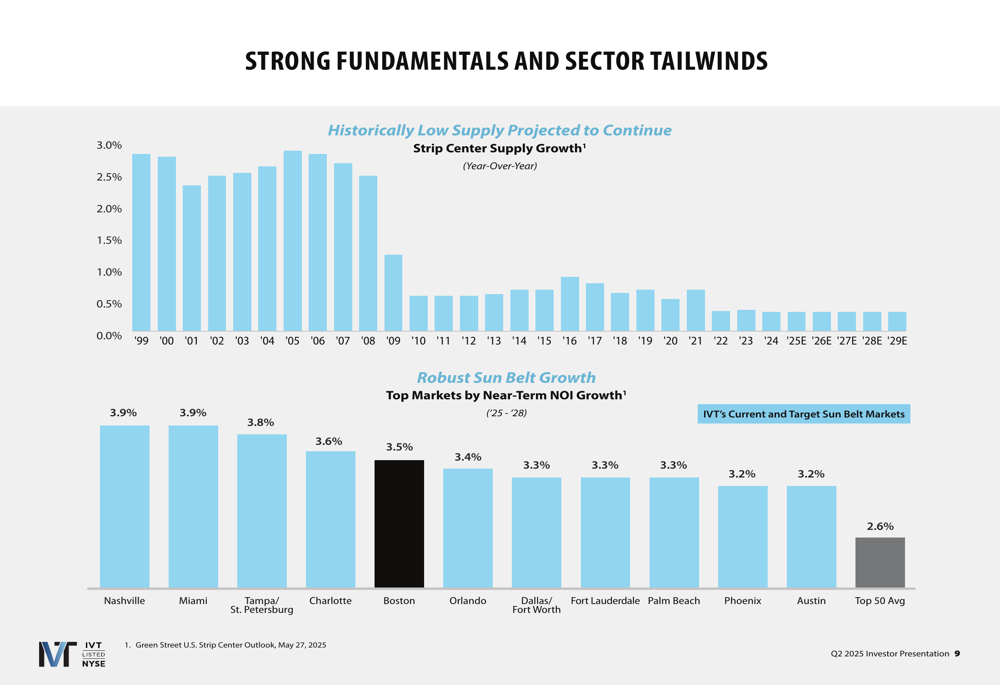
InvenTrust’s portfolio benefits from strong sector tailwinds, including historically low supply of new strip centers and favorable NOI growth projections in its target markets. The company’s presentation highlights that Tampa/St. Petersburg leads near-term NOI growth projections at 3.9%, with several Sun Belt markets outperforming traditional Northeast and Midwest locations.
Detailed Financial Analysis
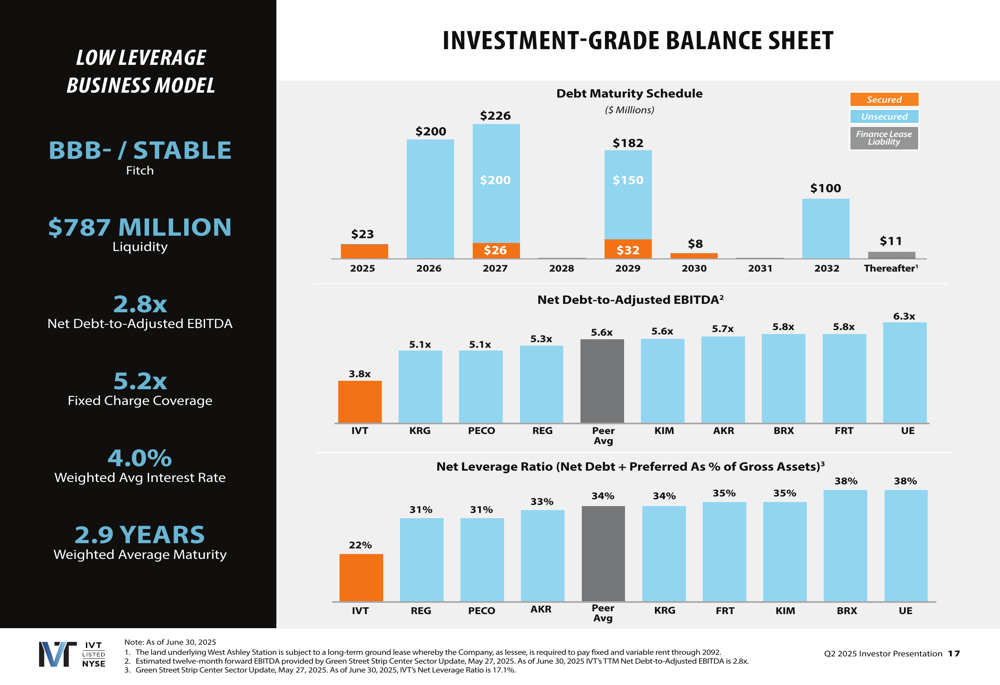
The company maintains a strong balance sheet with a Net Debt-to-Adjusted EBITDA ratio of 2.8x, well below its target range of 5.0x-6.0x, and a Net Leverage Ratio of 17.1%, below the target range of 25%-35%. Total (EPA:TTEF) liquidity stands at $787 million, providing ample flexibility for future acquisitions and development.
InvenTrust’s investment-grade balance sheet (Fitch rating:BBB-/Stable) compares favorably to peer REITs, with a well-structured debt maturity schedule that minimizes near-term refinancing risk. This disciplined approach to capital management supports the company’s growth initiatives while maintaining financial stability.
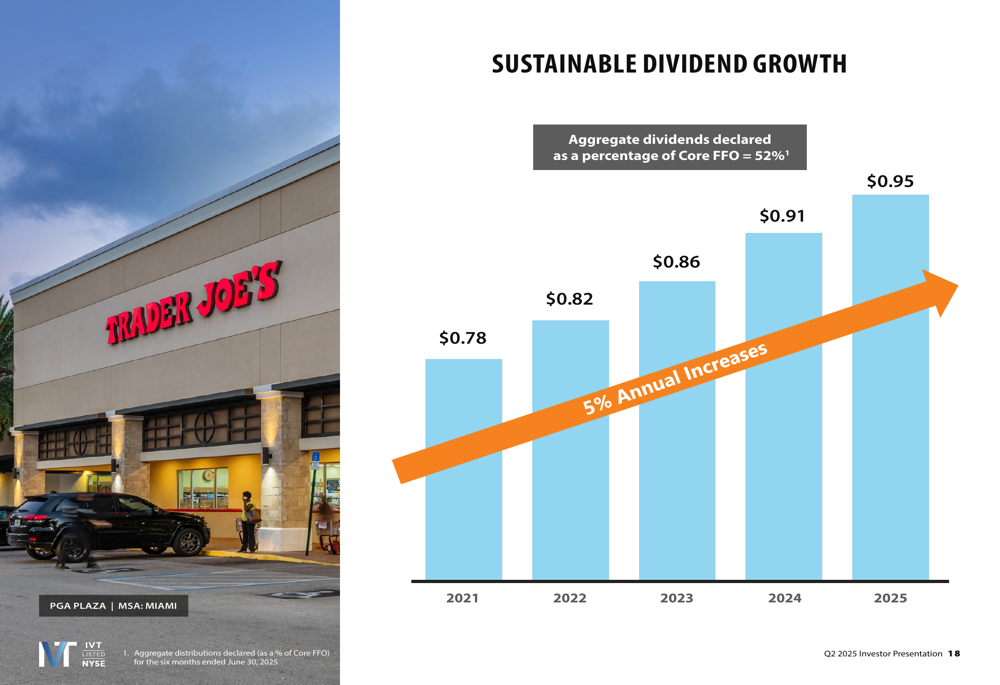
The company continues its track record of sustainable dividend growth, with an annualized dividend rate of $0.95 per share. Aggregate dividends declared represent approximately 52% of Core FFO, indicating room for future increases while maintaining a conservative payout ratio.
Portfolio Composition & Tenant Mix
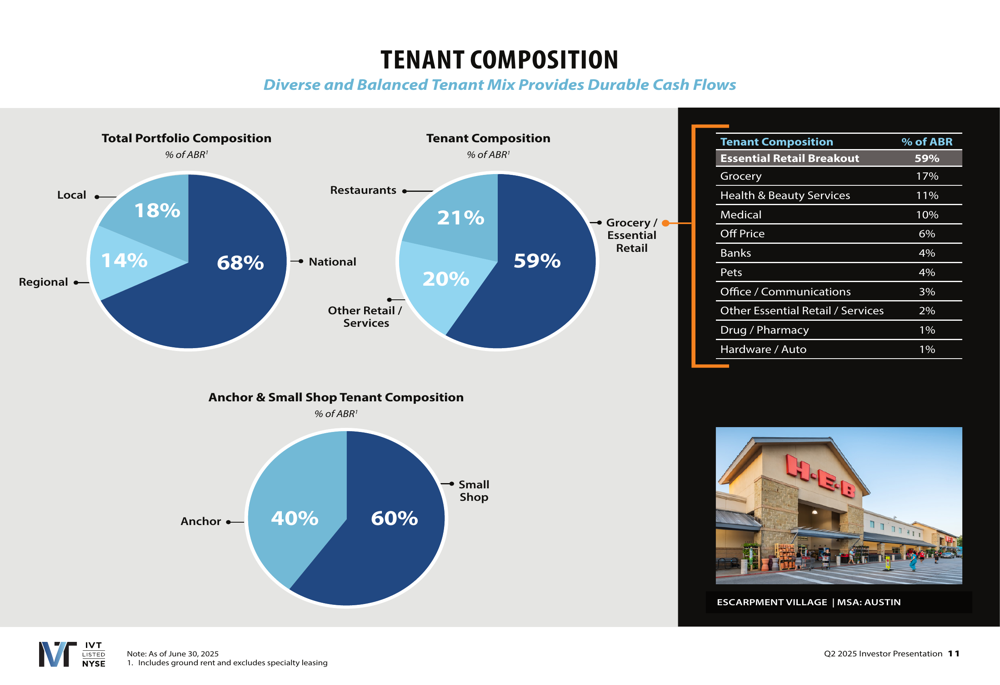
InvenTrust’s portfolio consists of high-quality, necessity-based retail centers across various formats, including neighborhood centers, community centers, and power centers. The company’s tenant composition is weighted toward national retailers (68%), with regional (14%) and local (18%) tenants providing diversification.
Essential retail represents 59% of the tenant mix, with grocery accounting for 17%, health and beauty services 11%, and medical 10%. This focus on necessity-based retail provides resilience against e-commerce disruption and economic cycles. Restaurants comprise 21% of the tenant mix, while other retail and services account for 20%.
The company’s top 10 tenants include strong credit-quality grocers and essential retailers such as Publix, Kroger (NYSE:KR), TJX (NYSE:TJX), Albertsons (NYSE:ACI), HEB, and Whole Foods Market. InvenTrust has also secured leases with desirable tenants including Trader Joe’s, Sephora, Nordstrom (NYSE:JWN) Rack, and Ulta, enhancing the appeal of its centers.
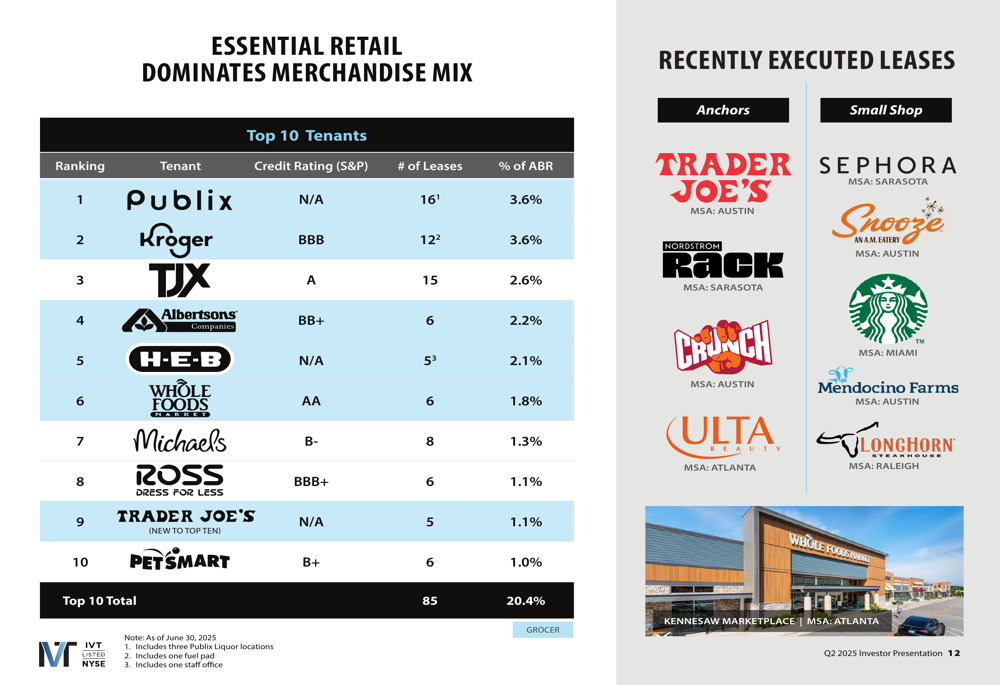
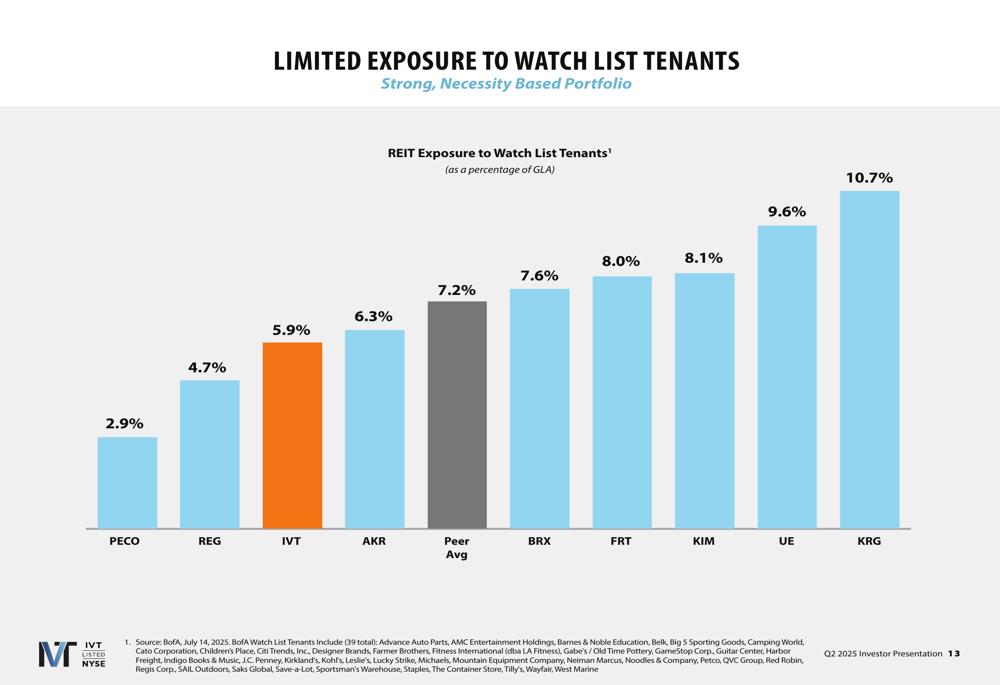
Notably, InvenTrust has limited exposure to watch list tenants compared to peer REITs, reducing potential vacancy risk and strengthening the stability of future cash flows.
Forward-Looking Statements
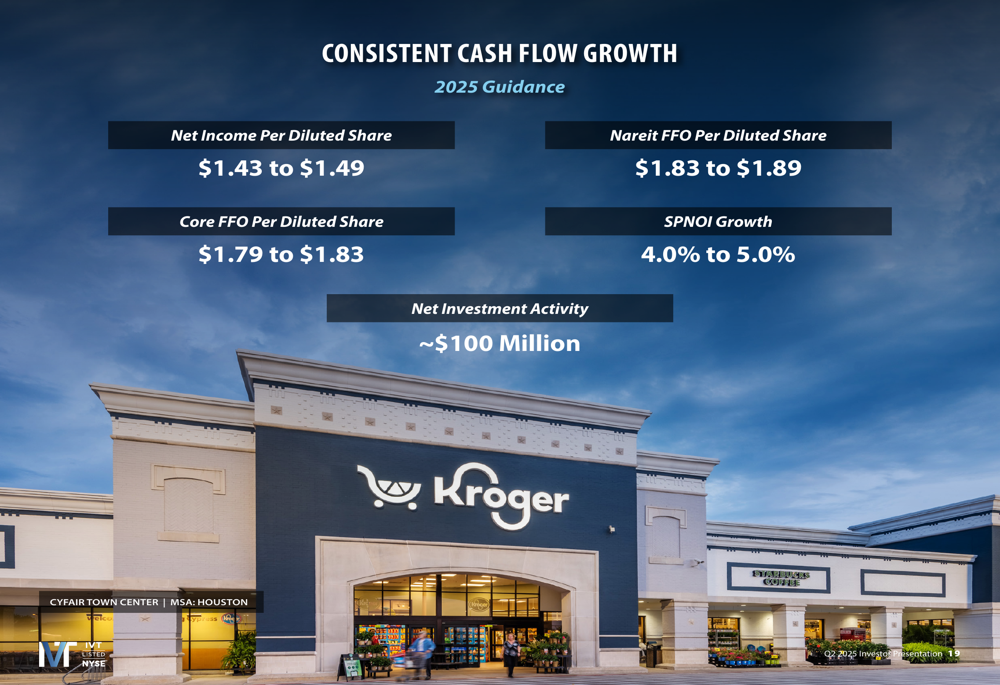
For full-year 2025, InvenTrust maintains guidance for Core FFO per diluted share of $1.79 to $1.83 and SPNOI growth of 4.0% to 5.0%. The company anticipates net investment activity of approximately $100 million, primarily focused on Sun Belt acquisitions.
InvenTrust’s redevelopment program targets yields between 7-10%, with active projects including Sandy Plains Centre, Sarasota Pavilion, Shops at Arbor Trails, and Buckhead Crossing. These initiatives are expected to enhance property values and drive future NOI growth.
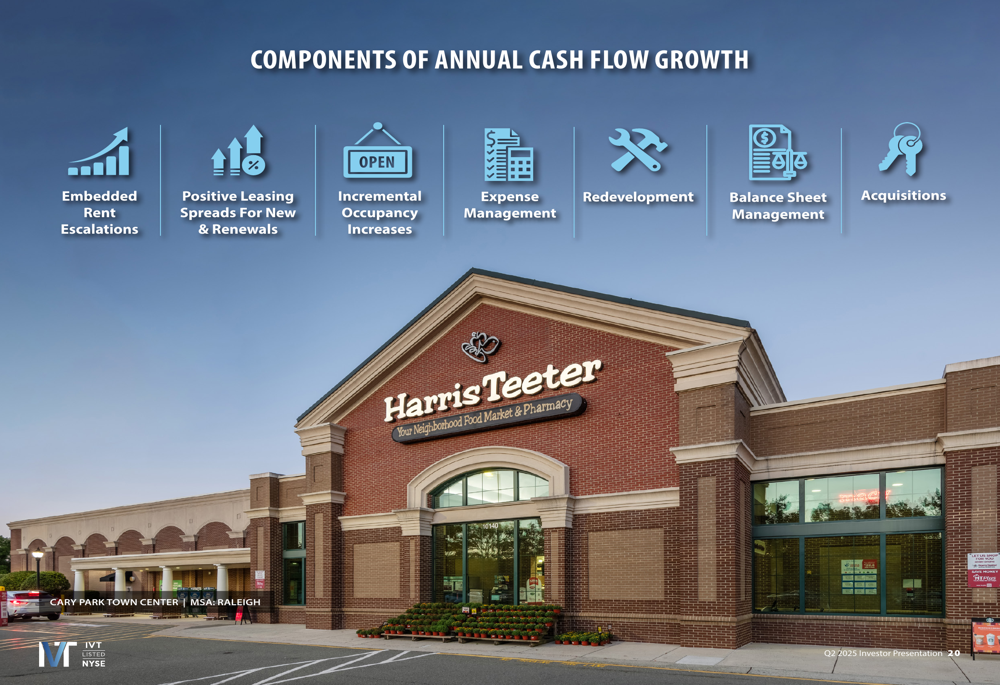
The company’s long-term strategy continues to focus on components that drive annual cash flow growth, including rent escalations, positive leasing spreads, incremental occupancy, expense management, redevelopment, balance sheet management, and strategic acquisitions.
InvenTrust’s Q2 2025 presentation reinforces the company’s position as a well-managed, strategically focused retail REIT with strong operational performance and a clear growth trajectory. The continued execution of its Sun Belt grocery-anchored strategy, combined with disciplined capital allocation and strong balance sheet management, positions the company well for sustainable growth in the evolving retail landscape.
Full presentation:
This article was generated with the support of AI and reviewed by an editor. For more information see our T&C.