U.S. futures subdued as government shutdown stretches into second week
Introduction & Market Context
JPMorgan Chase & Co (NYSE:JPM) released its second quarter 2025 financial results on July 15, showing continued strength across most business segments with net income reaching $15.0 billion and earnings per share (EPS) of $5.24. The banking giant’s shares closed at $288.70 on July 14 and showed a slight decline of 0.08% in premarket trading following the release.
The Q2 results build on JPMorgan’s strong performance from the first quarter, when the bank reported EPS of $5.07 against analyst forecasts of $4.62. The latest figures demonstrate the bank’s continued resilience in a challenging economic environment, with return on tangible common equity (ROTCE) holding steady at 21%.
Quarterly Performance Highlights
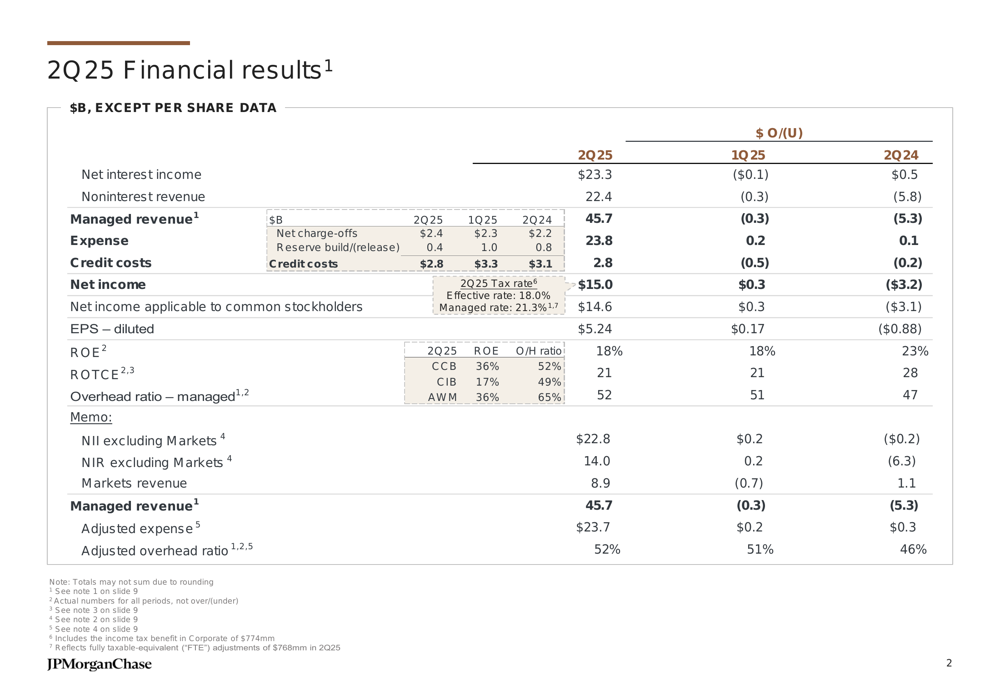
JPMorgan reported managed revenue of $45.7 billion for Q2 2025, with expenses of $23.8 billion resulting in a managed overhead ratio of 52%. The bank’s performance was bolstered by growth in average loans, which increased 5% year-over-year (YoY) to $1.4 trillion, and average deposits, which rose 6% YoY to $2.5 trillion.
As shown in the following comprehensive financial highlights:
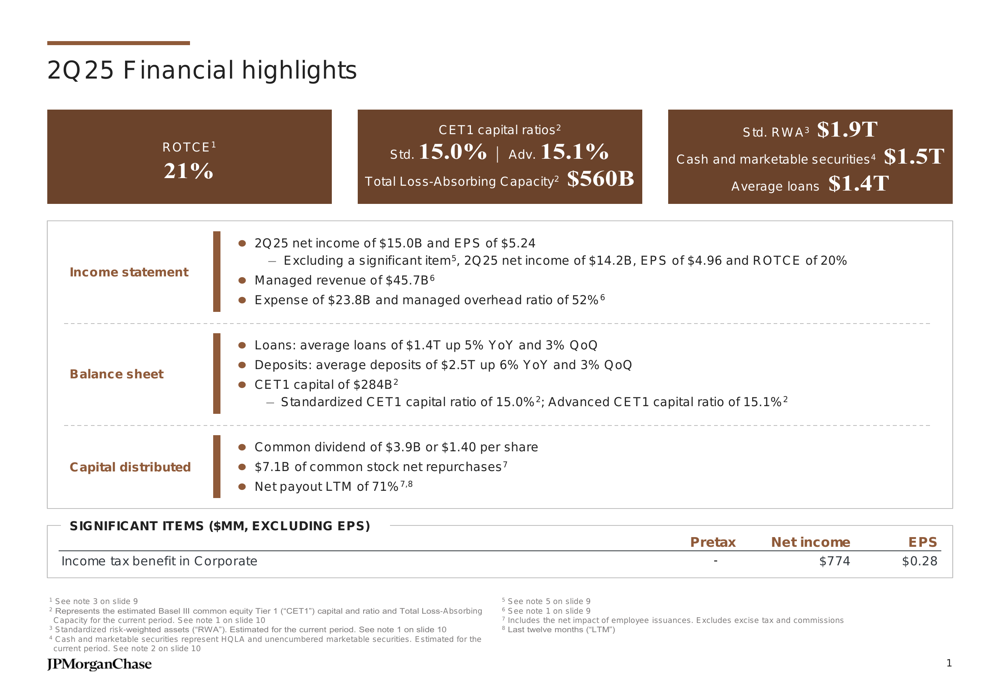
The bank’s capital distribution remained robust with common dividends of $3.9 billion ($1.40 per share) and $7.1 billion in common stock net repurchases, resulting in a net payout of 71% over the last twelve months.
A more detailed breakdown of the quarterly financial results shows the comparison with previous periods:
Detailed Financial Analysis
Consumer & Community Banking
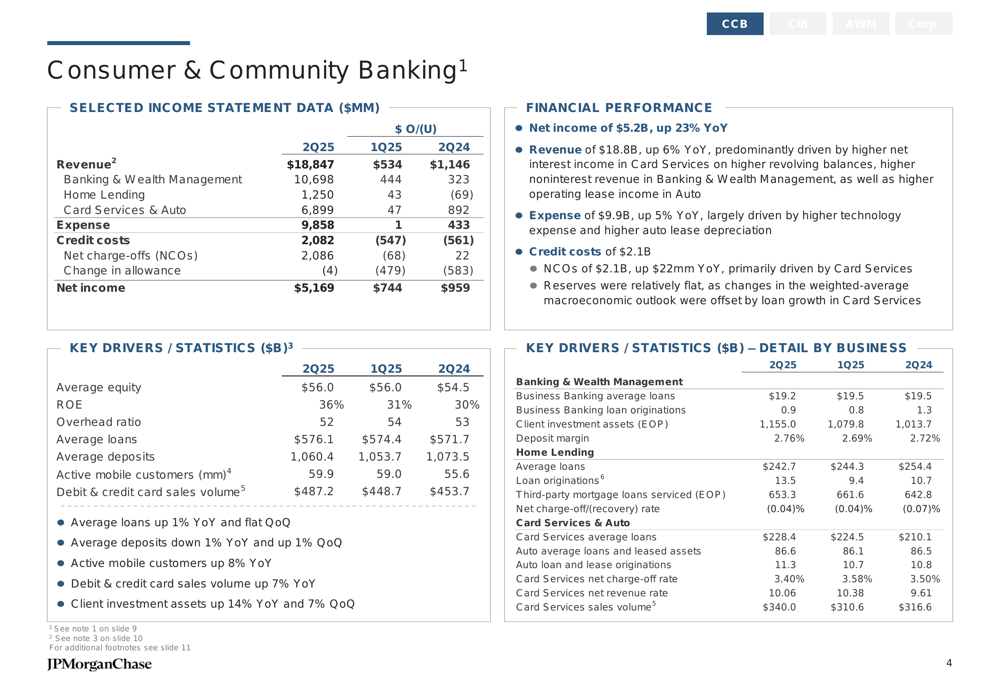
The Consumer & Community Banking (CCB) segment delivered impressive results with net income of $5.2 billion, up 23% YoY. Revenue increased 6% YoY to $18.8 billion, driven primarily by higher net interest income in Card Services from increased revolving balances, higher noninterest revenue in Banking & Wealth Management, and improved operating lease income in Auto.
The segment’s detailed performance metrics reveal strong fundamentals across its various business lines:
Commercial & Investment Bank
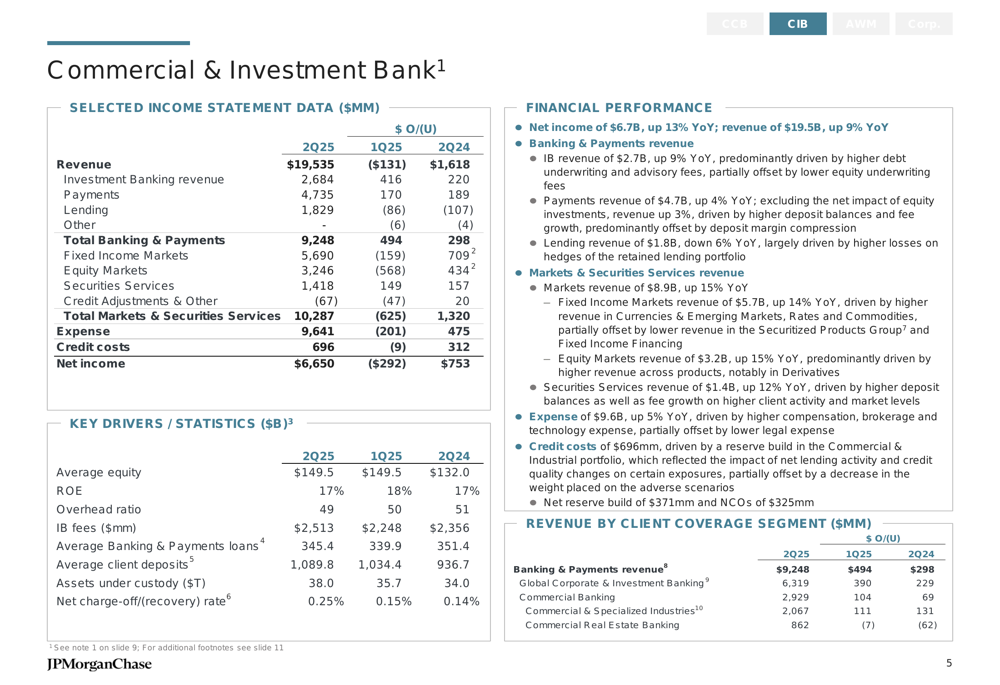
The Commercial & Investment Bank (CIB) segment also showed strong performance with net income of $6.7 billion, up 13% YoY, and revenue of $19.5 billion, representing a 9% increase YoY. The segment continues to be a significant contributor to JPMorgan’s overall profitability.
The following breakdown illustrates the CIB segment’s performance across different client coverage areas:
Asset & Wealth Management
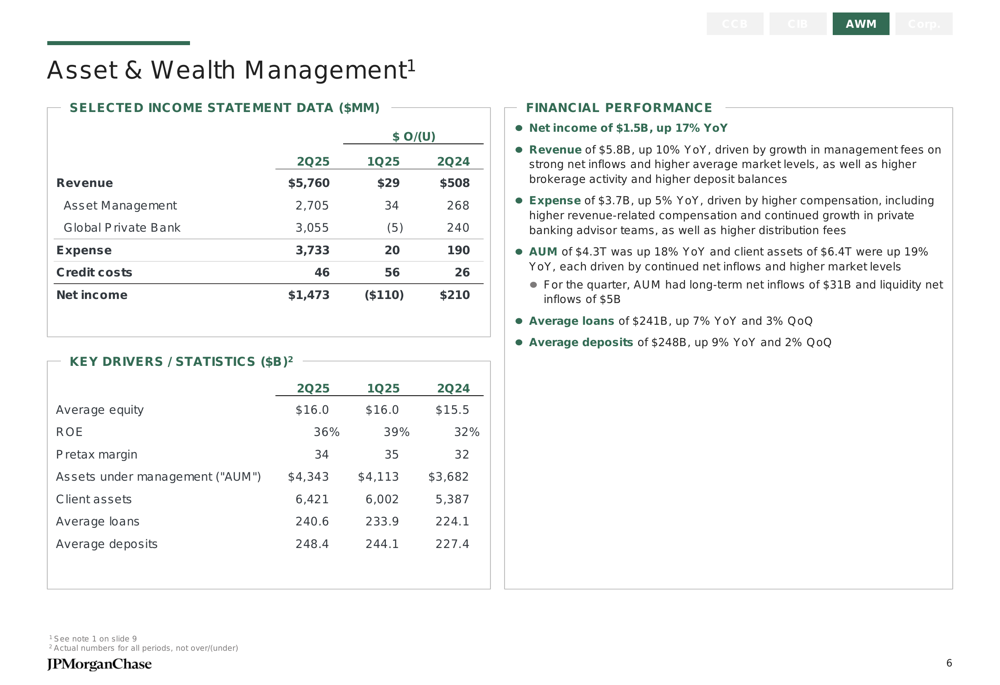
The Asset & Wealth Management segment reported net income of $1.5 billion, a 17% increase YoY, with revenue of $5.8 billion. Assets under management (AUM) reached $4.3 trillion, while the segment maintained a strong return on equity of 36%.
The segment’s financial performance is detailed in the following chart:
Corporate
The Corporate segment reported revenue of $1.5 billion, down $8.6 billion YoY, with net income of $1.7 billion. This segment typically includes treasury functions and corporate support units.
Fortress Balance Sheet
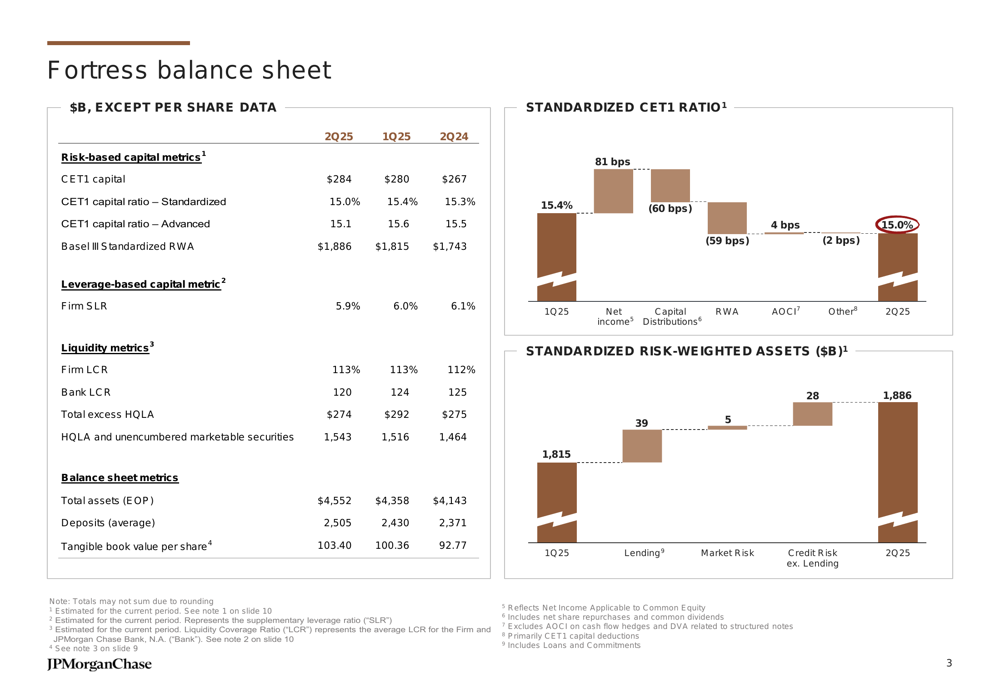
JPMorgan continues to maintain what it calls a "fortress balance sheet" with strong capital and liquidity positions. The bank reported CET1 capital of $284 billion, with CET1 capital ratios of 15.0% (Standardized) and 15.1% (Advanced), well above regulatory requirements.
The bank’s liquidity coverage ratio (LCR) stood at 113% for the firm and 120% for the bank, with total excess high-quality liquid assets (HQLA) of $274 billion. Total (EPA:TTEF) assets reached $4.6 trillion at the end of the quarter.
The following chart provides a comprehensive view of JPMorgan’s balance sheet strength:
Forward Guidance
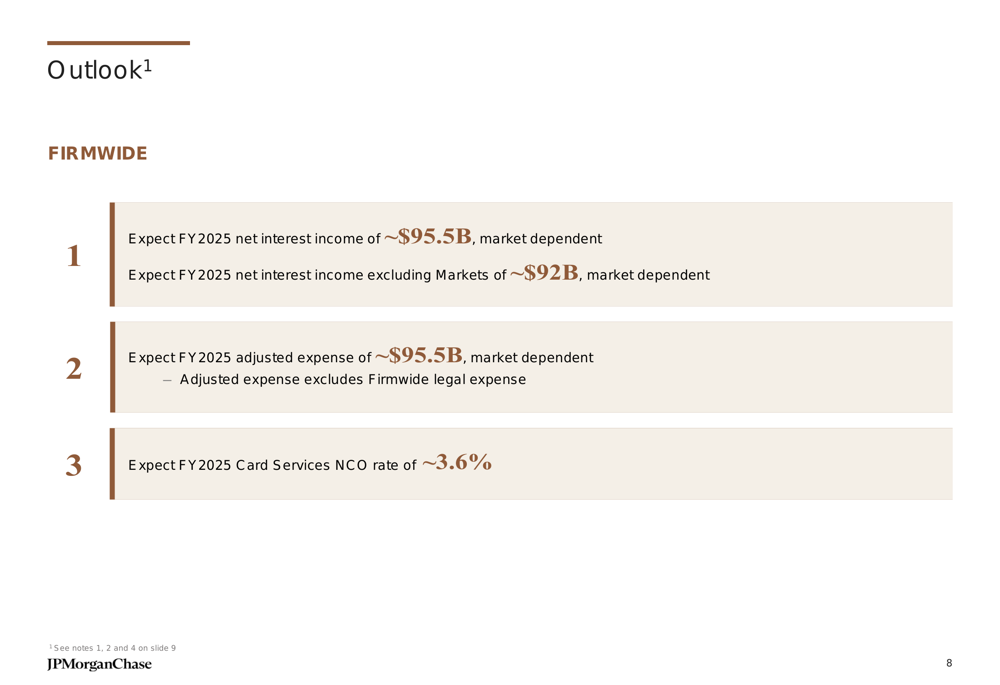
JPMorgan raised its full-year 2025 net interest income guidance to approximately $95.5 billion, up from the previous quarter’s guidance of around $90 billion. Net interest income excluding Markets is expected to be approximately $92 billion.
The bank maintained its full-year 2025 adjusted expense guidance at approximately $95.5 billion and expects a Card Services net charge-off rate of around 3.6%.
As outlined in the bank’s outlook slide:
Conclusion
JPMorgan Chase’s Q2 2025 financial results demonstrate the bank’s continued ability to generate strong returns across its diversified business model. With net income of $15.0 billion and EPS of $5.24, the bank has shown resilience and growth despite ongoing economic uncertainties.
The raised guidance for full-year net interest income suggests management’s confidence in the bank’s ability to continue performing well throughout 2025. JPMorgan’s strong capital position, with CET1 capital ratios well above regulatory requirements, provides a solid foundation for navigating potential economic challenges while continuing to return capital to shareholders through dividends and share repurchases.
As JPMorgan trades near its 52-week high of $296.40, investors will be watching closely to see if the bank can maintain its momentum in the second half of 2025 amid evolving economic conditions and potential policy changes.
Full presentation:
This article was generated with the support of AI and reviewed by an editor. For more information see our T&C.