Paul Tudor Jones sees potential market rally after late October

Kite Realty Group Trust (NYSE:KRG) revealed strong second-quarter performance in its latest investor presentation, highlighting continued momentum in leasing activity and same-property NOI growth that has prompted management to raise full-year guidance. The retail REIT’s strategic focus on grocery-anchored centers and Sun Belt markets continues to yield results, with operational metrics outpacing industry peers.
Quarterly Performance Highlights
Kite Realty reported NAREIT FFO of $0.51 per share for Q2 2025, driven by same-property NOI growth of 3.3% and lower-than-expected bad debt. Core FFO came in at $0.50 per share. The company achieved approximately 1.2 million square feet of total leasing volume during the quarter, with impressive 17.0% comparable blended cash leasing spreads.
As shown in the following quarterly highlights chart, the company maintains a strong leased rate with anchor spaces at 94.2% and shop spaces at 91.6%, though the company noted a 260-basis point decline in anchor leased percentage due to recent bankruptcies:
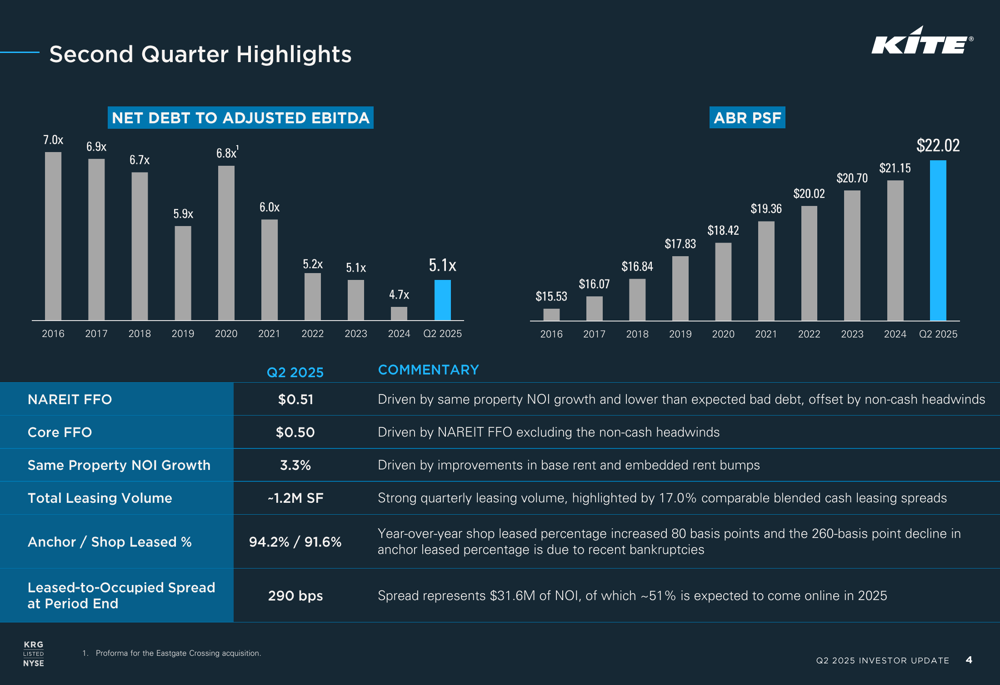
The leased-to-occupied spread stands at 290 basis points, representing $31.6 million of NOI, with approximately 51% expected to come online during 2025. This pipeline of signed-not-open leases increased by $4.1 million quarter-over-quarter, indicating strong future revenue growth potential.
Strategic Initiatives
Kite Realty’s portfolio strategy continues to emphasize grocery-anchored centers, which now represent 79% of retail weighted ABR, up from previous quarters. The company has successfully converted several non-grocery spaces to grocery tenants, achieving 44.6% average new leasing spreads and 21.5% average gross returns on capital.
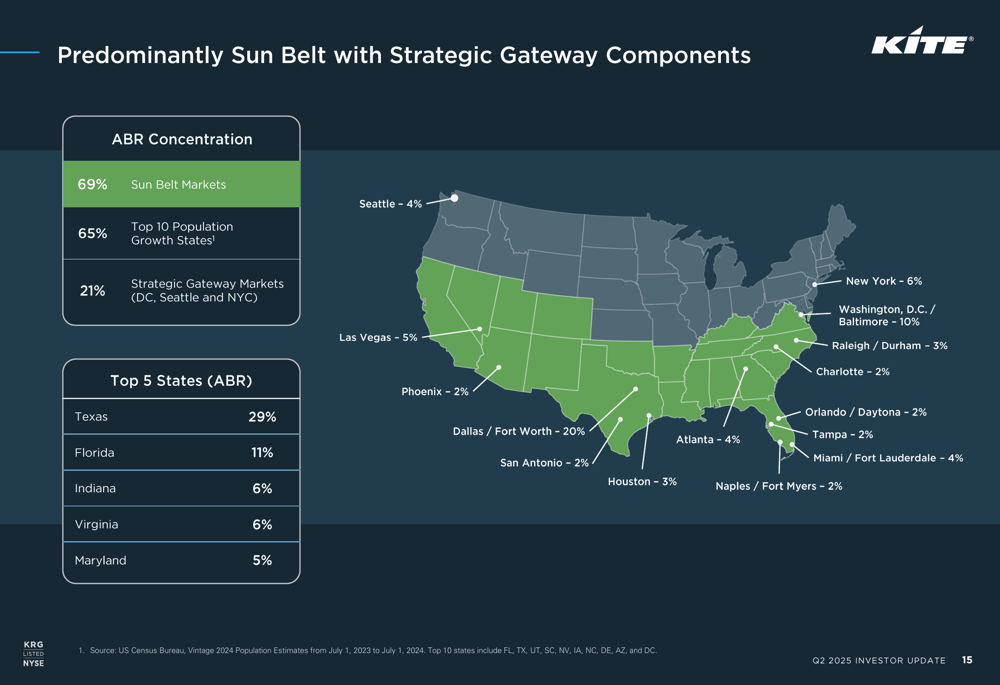
The geographic focus remains firmly on high-growth Sun Belt markets, which account for 69% of ABR, complemented by strategic gateway market presence (21%) in Washington D.C., Seattle, and New York City:
Transaction (JO:NTUJ) activity accelerated in the first half of 2025, with $476.6 million in acquisitions at a 6.5% effective yield, partially offset by $258.4 million in dispositions. Notable acquisitions included Legacy West, an iconic lifestyle/mixed-use center that strengthens the company’s portfolio quality.
"Strong grocer demand in KRG’s portfolio has allowed us to increase our percentage of weighted ABR generated from centers with a grocery component to 79% at strong rent spreads and healthy returns on capital," the company noted in its presentation.
Operational Excellence
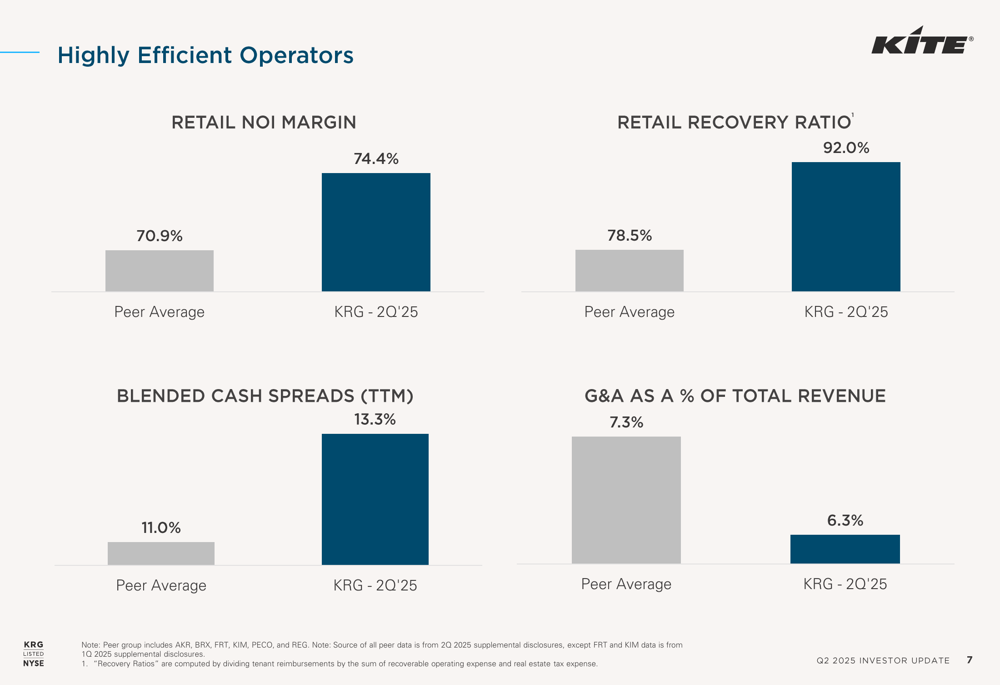
Kite Realty continues to outperform industry peers across key operational metrics. The company’s retail NOI margin of 74.4% exceeds the peer average of 70.9%, while its recovery ratio of 92.0% significantly outpaces the peer average of 78.5%:
The company has also made substantial progress in improving its long-term embedded growth profile by implementing higher fixed rent bumps in new leases and non-option renewals. Since 2022, KRG has increased its average ABR growth in these leases from 2.3% to 2.8% in 2025 year-to-date.
Management highlighted that "nearly 15 years of limited supply growth has resulted in record-high leased rates for open-air retail as tenants are competing for existing space in institutional quality centers," creating favorable conditions for landlords like Kite Realty.
Forward Guidance
Based on strong first-half performance, Kite Realty raised its full-year 2025 guidance. The company now expects NAREIT FFO in the range of $2.06 to $2.10 per share, up from the previous midpoint of $2.07. Core FFO guidance was similarly increased to $2.02 to $2.06 per share:
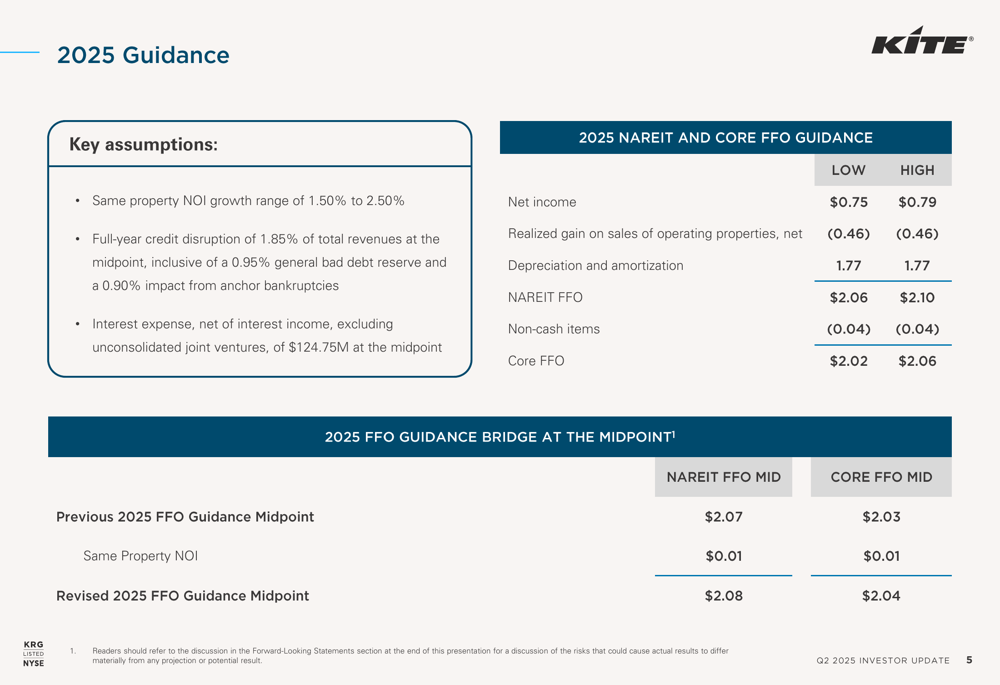
Key assumptions for the updated guidance include same-property NOI growth of 1.50% to 2.50% and full-year credit disruption of 1.85% of total revenues at the midpoint, inclusive of a 0.95% general bad debt reserve and a 0.90% impact from anchor bankruptcies.
This guidance increase aligns with the company’s Q1 2025 performance, which as previously reported, exceeded expectations with EPS of $0.11 versus the expected $0.0739 and revenue of $219.17 million against forecasts of $211.56 million.
Balance Sheet and Financial Position
Kite Realty maintains a strong balance sheet with net debt to adjusted EBITDA of 5.1x, which compares favorably to several industry peers:
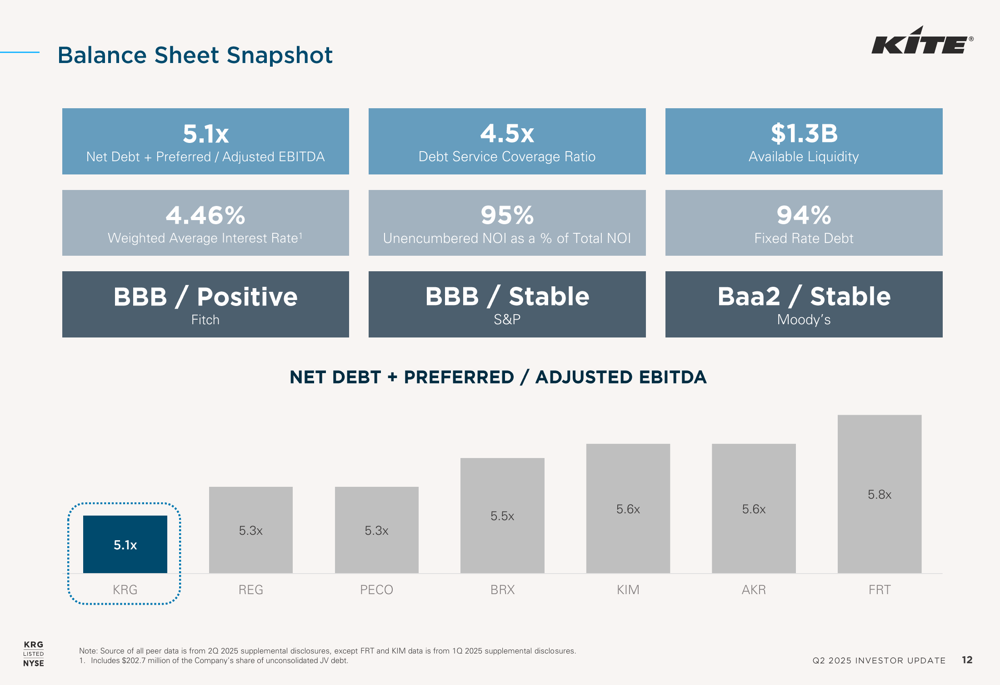
The company reports $1.3 billion in available liquidity and a well-staggered debt maturity profile with a weighted average interest rate of 4.46%. Investment-grade credit ratings (BBB from S&P and Fitch, Baa2 from Moody’s) reflect the company’s financial stability.
With 95% of NOI coming from unencumbered assets and 94% of debt at fixed rates, Kite Realty is well-positioned to navigate potential interest rate fluctuations while maintaining financial flexibility for strategic acquisitions and development opportunities.
As of July 30, 2025, Kite Realty’s stock closed at $23.08, down slightly by 0.58% for the day, but still trading well above its 52-week low of $18.52 and with potential upside toward its 52-week high of $28.24.
Full presentation:
This article was generated with the support of AI and reviewed by an editor. For more information see our T&C.