BTC Development Corp. completes $253 million IPO on NASDAQ

Introduction & Market Context
Ladder Capital Corp (NYSE:LADR) released its first quarter 2025 supplemental presentation on April 24, 2025, revealing a continued strategic focus on balance sheet strength and liquidity, albeit with reduced earnings compared to previous quarters. The commercial real estate finance company reported distributable earnings of $25.5 million, or $0.20 per share, down from $37.7 million, or $0.30 per share, in Q3 2024.
The company’s stock closed at $10.22 on April 23, 2025, trading at a significant discount to its undepreciated book value of $13.66 per share, reflecting ongoing market concerns about commercial real estate exposure despite Ladder’s conservative positioning.
Quarterly Performance Highlights
Ladder Capital reported distributable earnings of $25.5 million ($0.20 per share) for Q1 2025, with an after-tax distributable return on average equity (ROAE) of 6.6%. Despite the lower earnings, the company maintained its quarterly dividend at $0.23 per share, representing an attractive 9.0% annual yield based on current share prices.
As shown in the following comprehensive performance summary from the presentation:
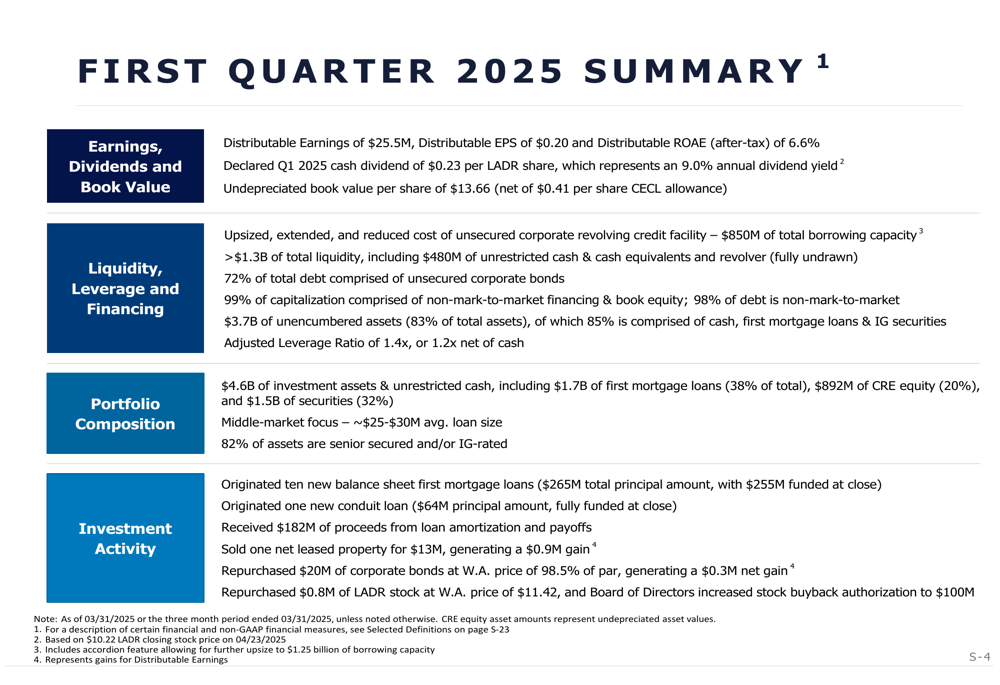
The company originated ten new balance sheet first mortgage loans totaling $265 million and one new conduit loan of $64 million during the quarter. Ladder also received $182 million in loan proceeds, sold one property for $13 million, and repurchased $20 million in bonds and $0.8 million of LADR stock.
The company’s undepreciated book value per share remained relatively stable at $13.66, compared to $13.68 a year ago, despite significant shifts in portfolio composition.
Investment Portfolio Composition
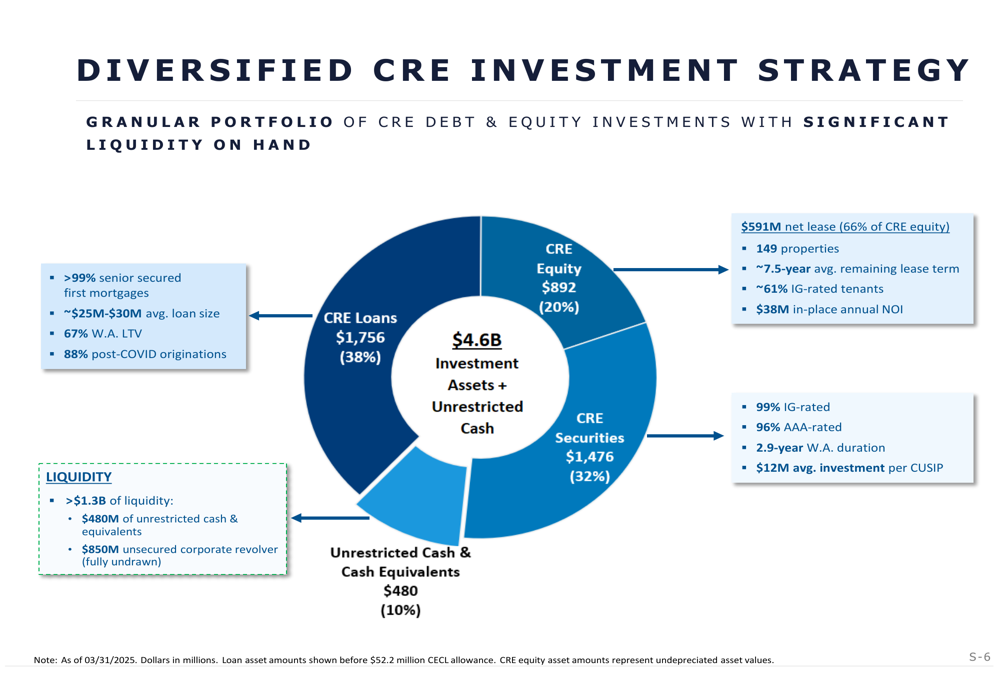
Ladder Capital maintains a diversified commercial real estate investment strategy, with total investment assets and cash of $4.6 billion as of March 31, 2025. The portfolio is strategically allocated across multiple asset classes to balance risk and return.
The following chart provides a clear breakdown of Ladder’s investment portfolio:
The portfolio consists of:
- CRE Loans: $1.76 billion (38%), with >99% senior secured and 67% weighted average loan-to-value
- CRE Securities: $1.48 billion (32%), with 99% investment grade-rated and 96% AAA-rated
- CRE Equity: $892 million (20%), including $591 million in net lease properties
- Unrestricted Cash: $480 million (10%)
The loan portfolio maintains a middle-market focus with an average loan size of $25-30 million and no construction loans. The weighted average loan-to-value ratio stands at 67%, reflecting Ladder’s conservative underwriting approach.
A more detailed view of the loan portfolio composition shows:
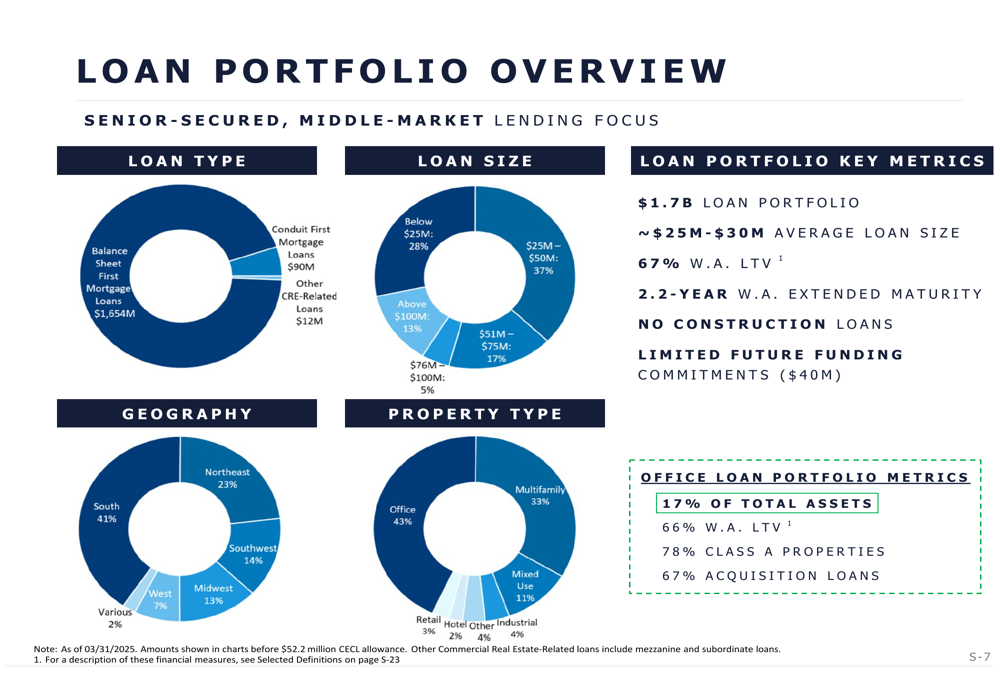
The loan portfolio is diversified by geography, with significant exposure to the South (41%) and Northeast (23%). By property type, office loans represent 43% of the portfolio, followed by multifamily at 33%. The company emphasizes that its office loan portfolio, which represents 17% of total assets, has a weighted average loan-to-value ratio of 66%, with 78% in Class A properties.
Capital Structure & Liquidity
Ladder Capital has significantly strengthened its balance sheet over the past year, focusing on increasing the proportion of unencumbered assets and reducing mark-to-market exposure. The company reported total liquidity exceeding $1.3 billion, including $480 million in unrestricted cash and an $850 million undrawn corporate revolver.
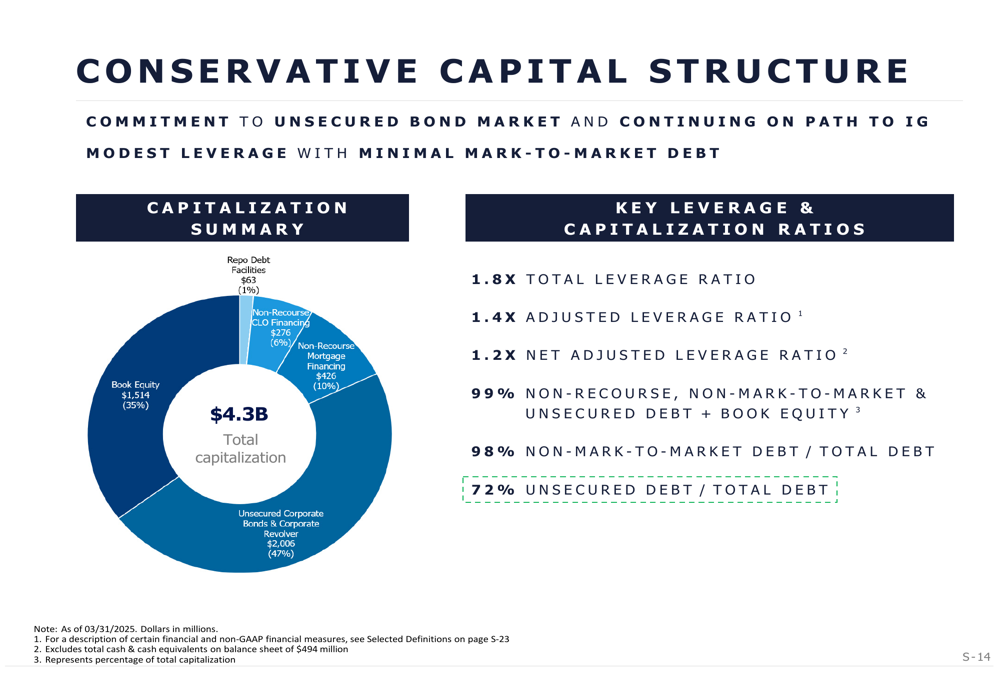
The company’s conservative capital structure is illustrated in this breakdown:
Key leverage and capitalization metrics include:
- Total (EPA:TTEF) leverage ratio of 1.8x, down from 2.4x a year ago
- Adjusted leverage ratio of 1.4x, down from 1.5x a year ago
- 98% of debt is non-mark-to-market, up from 84% a year ago
- 72% of debt is unsecured, up from 43% a year ago
Ladder has also significantly increased its unencumbered asset pool, as shown in the following chart:
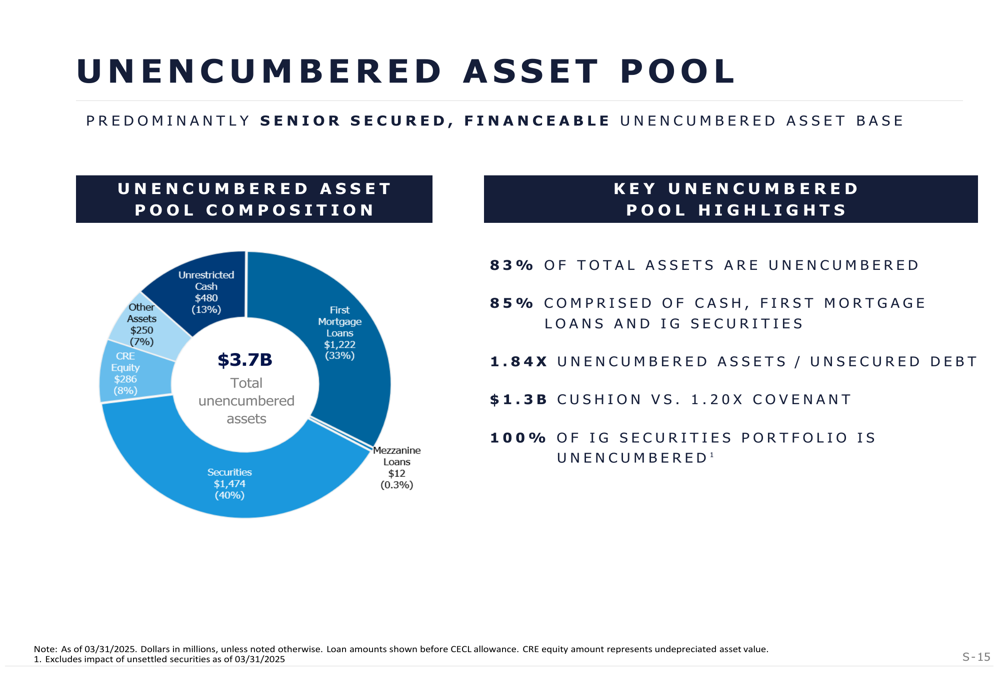
The company now holds $3.7 billion in unencumbered assets, representing 83% of total assets, up from 57% a year ago. This provides a substantial cushion of $1.3 billion above the required 1.20x covenant for unencumbered assets to unsecured debt.
Year-over-Year Comparison
Comparing Q1 2025 to Q1 2024 reveals significant shifts in Ladder’s portfolio composition and financial metrics, reflecting the company’s strategic pivot toward a more conservative approach:
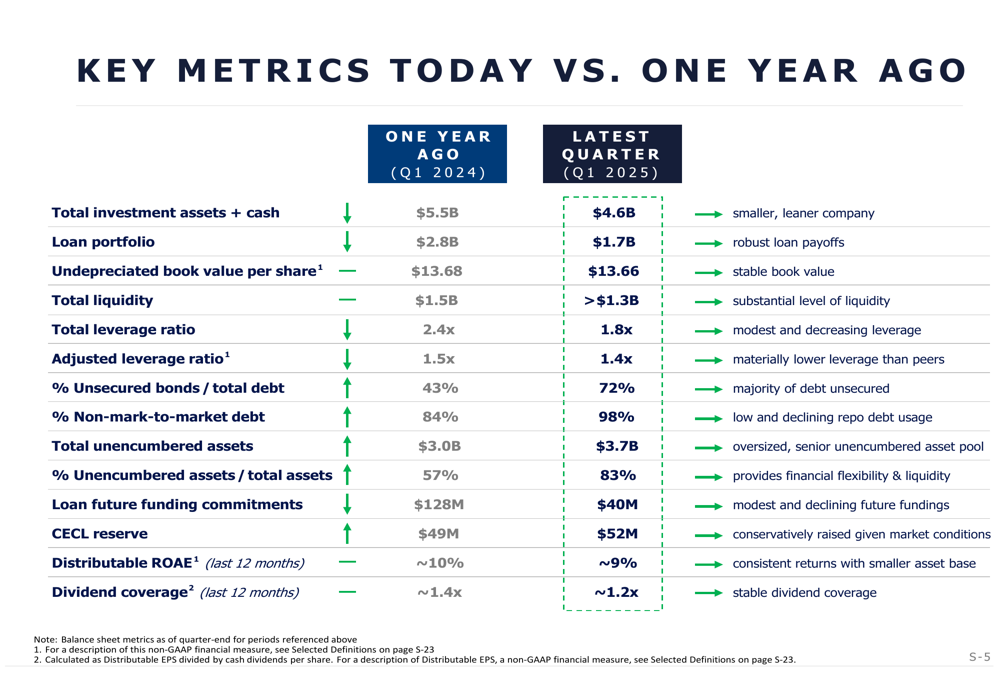
Notable changes include:
- Total investment assets and cash decreased from $5.5 billion to $4.6 billion
- Loan portfolio decreased from $2.8 billion to $1.7 billion
- Percentage of unsecured bonds to total debt increased from 43% to 72%
- Percentage of non-mark-to-market debt increased from 84% to 98%
- Total unencumbered assets increased from $3.0 billion to $3.7 billion
- Distributable ROAE (last 12 months) decreased from approximately 10% to 9%
- Dividend coverage (last 12 months) decreased from approximately 1.4x to 1.2x
These changes demonstrate Ladder’s strategic shift toward a more defensive position, prioritizing balance sheet strength and liquidity over higher returns in the current uncertain commercial real estate environment.
Investment Portfolio Performance
The following chart provides a comprehensive summary of Ladder’s investment portfolio and its contribution to distributable earnings:
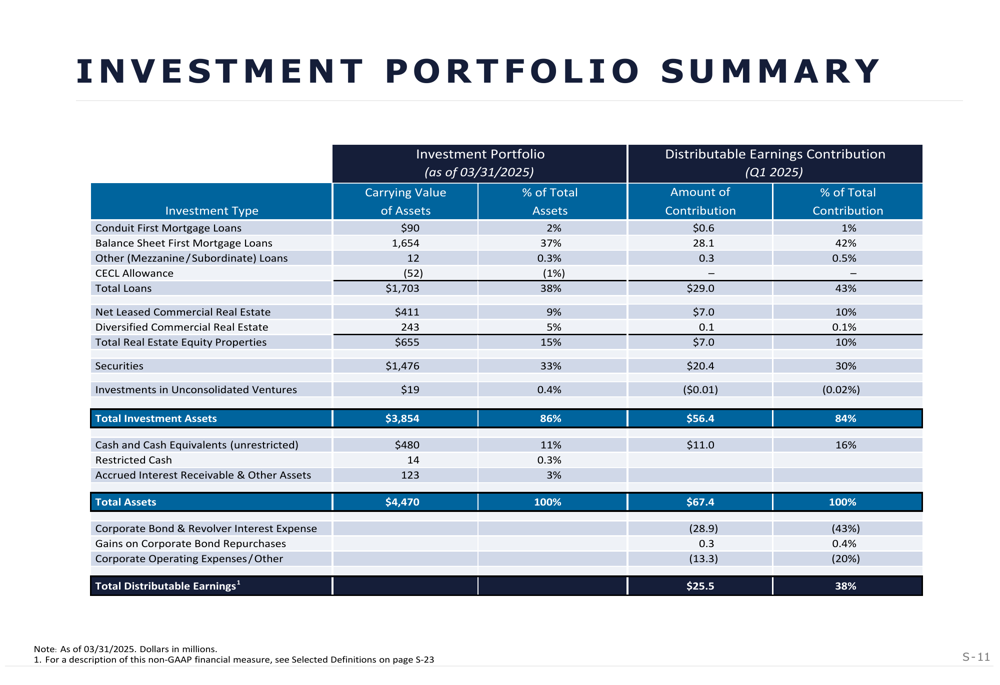
Balance sheet first mortgage loans remain the largest contributor to distributable earnings at $24.1 million, despite representing only 36% of total assets. Securities, which make up 33% of total assets, contributed $19.5 million to distributable earnings, while net leased commercial real estate contributed $10.0 million.
After accounting for corporate expenses, interest, and other items, total distributable earnings for Q1 2025 were $25.5 million.
Forward-Looking Statements
While Ladder Capital’s Q1 2025 presentation does not include explicit forward-looking guidance, the company’s strategic positioning suggests a continued focus on maintaining a conservative balance sheet and strong liquidity position. The significant reduction in leverage and increase in unencumbered assets over the past year indicates that management anticipates ongoing uncertainty in commercial real estate markets.
Based on the Q3 2024 earnings call, Ladder had previously expressed optimism about increasing investment opportunities amid reduced competition, with plans to reach its typical quarterly run rate of loan origination by Q1 or Q2 2025. The Q1 2025 results show progress in this direction, with $329 million in new loan originations during the quarter.
The company’s maintained dividend of $0.23 per share, despite lower earnings, suggests confidence in its ability to generate sustainable cash flow. However, the reduced dividend coverage ratio of 1.2x, down from 1.4x a year ago, bears monitoring in future quarters.
Ladder Capital’s strategic shift toward a more defensive position, with increased allocation to highly-rated securities and reduced loan exposure, positions the company to weather potential market volatility while maintaining the flexibility to capitalize on attractive investment opportunities as they arise.
Full presentation:
This article was generated with the support of AI and reviewed by an editor. For more information see our T&C.