Instacart downgraded as competition tightening grip on online grocery

Shares of Lundin Gold Inc (TSX:LUG) jumped 8.33% on Friday after the Ecuador-focused gold miner reported exceptional second-quarter results, highlighted by record production, expanding margins, and substantial dividend payments.
Quarterly Performance Highlights
Lundin Gold delivered outstanding operational and financial results in Q2 2025, achieving record throughput and recovery rates at its flagship Fruta del Norte mine in Ecuador. The company produced 139,433 ounces of gold during the quarter, with 136,737 ounces sold at an average realized price of $3,361 per ounce.
The mill processed 460,820 tonnes of ore at a record throughput rate of 5,064 tonnes per day, with the average grade of ore milled at 10.4 g/t and a record average recovery rate of 90.9%. These operational achievements, combined with a favorable gold price environment, resulted in exceptional financial performance.
As shown in the following quarterly highlights:
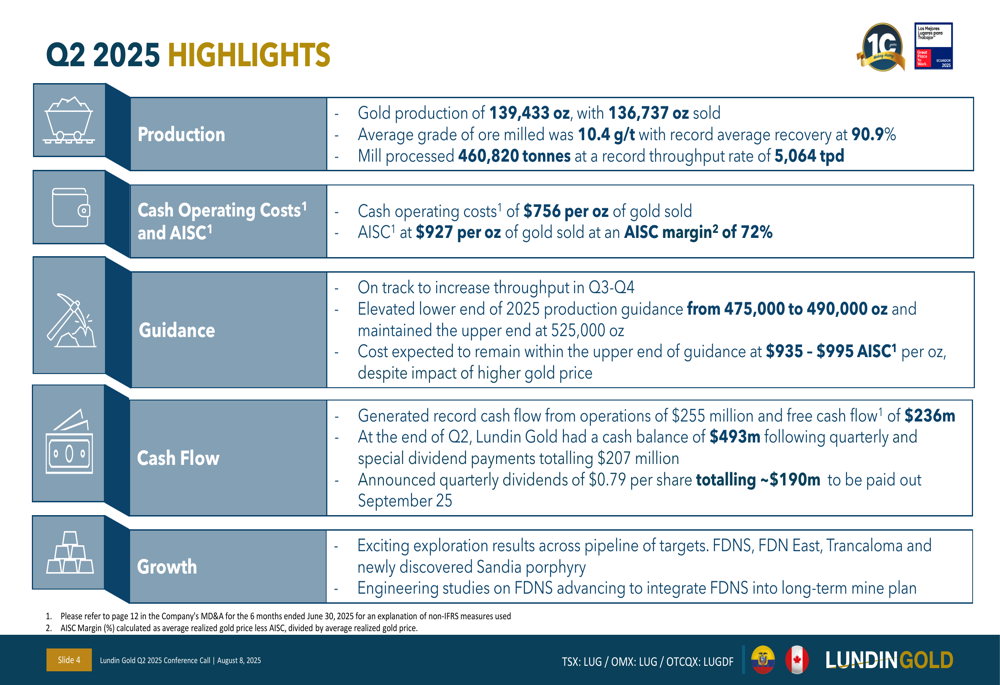
The company maintained disciplined cost control with cash operating costs of $756 per ounce sold and all-in sustaining costs (AISC) of $927 per ounce, resulting in an impressive AISC margin of 72%. Based on these strong results, Lundin Gold raised the lower end of its 2025 production guidance from 475,000 to 490,000 ounces while maintaining the upper end at 525,000 ounces.
Detailed Financial Analysis
Lundin Gold’s financial performance in Q2 2025 showed remarkable year-over-year growth across all key metrics. Revenue reached $453 million, a 50% increase from Q2 2024, while net income surged 65% to $197 million. Earnings per share doubled to $0.82, and adjusted EBITDA grew 63% to $319 million.
The following chart illustrates the company’s impressive margin expansion over the past six quarters:
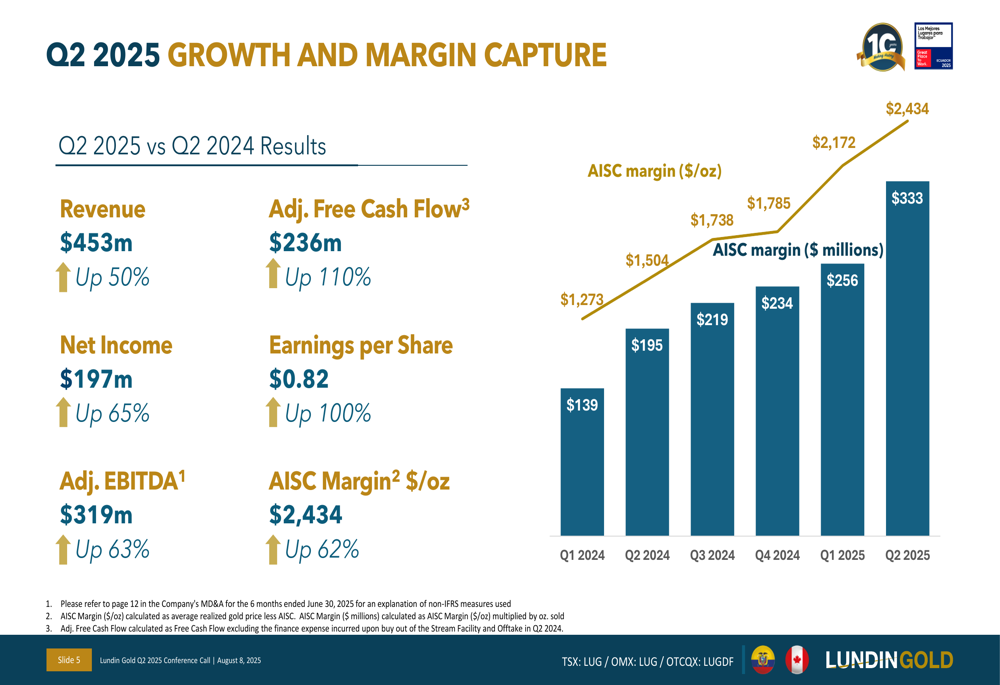
The AISC margin per ounce increased 62% year-over-year to $2,434, resulting in a total AISC margin of $333 million for the quarter. This substantial margin expansion reflects both operational improvements and the benefit of higher gold prices.
The company’s financial highlights demonstrate the strength of its performance when compared to the same period last year:
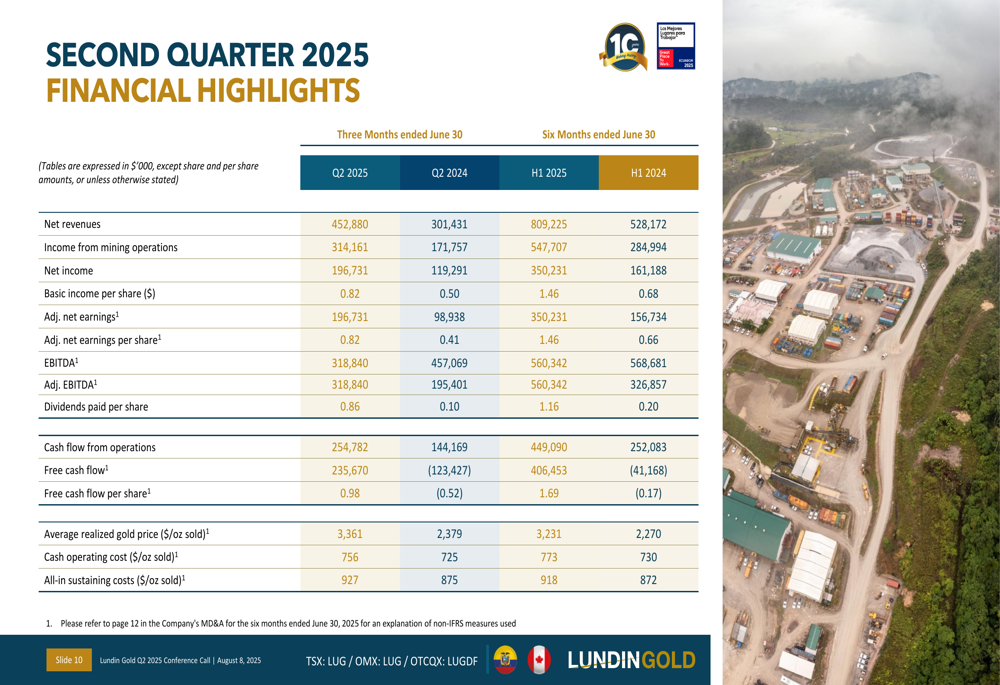
Lundin Gold generated record cash flow from operations of $255 million and free cash flow of $236 million in Q2 2025, representing increases of 77% and 110% respectively compared to Q2 2024. On a per-share basis, free cash flow reached $0.98, up from $0.47 in the prior-year period.
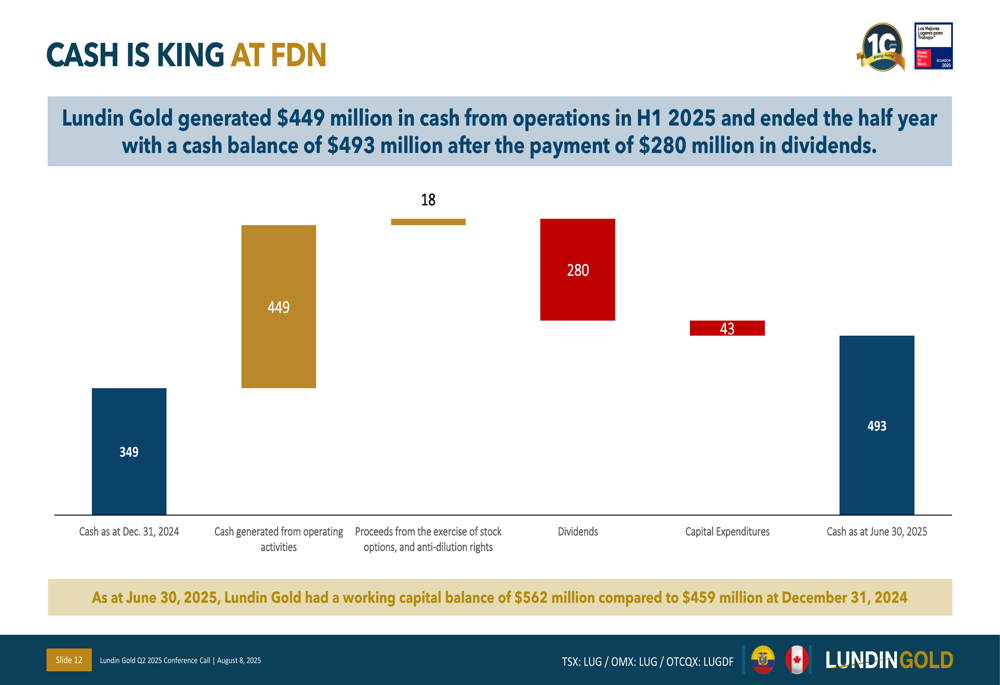
Cash Position and Shareholder Returns
The company’s robust cash generation has significantly strengthened its financial position while enabling substantial returns to shareholders. Lundin Gold ended Q2 2025 with a cash balance of $493 million, up from $349 million at the end of 2024, despite paying $280 million in dividends during the first half of the year.
The following chart illustrates the company’s cash flow dynamics:
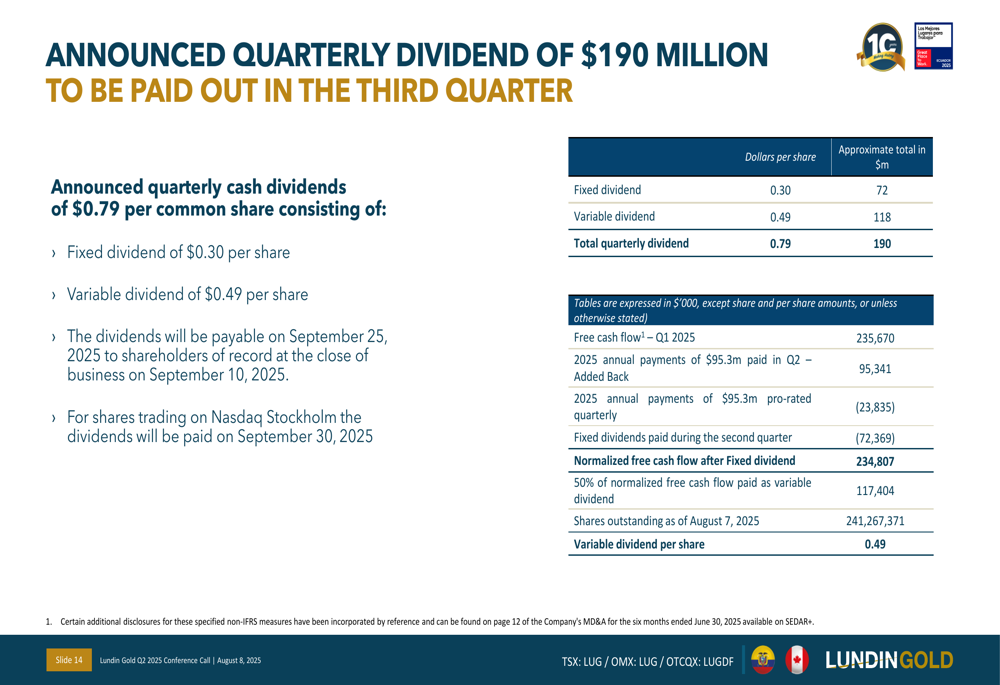
Based on its strong performance, Lundin Gold announced quarterly dividends totaling $0.79 per share, consisting of a fixed dividend of $0.30 per share and a variable dividend of $0.49 per share. These dividends, totaling approximately $190 million, will be paid on September 25, 2025, to shareholders of record as of September 10, 2025.
The dividend details are outlined in the following slide:
Strategic Initiatives & Exploration
Beyond its operational success, Lundin Gold continues to advance its growth strategy through exploration activities. The company is focusing on near-mine exploration at FDNS and FDN East, with drilling at FDNS confirming the continuity of mineralization and indicating significant potential for further resource expansion.
Engineering studies are progressing to integrate a portion of FDNS into Fruta del Norte’s 2026 long-term mine plan. Additionally, the company has discovered another copper-gold porphyry system, creating a highly prospective corridor adjacent to its existing epithermal gold deposits.
Lundin Gold has increased its planned drilling for 2025 from 80,000 to 108,000 meters due to exploration success. The company is on track to establish an initial reserve at FDNS while continuing to grow inferred resources.
Forward-Looking Statements
Looking ahead, Lundin Gold confirmed its 2025 cost guidance with cash costs expected to remain between $730-790 per ounce sold and AISC between $935-995 per ounce sold. The company is well-positioned to achieve its 2025 objectives, having already completed its plant expansion project in Q1 and now focusing on optimization for the remainder of the year.
The company’s progress against its 2025 objectives is summarized in the following slide:
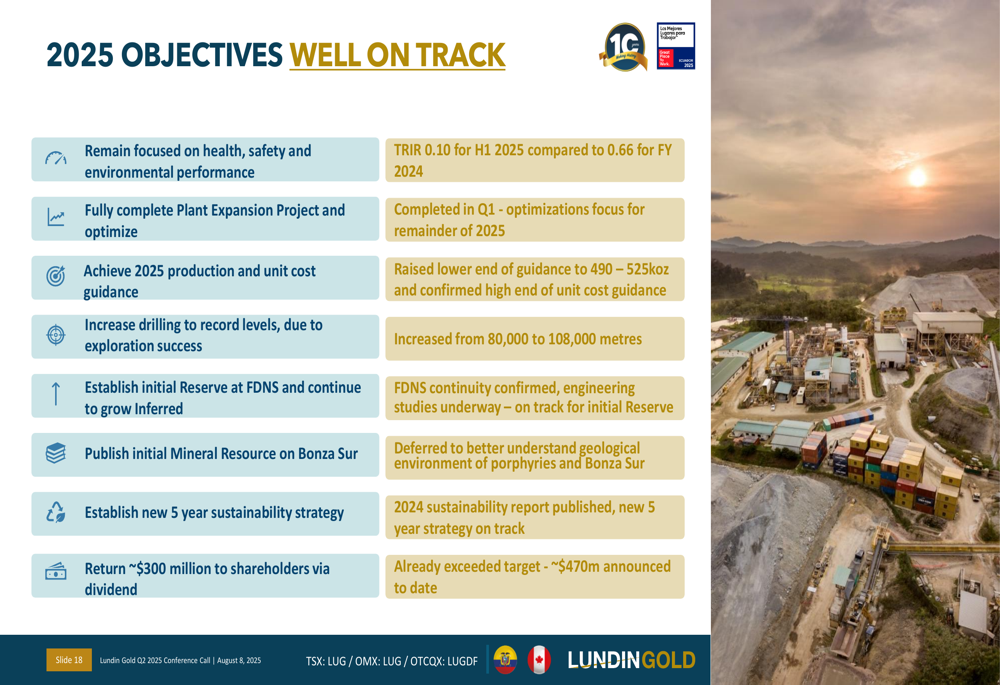
Safety performance has also improved significantly, with the Total (EPA:TTEF) Recordable Incident Rate (TRIR) dropping to 0.10 for the first half of 2025, compared to 0.66 for the full year 2024. In fact, the company achieved a TRIR of 0.00 in Q2 2025, highlighting its commitment to operational excellence and responsible mining practices.
With its combination of operational excellence, strong cash flow generation, growth potential, and commitment to ESG principles, Lundin Gold appears well-positioned to continue delivering value to shareholders while advancing its vision of building a leading gold company through responsible mining.
Full presentation:
This article was generated with the support of AI and reviewed by an editor. For more information see our T&C.