Nvidia among investors in xAI’s $20 bln capital raise- Bloomberg

Introduction & Market Context
McKesson Corporation (NYSE:MCK) presented its fiscal 2025 financial results and fiscal 2026 outlook on May 8, 2025, showcasing strong performance across its business segments. The healthcare services and supply chain management company reported significant revenue and earnings growth, while also announcing strategic initiatives including the planned separation of its Medical-Surgical Solutions business.
McKesson shares initially fell 4.45% during regular trading hours on the day of the announcement but rebounded 2.28% in after-hours trading, suggesting the market was digesting the mixed implications of the company’s strategic shifts alongside its strong financial performance.
Annual Performance Highlights
McKesson delivered robust financial results for fiscal year 2025, with total revenues reaching $359.1 billion, representing a 16% increase year-over-year. The company reported adjusted earnings per diluted share of $33.05, a 20% increase compared to the prior year.
As shown in the following consolidated financial information table, McKesson demonstrated strong growth across key metrics:
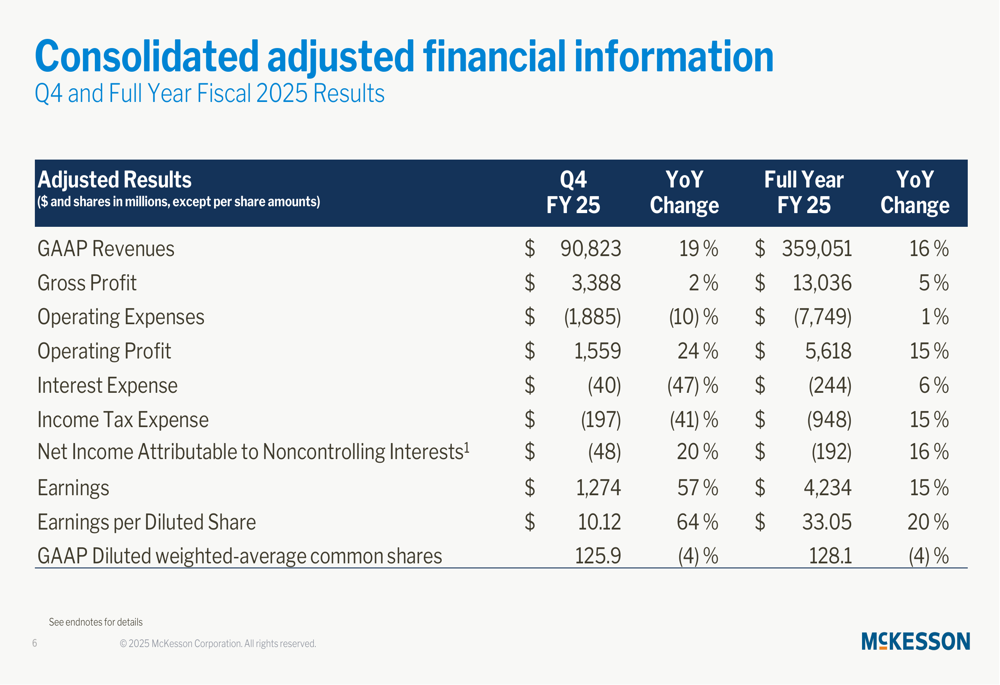
The company’s performance was driven by higher prescription volumes from retail national customers and growth in specialty product distribution, particularly in oncology. McKesson’s cash flow from operations amounted to $6.1 billion, with free cash flow of $5.2 billion, demonstrating the company’s strong cash generation capabilities.
The following waterfall chart illustrates the key drivers of McKesson’s adjusted EPS growth from fiscal 2024 to 2025:
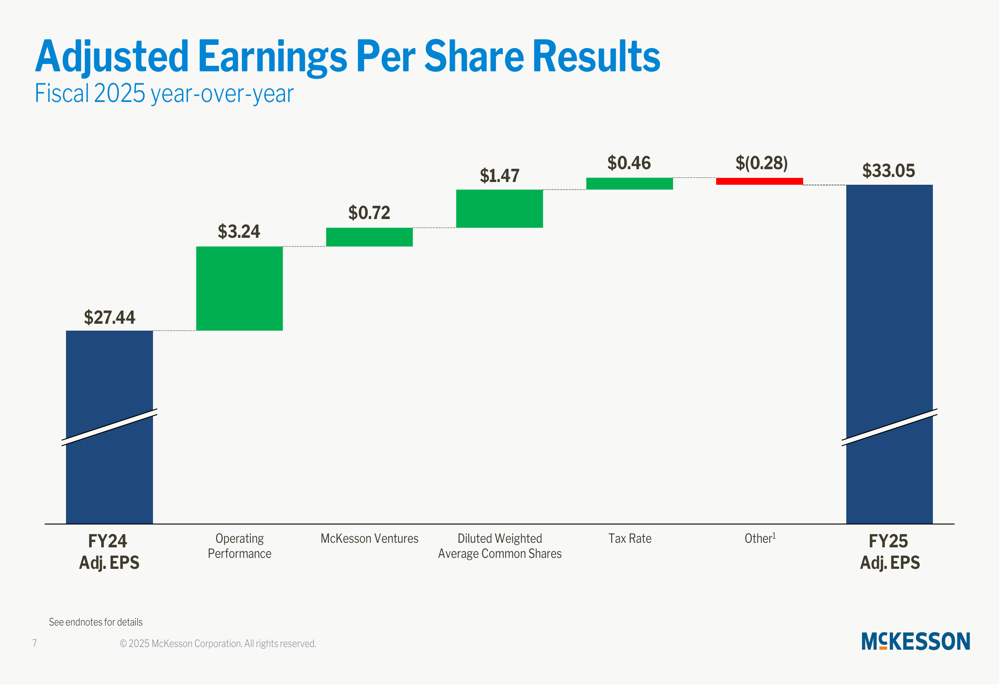
Operating performance contributed $3.24 to the EPS growth, while McKesson Ventures added $0.72. Share repurchases had a significant positive impact, contributing $1.47 to EPS growth through a reduction in diluted weighted average common shares.
Segment Performance
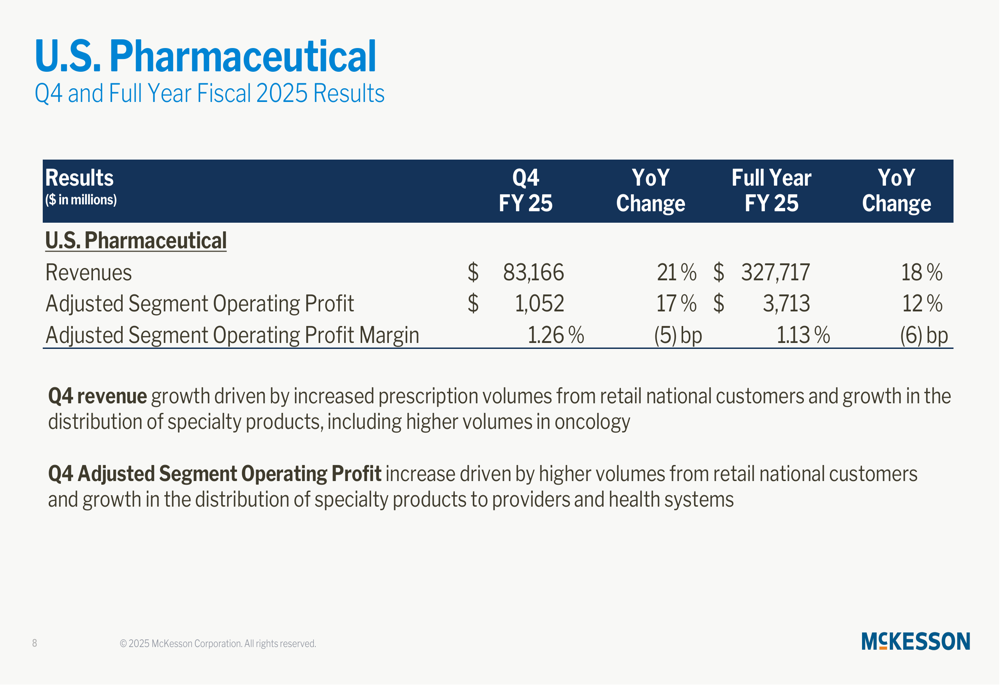
McKesson’s U.S. Pharmaceutical (TADAWUL:2070) segment, which represents the largest portion of the company’s business, delivered 18% revenue growth for the full year, reaching $327.7 billion. The segment’s adjusted operating profit increased by 12% to $3.7 billion, driven by higher volumes from retail national customers and growth in specialty product distribution.
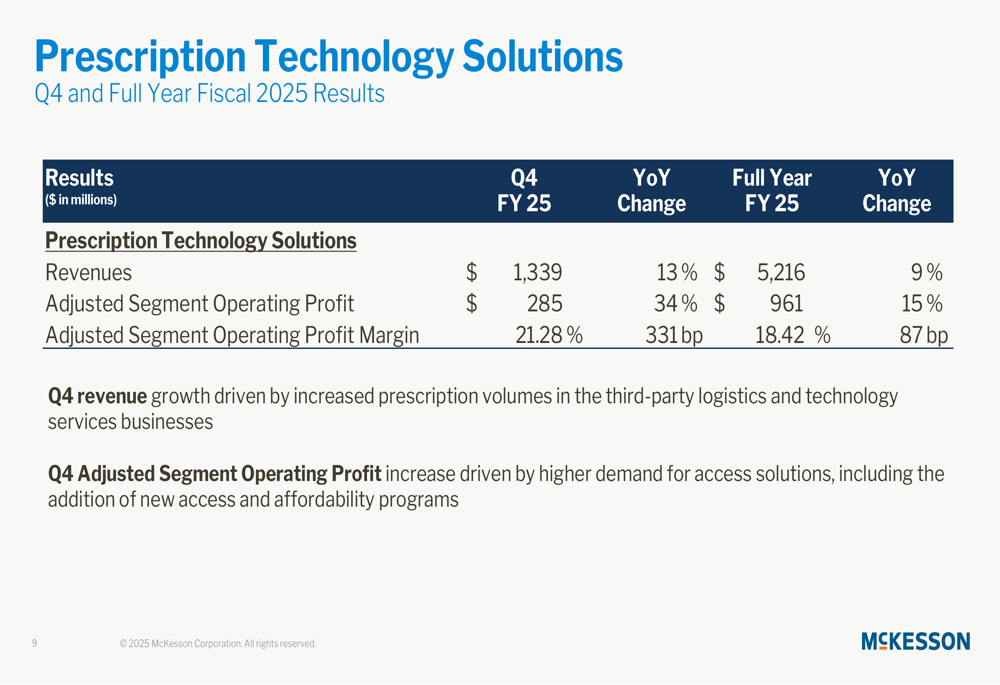
The Prescription Technology Solutions segment showed strong profitability improvement, with revenue growing 9% to $5.2 billion and adjusted operating profit increasing 15% to $961 million. The segment’s operating profit margin expanded by 87 basis points to 18.42%, reflecting the higher-margin nature of this business.
The Medical-Surgical Solutions segment, which McKesson plans to separate into an independent company, reported modest revenue growth of 1% to $11.4 billion, while adjusted operating profit remained flat at $1.0 billion.
The International segment, which includes McKesson’s Canadian operations, delivered 4% revenue growth to $14.7 billion and 13% operating profit growth to $428 million, despite the divestiture of the Canada-based Rexall and Well.ca retail businesses.
Strategic Initiatives
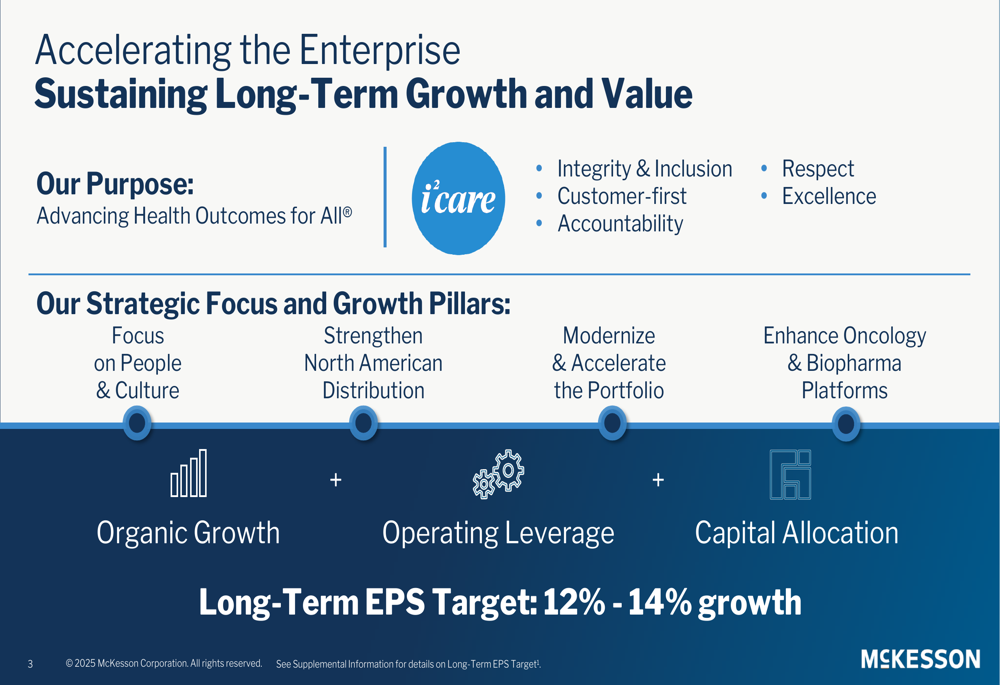
McKesson outlined its enterprise strategy focused on four key pillars: people and culture, strengthening North American distribution, modernizing and accelerating the portfolio, and enhancing oncology and biopharma platforms. This strategic framework aims to deliver long-term value through organic growth, operating leverage, and disciplined capital allocation.
The company’s strategic direction is illustrated in the following slide:
A significant strategic announcement was McKesson’s intention to separate its Medical-Surgical Solutions business into an independent company ("NewCo"). This move aligns with the company’s portfolio optimization strategy and focus on higher-growth areas.
McKesson also highlighted its expansion in oncology services through the acquisition of a controlling interest in Florida Cancer Specialists & Research Institute, LLC’s Core Ventures, expected to close on June 2, 2025. Additionally, the company completed the acquisition of an 80% controlling interest in PRISM Vision Holdings, LLC on April 2, 2025, further strengthening its specialty care capabilities.
Capital Allocation & Cash Flow
McKesson demonstrated disciplined capital allocation during fiscal 2025, with $3.1 billion deployed for share repurchases and $345 million for dividends. The company’s cash flow management is illustrated in the following waterfall chart:
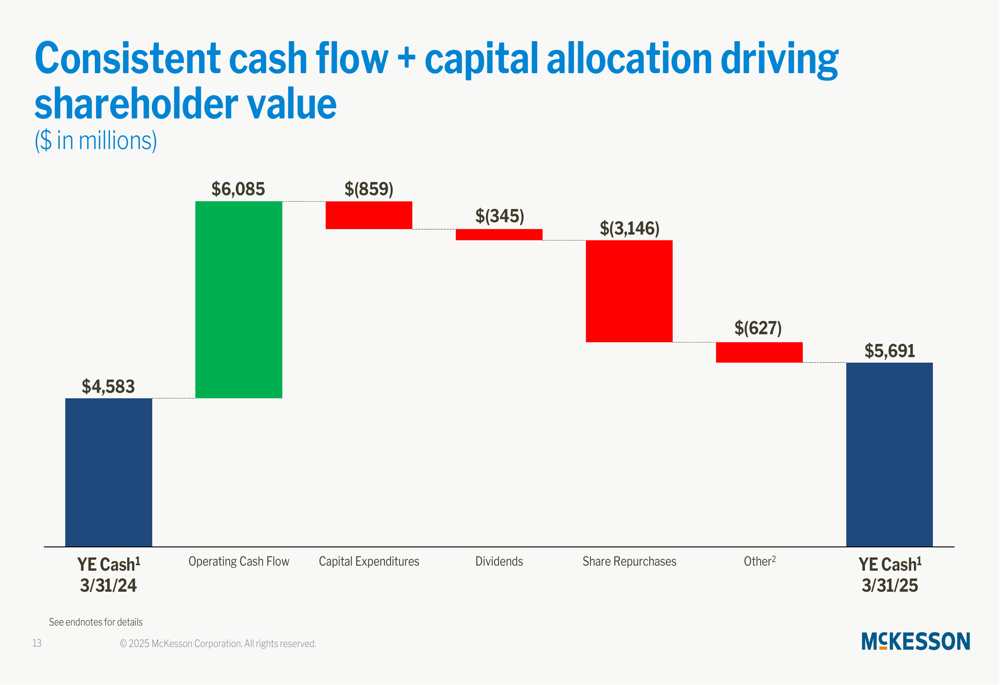
The company generated $6.1 billion in operating cash flow and invested $859 million in capital expenditures, resulting in free cash flow of $5.2 billion. McKesson ended the fiscal year with $5.7 billion in cash, an increase from $4.6 billion at the end of fiscal 2024.
Forward-Looking Statements
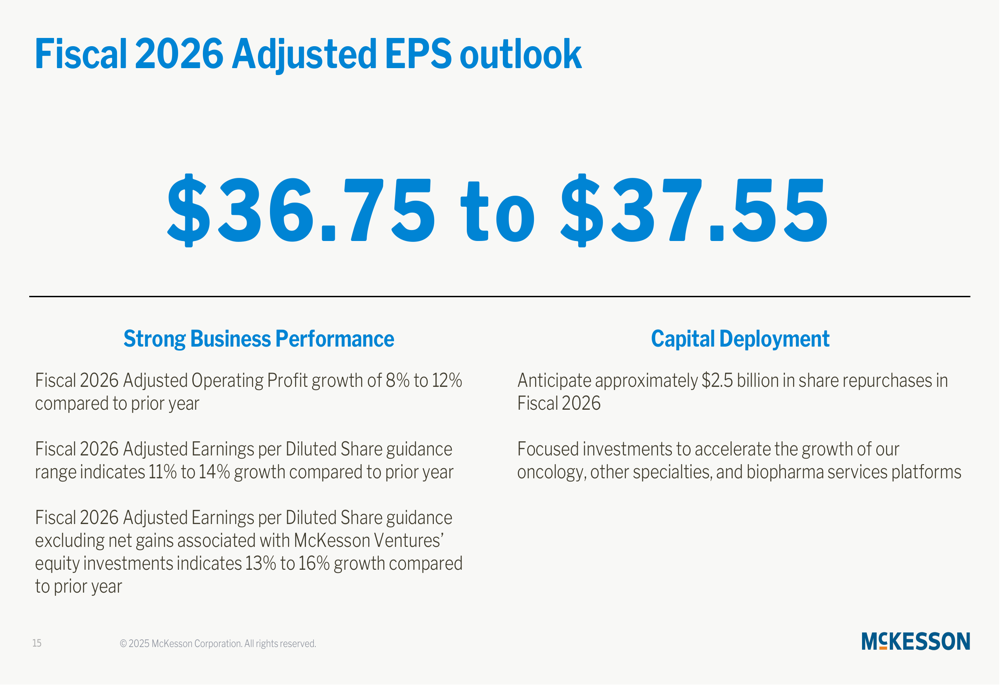
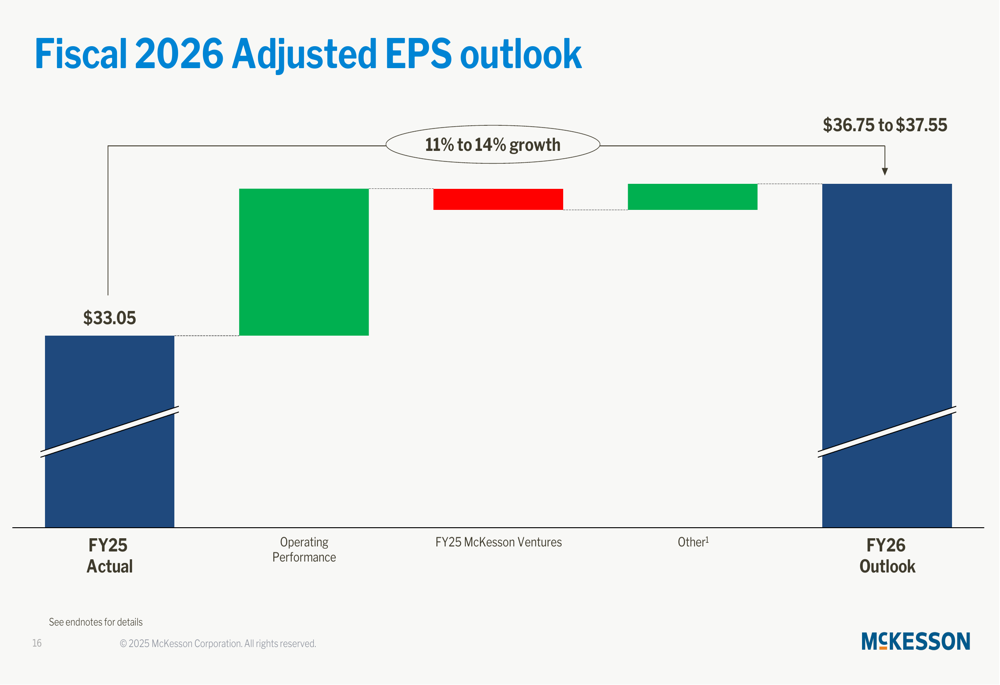
For fiscal 2026, McKesson provided an adjusted earnings per diluted share guidance range of $36.75 to $37.55, representing growth of 11% to 14% compared to fiscal 2025. Excluding net gains associated with McKesson Ventures’ equity investments, the adjusted EPS growth is projected at 13% to 16%.
The company’s fiscal 2026 outlook is presented in the following slide:
The key drivers of the fiscal 2026 EPS outlook are illustrated in this bridge chart:
McKesson expects consolidated revenue growth of 11% to 15% and operating profit growth of 8% to 12% in fiscal 2026. The company anticipates approximately $2.5 billion in share repurchases during the year, slightly lower than the $3.1 billion repurchased in fiscal 2025.
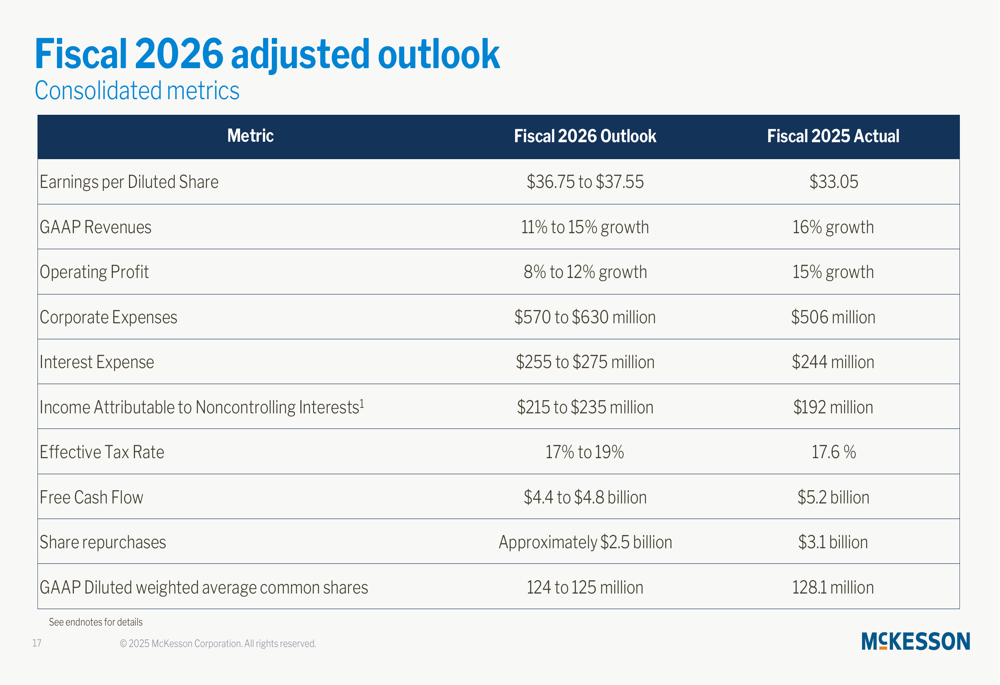
Looking at segment-specific guidance, McKesson projects the strongest growth in its U.S. Pharmaceutical segment, with revenue and adjusted operating profit both expected to increase by 12% to 16%. The Prescription Technology Solutions segment is forecast to deliver 4% to 8% revenue growth and 9% to 13% operating profit growth.
Long-Term Growth Targets
McKesson reaffirmed its long-term adjusted earnings per diluted share growth target of 12% to 14%. The company also updated its long-term adjusted segment operating profit growth targets, raising the projection for U.S. Pharmaceutical from 5-7% to 6-8%, while maintaining the 11-12% target for Prescription Technology Solutions.
The company’s updated long-term growth targets are presented in the following slide:
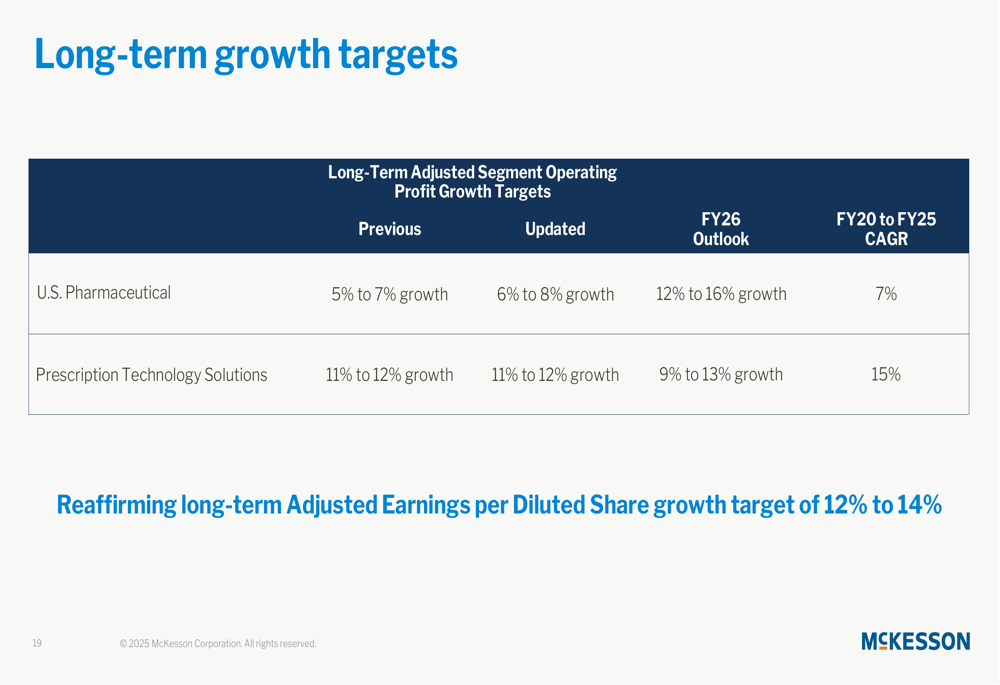
These targets reflect McKesson’s confidence in its strategic direction and ability to deliver sustainable growth through its focus on distribution strength, specialty care expansion, and biopharma services.
In summary, McKesson’s fiscal 2025 results and fiscal 2026 outlook demonstrate the company’s strong execution of its strategic priorities, with significant revenue and earnings growth. The planned separation of the Medical-Surgical Solutions business and strategic acquisitions in oncology services highlight McKesson’s focus on portfolio optimization and expansion in high-growth specialty areas. With robust cash flow generation and disciplined capital allocation, McKesson continues to deliver value to shareholders while positioning itself for long-term growth in the healthcare services market.
Full presentation:
This article was generated with the support of AI and reviewed by an editor. For more information see our T&C.