Intel stock spikes after report of possible US government stake

Introduction & Market Context
MetLife, Inc. (NYSE:MET) released its second quarter 2025 supplemental presentation slides, revealing adjusted earnings of $2.02 per share, showing improvement from the previous quarter despite challenges in variable investment income. The insurance giant’s stock closed at $75.95 on August 6, 2025, representing a 1.42% increase, as investors responded positively to the company’s solid capital position and continued shareholder returns.
The Q2 results demonstrate MetLife’s ability to navigate a complex financial environment while maintaining strong operational performance across most business segments. This follows the company’s first quarter performance where it posted an adjusted EPS of $1.96, which fell short of analyst expectations at that time.
Quarterly Performance Highlights
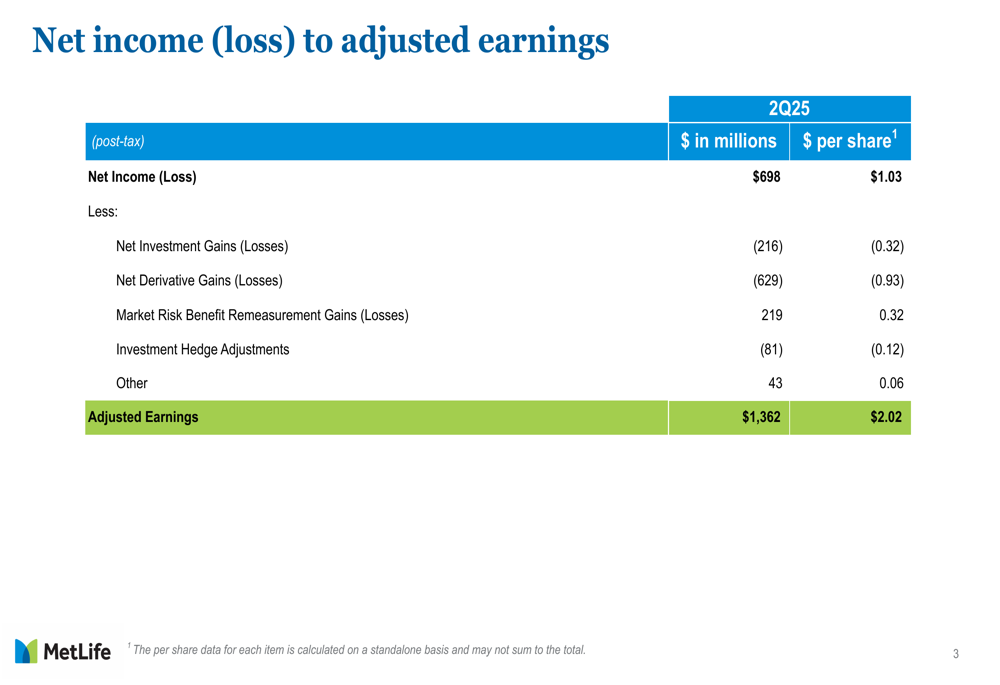
MetLife reported Q2 2025 net income of $698 million ($1.03 per share), with adjusted earnings reaching $1,362 million ($2.02 per share). The difference between net income and adjusted earnings primarily stemmed from net derivative losses of $629 million and net investment losses of $216 million, partially offset by market risk benefit remeasurement gains of $219 million.
As shown in the following reconciliation chart:
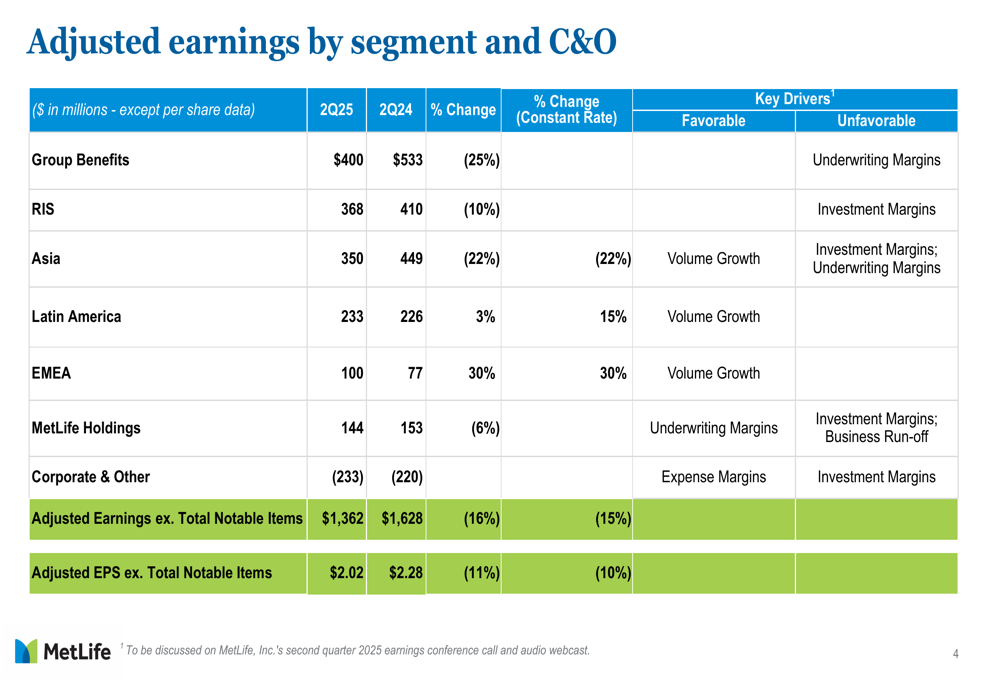
The company’s performance varied across business segments, with most areas showing solid results. Group Benefits led with $400 million in adjusted earnings, followed by Retirement & Income Solutions (RIS) at $368 million and Asia at $350 million. Latin America contributed $233 million, while EMEA and MetLife Holdings added $100 million and $144 million respectively. Corporate & Other reported a loss of $233 million.
The following segment breakdown highlights key drivers for each business unit:
Investment Performance and Expense Management
Variable Investment Income (VII) came in at $195 million for Q2 2025, below the company’s quarterly target of $425 million. This underperformance was primarily attributed to lower private equity returns, though the results aligned with MetLife’s preliminary disclosure. The chart below illustrates the volatility in VII over recent quarters:
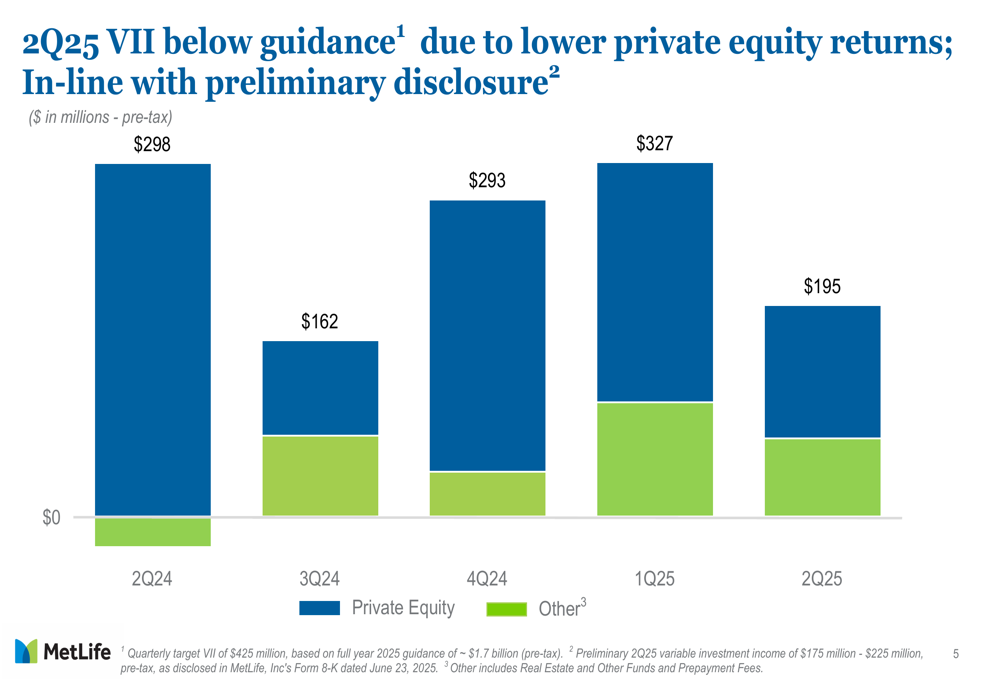
The VII performance varied significantly across segments, with RIS and Asia contributing the largest portions at $60 million and $64 million respectively. These two segments also represent the largest share of VII assets, with Asia holding 43% ($8.0 billion) and RIS holding 30% ($5.6 billion) of the total $18.8 billion portfolio.
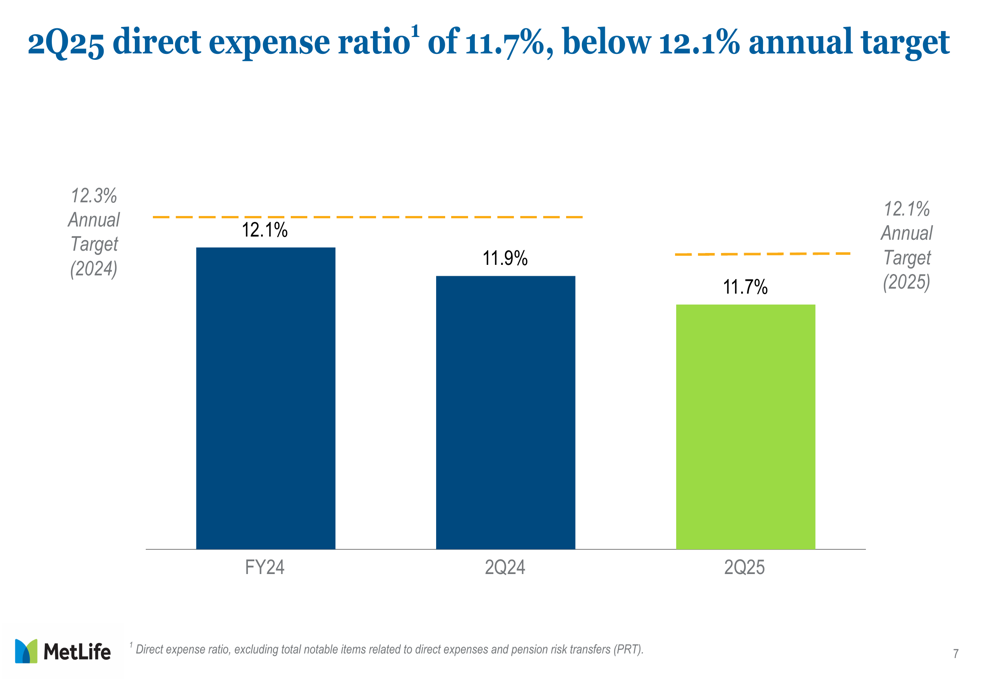
Despite challenges in investment income, MetLife demonstrated strong expense discipline. The company reported a direct expense ratio of 11.7% for Q2 2025, below both the previous year’s Q2 ratio of 11.9% and the 2025 annual target of 12.1%. This improvement reflects the company’s continued focus on operational efficiency.
Capital Management and Shareholder Returns
MetLife maintained a robust capital position in the second quarter, with holding company cash increasing to $5.2 billion, well above the company’s target buffer range of $3.0-$4.0 billion. This strong liquidity position enabled significant shareholder returns during the quarter.
The company returned $892 million to shareholders in Q2 2025, consisting of $510 million in share repurchases and $382 million in common stock dividends. Year-to-date share repurchases reached approximately $2.1 billion, including about $140 million in July 2025.
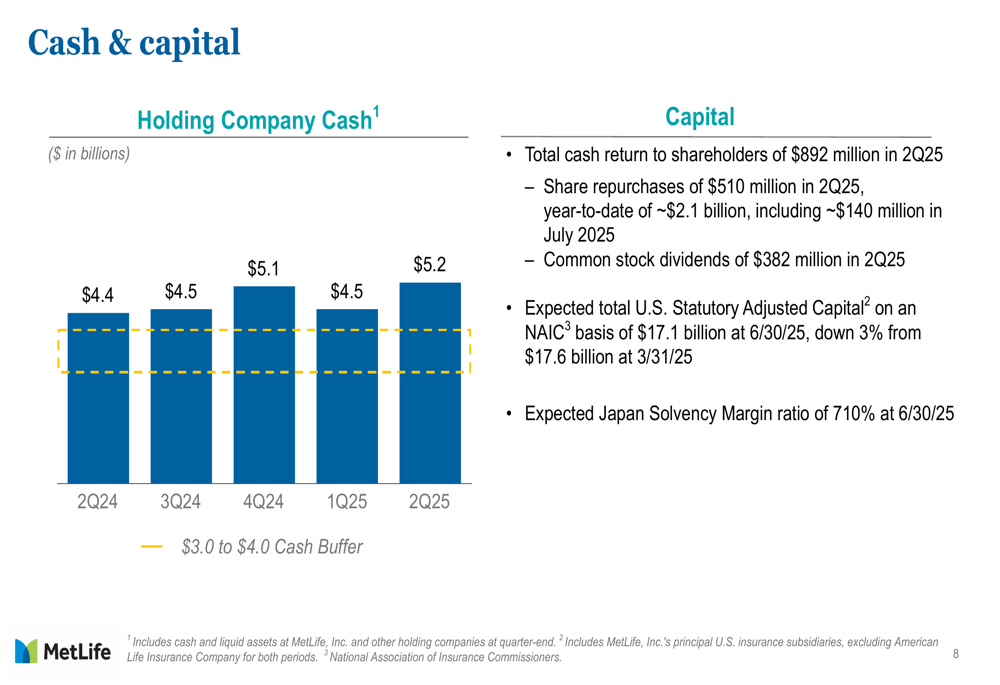
On the regulatory capital front, MetLife reported expected total U.S. Statutory Adjusted Capital of $17.1 billion as of June 30, 2025, representing a 3% decrease from $17.6 billion at the end of the previous quarter. Meanwhile, the expected Japan Solvency Margin ratio stood at a healthy 710%.
Investment Portfolio and Risk Management
MetLife’s commercial mortgage loan (CML) portfolio, valued at $46.7 billion, maintained strong quality metrics. The portfolio is characterized by concentration in high-quality assets in larger, primary markets, with an average Loan-to-Value (LTV) ratio of 69% and an average Debt Service Coverage Ratio (DSCR) of 2.0x.
The following chart illustrates the quality distribution of the CML portfolio:
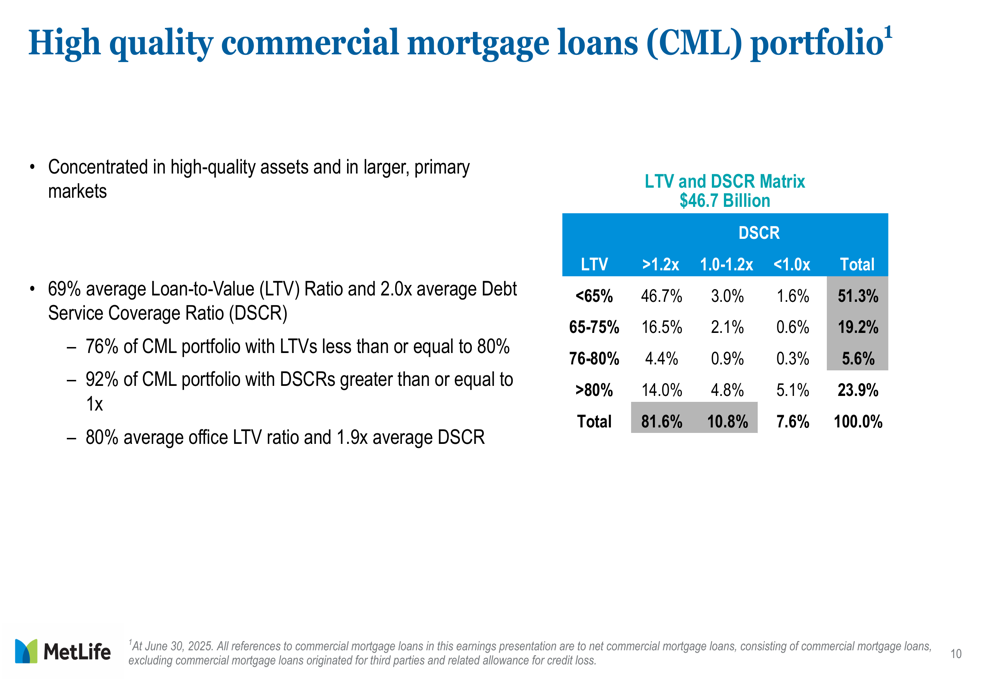
Notably, 81.6% of loans have a DSCR greater than 1.2x and an LTV less than 65%, indicating a conservative lending approach. Additionally, 76% of the CML portfolio has LTVs less than or equal to 80%, while 92% has DSCRs greater than or equal to 1x. The office segment, which has faced challenges in the commercial real estate market, maintains an average LTV ratio of 80% and an average DSCR of 1.9x.
Forward-Looking Statements
Building on the momentum from Q2 2025, MetLife appears well-positioned to continue executing its strategic initiatives. The company’s expense management discipline and strong capital position provide flexibility to navigate potential market volatility while continuing to return capital to shareholders.
The Q2 results represent an improvement from the first quarter’s performance, where MetLife missed EPS expectations but exceeded revenue forecasts. The current quarter’s adjusted EPS of $2.02 shows progress despite the headwinds in variable investment income.
As MetLife moves into the second half of 2025, investors will likely focus on the company’s ability to maintain operational efficiency while navigating investment market challenges. The continued strength in core business segments, particularly Group Benefits and RIS, provides a solid foundation for sustainable performance.
Full presentation:
This article was generated with the support of AI and reviewed by an editor. For more information see our T&C.