Gold soars to record high over $3,900/oz amid yen slump, US rate cut bets

Introduction & Market Context
MidWestOne Financial Group (NASDAQ:MOFG) presented its first quarter 2025 earnings results on April 25, showing substantial year-over-year improvement in profitability despite a slight sequential decline. The regional bank reported diluted earnings per share of $0.73, representing a 248% increase compared to the same period last year, though down 6% from the previous quarter.
The company’s stock closed at $28.46 on the day of the earnings release and moved up slightly in after-hours trading to $28.75, continuing the positive momentum seen after its strong Q4 2024 results. MidWestOne has been executing on its transformation strategy, which appears to be yielding significant improvements in profitability metrics and credit quality.
Quarterly Performance Highlights
MidWestOne reported total assets of $6.25 billion as of March 31, 2025, representing a slight increase of 0.3% from the previous quarter but a 7.3% decrease year-over-year. The company’s loan portfolio stood at $4.30 billion, down marginally by 0.3% quarter-over-quarter and 2.5% year-over-year, while deposits totaled $5.49 billion, up 0.2% from the previous quarter.
The bank’s profitability metrics showed significant improvement, with return on average assets reaching 1.00%, up 80 basis points year-over-year but down slightly by 3 basis points from the previous quarter. The efficiency ratio was 59.38%, representing a 32 basis point increase from Q4 2024.
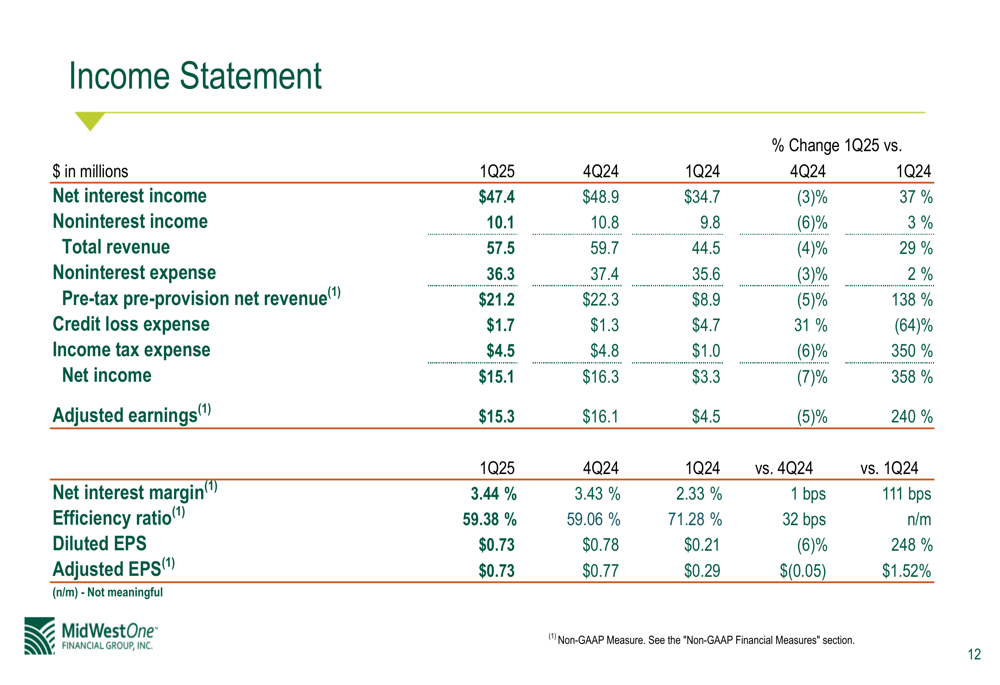
As shown in the following comprehensive financial highlights:
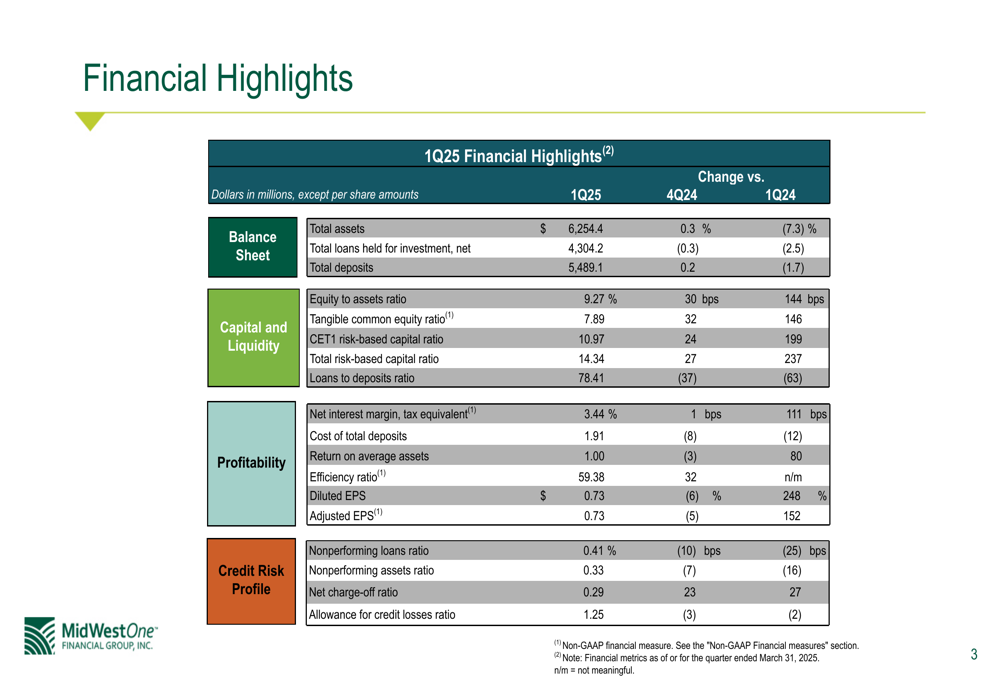
Net interest margin (tax equivalent) improved to 3.44%, up 111 basis points year-over-year and 1 basis point quarter-over-quarter, reflecting the company’s success in managing its balance sheet in the current interest rate environment. The cost of total deposits decreased to 1.91%, down 8 basis points from the previous quarter and 12 basis points year-over-year.
Strategic Initiatives
MidWestOne’s performance is being driven by five strategic pillars that form the foundation of its business model. These include exceptional customer and employee engagement, a strong core local banking model, sophisticated commercial banking and wealth management, specialty business lines, and improving operational effectiveness and efficiency.
The company’s strategic focus is illustrated in the following slide:
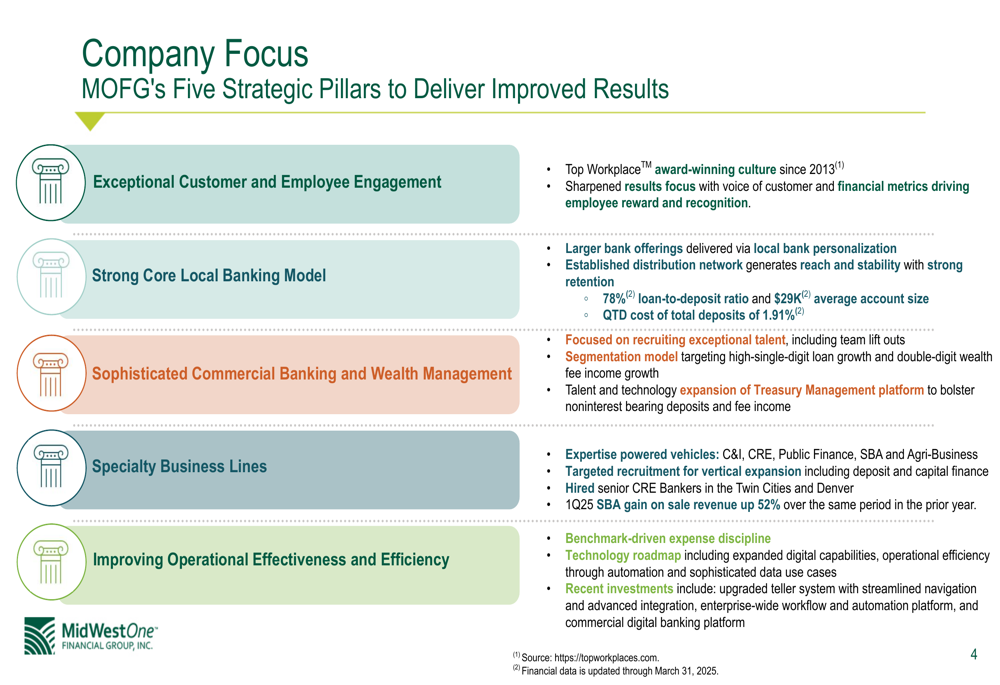
The bank has been recognized as a Top Workplace since 2013 and maintains a strong local banking model with a 78% loan-to-deposit ratio. MidWestOne is focusing on recruiting exceptional talent for its commercial banking and wealth management segments, with targeted recruitment for vertical expansion including deposit and capital finance.
Recent investments in technology include an upgraded teller system, an enterprise-wide workflow and automation platform, and a commercial digital banking platform, all aimed at improving operational efficiency.
Credit Quality and Portfolio Composition
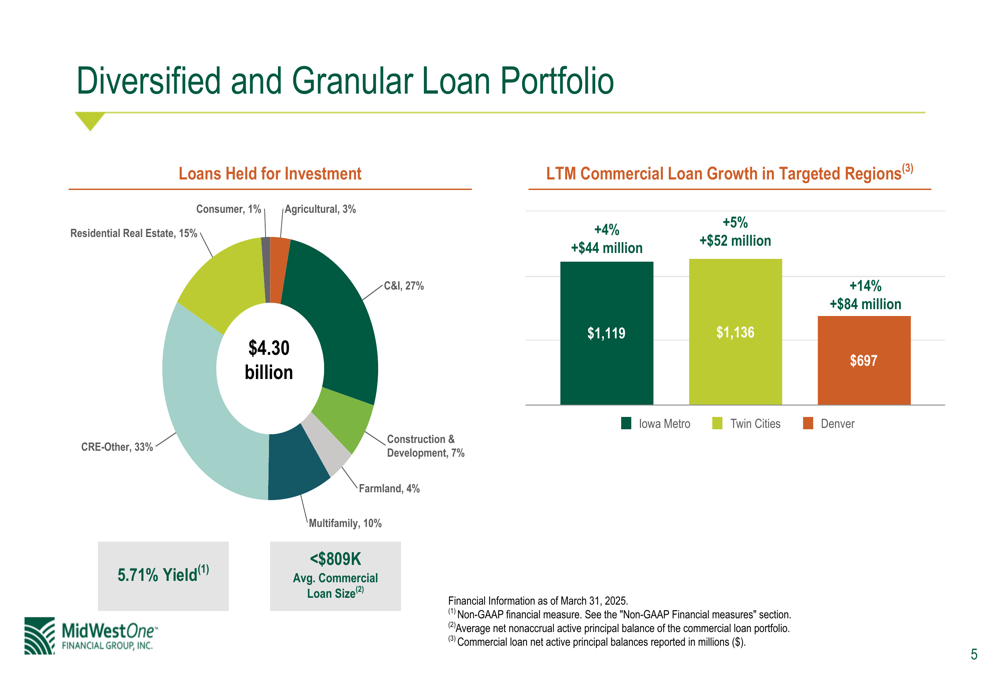
MidWestOne’s loan portfolio remains well-diversified, with commercial real estate (excluding owner-occupied) representing 33% of the total, commercial and industrial loans at 27%, and residential real estate at 15%. The company has experienced strong commercial loan growth in targeted regions, particularly in Denver (+14%, +$84 million), Twin Cities (+5%, +$52 million), and Iowa Metro (+4%, +$44 million).
The diversification of the loan portfolio is clearly illustrated in this chart:
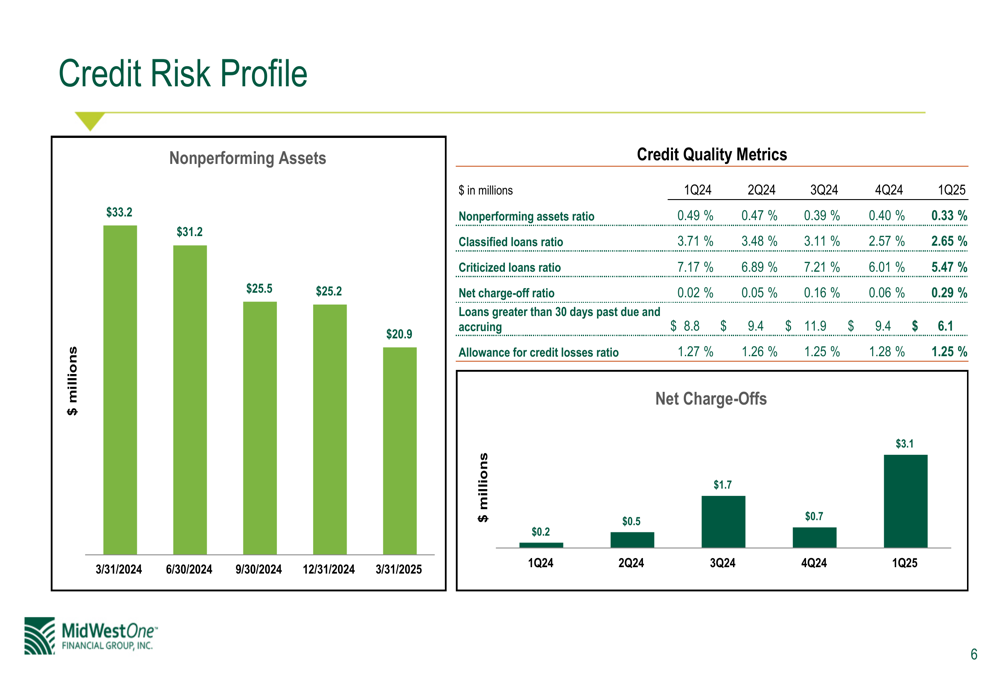
Credit quality metrics have shown improvement, with nonperforming assets declining to $20.9 million as of March 31, 2025, down from $25.2 million at the end of 2024 and $33.2 million a year earlier. The nonperforming assets ratio improved to 0.33%, down 7 basis points quarter-over-quarter and 16 basis points year-over-year.
However, net charge-offs increased to $3.1 million in Q1 2025, compared to $0.7 million in Q4 2024 and $0.2 million in Q1 2024, resulting in a net charge-off ratio of 0.29%, up 23 basis points quarter-over-quarter and 27 basis points year-over-year.
The following slide illustrates the improving trend in nonperforming assets and credit quality metrics:
The company’s commercial real estate portfolio represents 216% of total capital, well below the regulatory threshold of 300% and down from 224% in Q4 2024 and 251% in Q1 2024. Non-owner occupied CRE office loans represent only 3.1% of the total loan portfolio, limiting exposure to a segment that has faced challenges in the current market environment.
Wealth Management Growth
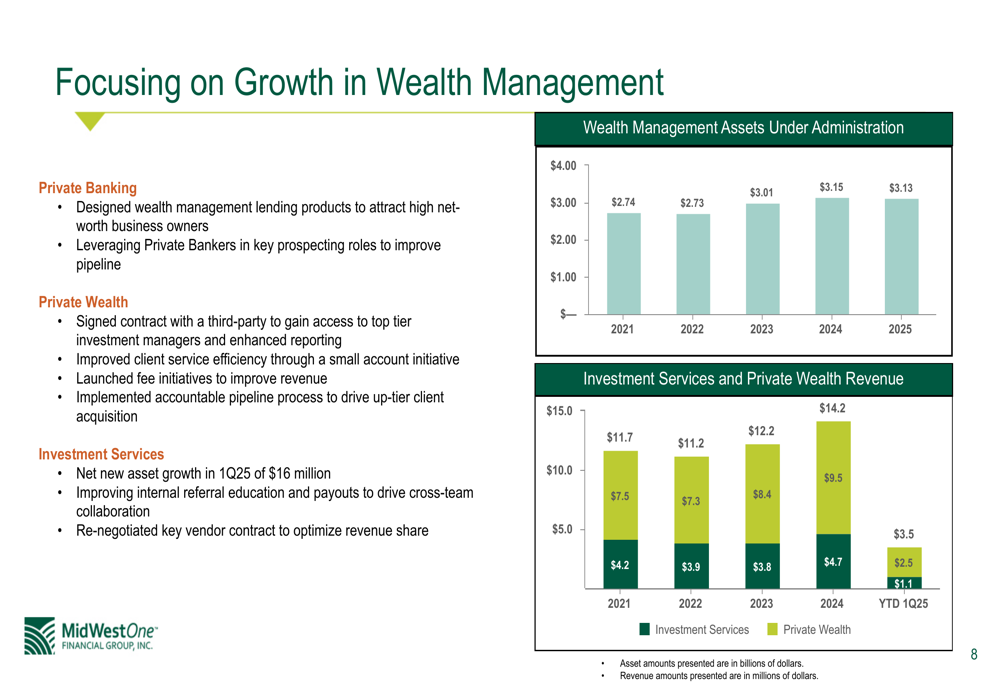
MidWestOne has been focusing on growing its wealth management segment, with assets under administration reaching $3.13 billion as of Q1 2025. Investment services and private wealth revenue has shown steady growth, with year-to-date Q1 2025 revenue of $2.5 million for investment services and $3.5 million for private wealth.
The company’s wealth management initiatives include designed wealth management lending, leveraging private bankers, improved client service, and fee initiatives. Investment services have achieved net new asset growth of $16 million and renegotiated a key vendor contract.
The growth in wealth management assets and revenue is illustrated in the following chart:
Income Statement and Balance Sheet
MidWestOne reported net interest income of $47.4 million for Q1 2025, with noninterest income of $10.1 million, resulting in total revenue of $57.5 million. Noninterest expense was $36.3 million, leading to pre-tax pre-provision net revenue of $21.2 million. After credit loss expense of $1.7 million and income tax expense of $4.5 million, net income was $15.1 million, or $0.73 per diluted share.
The company’s key income statement metrics are presented in this comprehensive table:
On the balance sheet side, MidWestOne reported loans of $4.30 billion, investment securities of $1.31 billion, and deposits of $5.49 billion as of March 31, 2025. Shareholders’ equity stood at $579.6 million, with tangible book value per share of $23.36 and a common equity Tier 1 capital ratio of 10.97%.
Forward-Looking Statements
Building on the momentum from its strong Q4 2024 results, when the company beat EPS forecasts with $0.77 per share against expectations of $0.69, MidWestOne continues to execute on its transformation strategy. The Q1 2025 results show significant year-over-year improvement in profitability metrics, though with a slight sequential decline.
The company’s focus on its five strategic pillars, targeted growth in key markets, and improving operational efficiency positions it well for continued performance improvement. The strengthening capital position, improving credit quality metrics, and growth in wealth management provide a solid foundation for future growth.
While net charge-offs have increased, the overall credit quality trends remain positive, with declining nonperforming assets and a well-diversified loan portfolio with limited exposure to higher-risk segments such as office commercial real estate.
As MidWestOne continues to execute on its strategic initiatives, investors will be watching for sustained improvement in profitability metrics, continued growth in targeted markets, and the impact of technology investments on operational efficiency.
Full presentation:
This article was generated with the support of AI and reviewed by an editor. For more information see our T&C.