ION expands ETF trading capabilities with Tradeweb integration

MSC Industrial Direct Company Inc. (NYSE:MSM) presented its fiscal fourth quarter and full year 2025 earnings results on October 23, 2025, highlighting a return to sales growth after earlier softness in the fiscal year. The company's shares rose 4.39% following the release, reflecting investor confidence in the improving trajectory.
Quarterly Performance Highlights
MSC reported fourth quarter net sales of $978.2 million, up from $952.3 million in the same period last year, with average daily sales (ADS) increasing 2.7% year-over-year. This growth was primarily driven by pricing actions and improving volumes. The company's adjusted earnings per diluted share reached $1.09, compared to $1.03 in Q4 2024, exceeding analyst expectations of $1.01.
As shown in the following detailed financial results, gross margin declined 60 basis points year-over-year to 40.4%, while adjusted operating margin decreased 70 basis points to 9.2%:
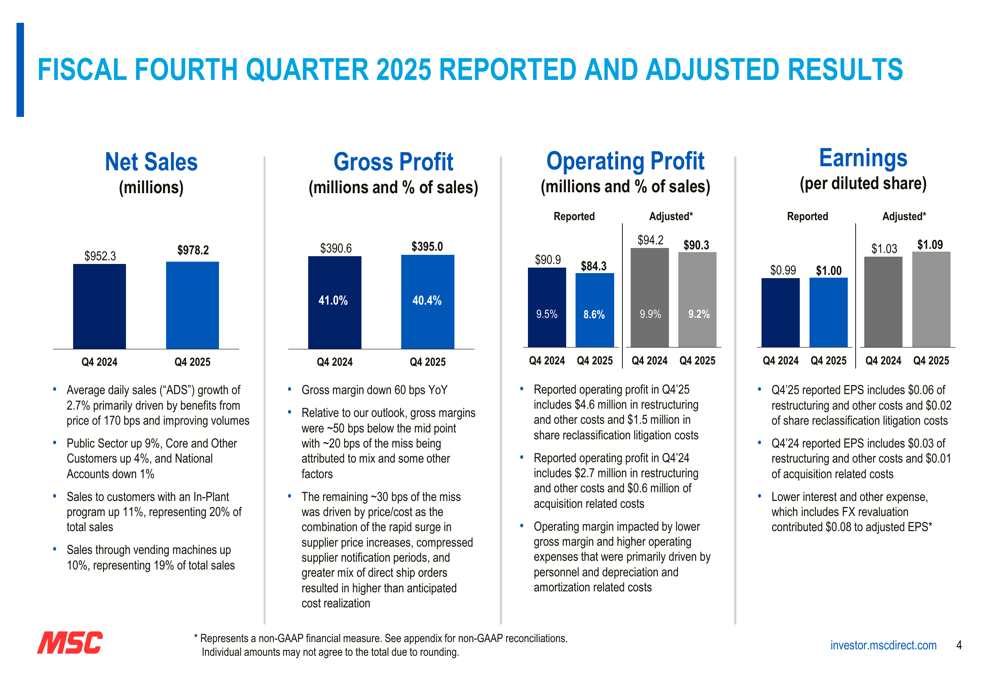
Despite these margin pressures, MSC's quarterly performance demonstrated resilience, with operating profit remaining above expectations. The company attributed the margin compression to faster-than-anticipated higher cost inventories flowing through the income statement.
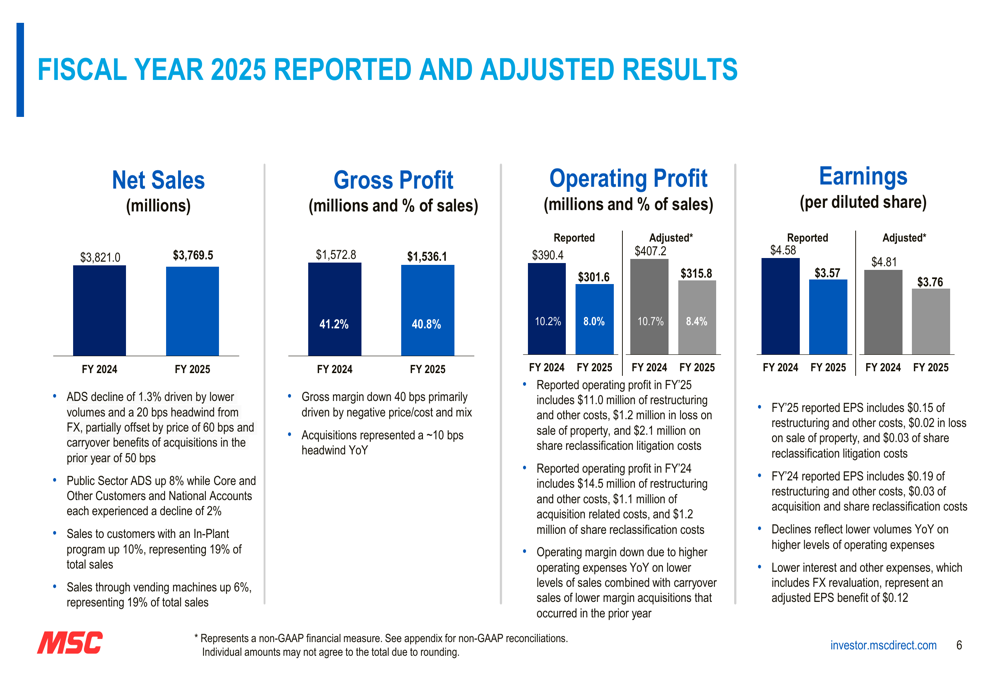
For the full fiscal year 2025, MSC reported net sales of $3,769.5 million, down from $3,821.0 million in fiscal 2024, reflecting a 1.3% decline in average daily sales due to first-half softness. Full-year adjusted earnings per share came in at $3.76, compared to $4.81 in the previous year.
Financial Health and Capital Allocation
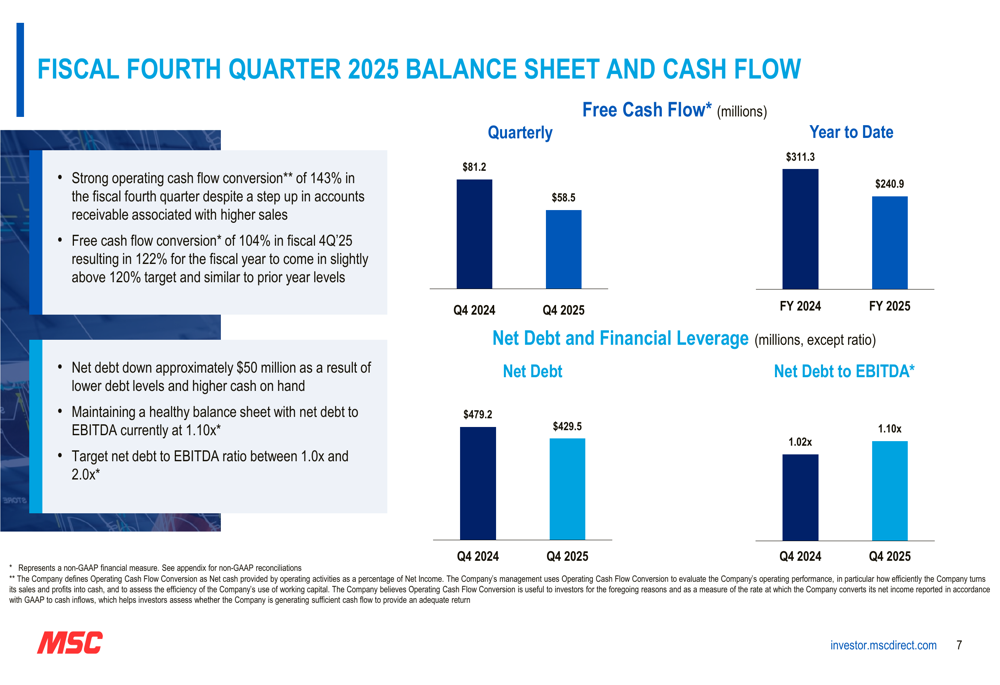
MSC maintained strong cash flow generation, with free cash flow conversion reaching 122% of net income for the fiscal year, slightly ahead of target. The company generated $240.9 million in free cash flow for fiscal 2025, down from $311.3 million in the previous year but still representing robust conversion.
The company's balance sheet remained healthy, with net debt decreasing by approximately $50 million to $429.5 million. The net debt to EBITDA ratio stood at 1.10x, up slightly from 1.02x in the previous year but still indicating a strong financial position.
As illustrated in the following chart, MSC maintained strong cash flow metrics in the fourth quarter:
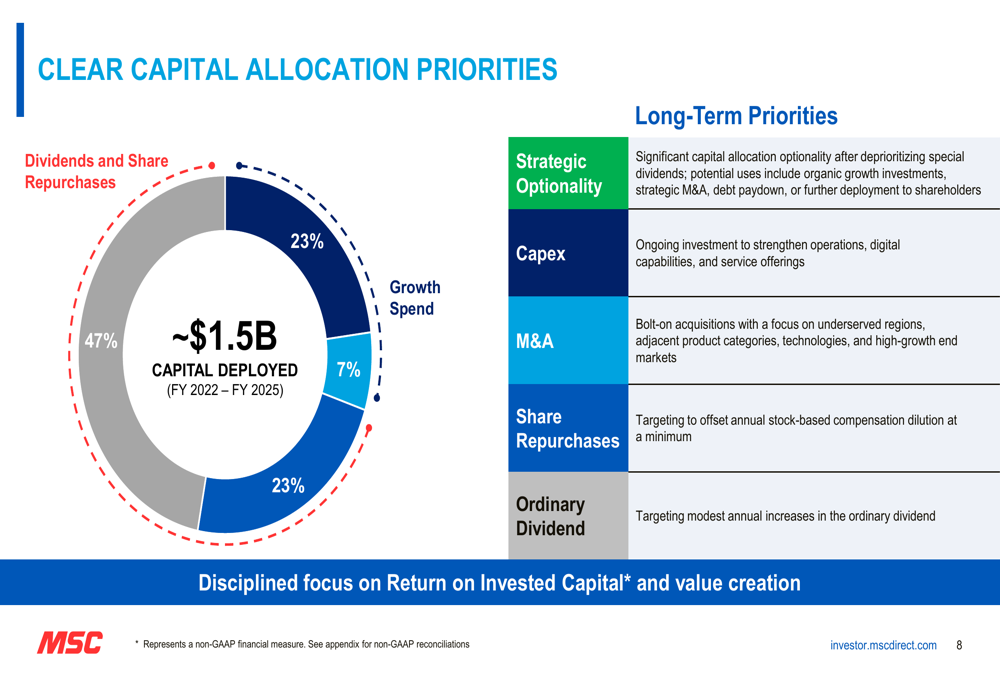
The company's capital allocation strategy remained focused on balancing shareholder returns with investments for growth. MSC returned approximately $229 million to shareholders through dividends and share repurchases in fiscal 2025, including the repurchase of approximately 496,000 shares.
The following chart illustrates MSC's capital allocation priorities from fiscal 2022 through 2025:
Strategic Initiatives Gaining Momentum
MSC highlighted early momentum in its growth initiatives across various customer segments. The company's Core and Other Customers segment returned to growth in Q4 2025, with average daily sales increasing 4.1% year-over-year. This improvement followed the implementation of web enhancements, marketing campaigns, and territory redesign initiatives.
The following charts demonstrate the improving trends across customer segments:
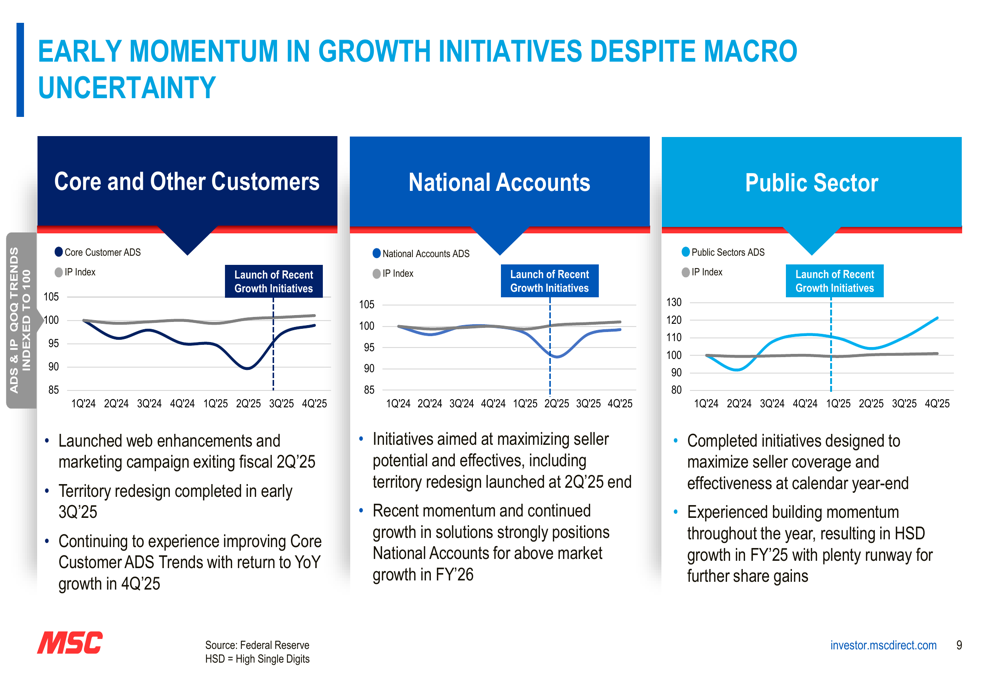
Operational metrics also showed improvement, with vending machine installations up 10% year-over-year and in-plant program count increasing 20%. Customer location touches by field sales representatives grew by double digits year-over-year, while sales per representative per day increased by mid-single digits both sequentially and year-over-year.
MSC also strengthened its leadership team with the addition of Jahida Nadi as SVP of Sales and Kim Shacklett as SVP Customer Experience, bringing extensive industry experience to help drive the company's growth strategy.
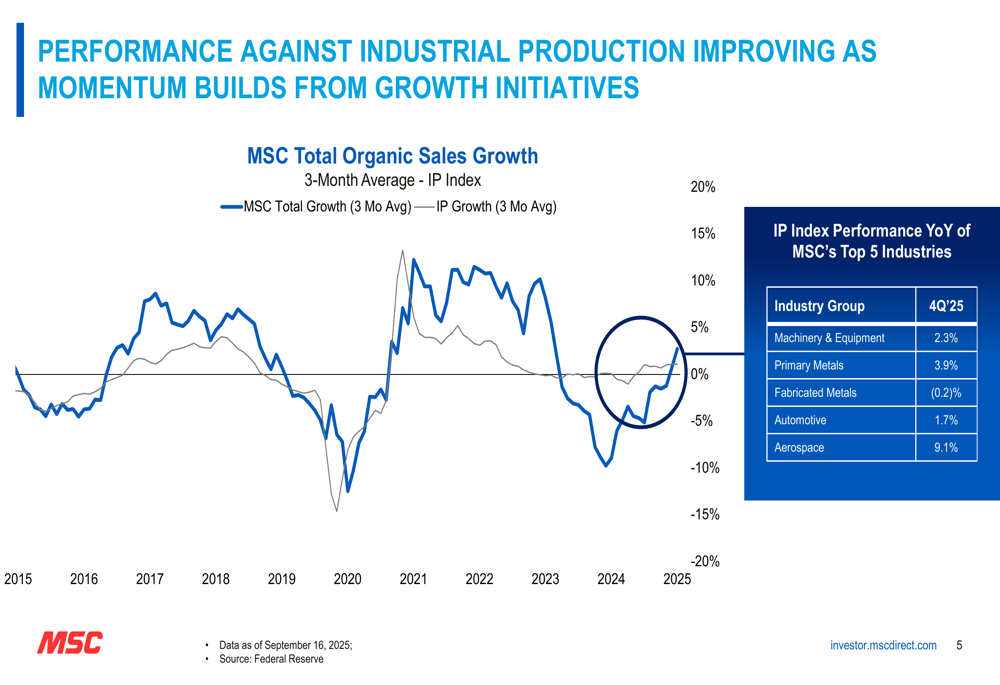
Industry Context and Performance
MSC's performance showed improvement relative to the broader Industrial Production (IP) index. The company's top five industries displayed mixed results in the fourth quarter, with Aerospace leading growth at 9.1% year-over-year, while Fabricated Metals declined slightly by 0.2%.
Forward-Looking Statements
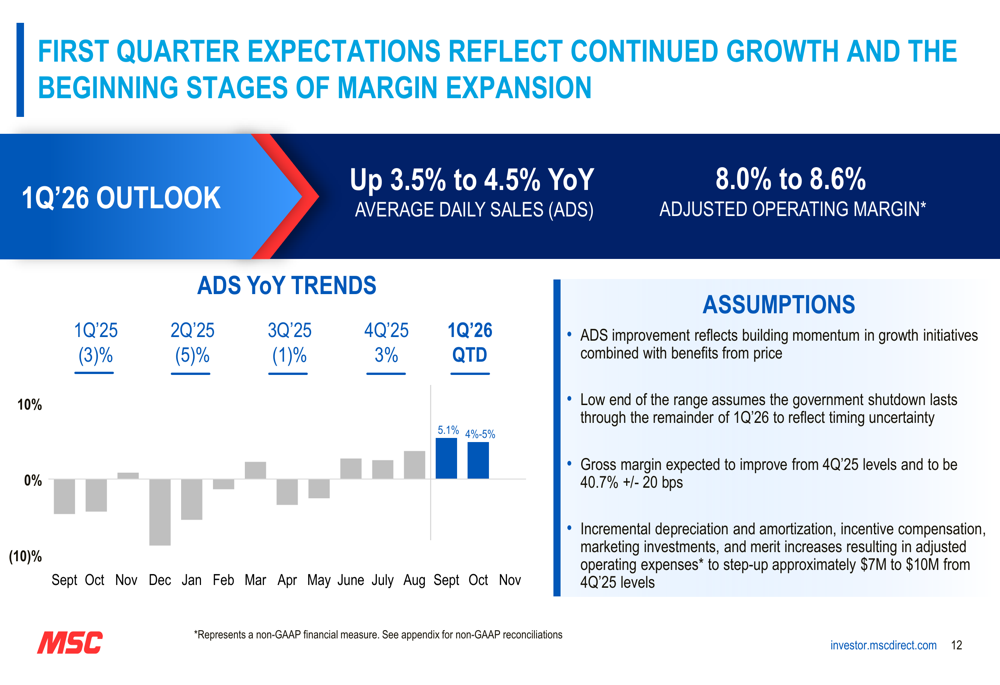
Looking ahead to the first quarter of fiscal 2026, MSC expects continued growth momentum. The company projects average daily sales to increase by 3.5% to 4.5% year-over-year, with adjusted operating margin ranging from 8.0% to 8.6%.
The following slide outlines MSC's Q1 2026 expectations:
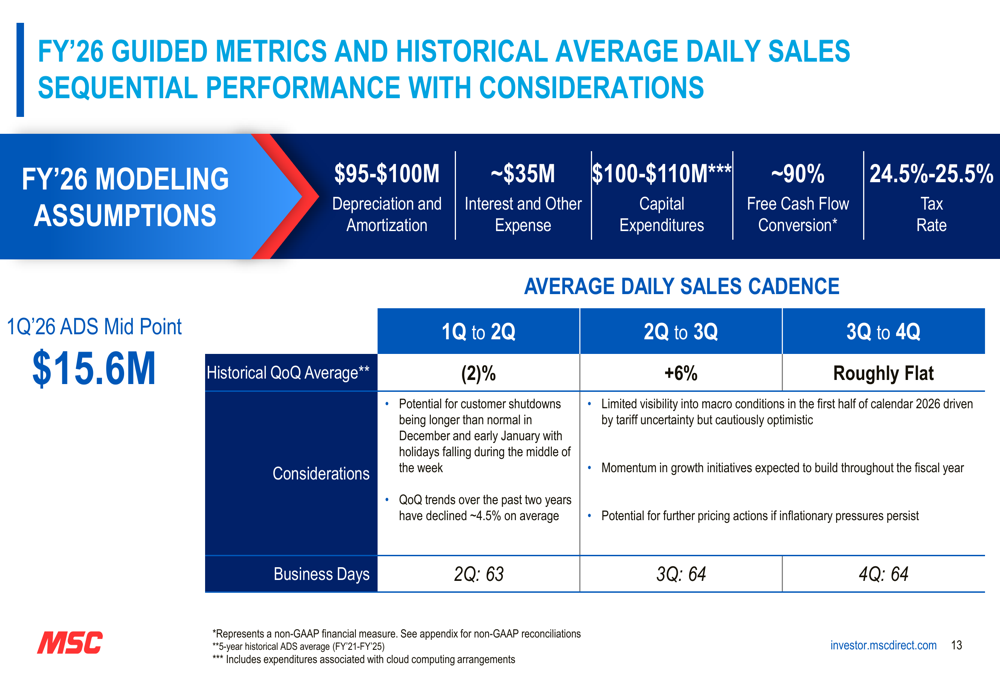
For the full fiscal year 2026, MSC provided several modeling assumptions, including depreciation and amortization of $95-100 million, capital expenditures of $100-110 million, and free cash flow conversion of approximately 90%. The company anticipates a tax rate of 24.5%-25.5% and interest and other expense of approximately $35 million.
MSC's CEO Erik Gershwind expressed confidence in the company's strategic direction, noting progress across multiple fronts despite an uncertain environment. Incoming CEO Martina McIsaac emphasized the company's intention to address inflationary pressures as they arise.
The company's presentation highlighted both achievements and challenges, providing a balanced view of its current position and future prospects. While margin pressures remain a concern, the return to sales growth, strong cash flow generation, and early success in strategic initiatives suggest a positive trajectory heading into fiscal 2026.
Full presentation:
This article was generated with the support of AI and reviewed by an editor. For more information see our T&C.