TSX jumps amid Fed rate cut hopes, ongoing U.S. government shutdown

Introduction & Market Context
NBT Bancorp Inc . (NASDAQ:NBTB) has released its second quarter 2025 earnings presentation, highlighting significant growth driven by the successful completion of its merger with Evans Bancorp (NYSE:EVBN). The regional bank, which closed at $41.47 on July 28, 2025, up 0.22% for the day, reported substantial increases in assets, loans, and deposits following the May 2 acquisition.
The presentation reveals how the strategic merger has expanded NBT’s footprint in western New York, particularly in the Buffalo and Rochester markets, while delivering positive operating leverage with revenue growth outpacing expense growth both sequentially and year-over-year.
Quarterly Performance Highlights
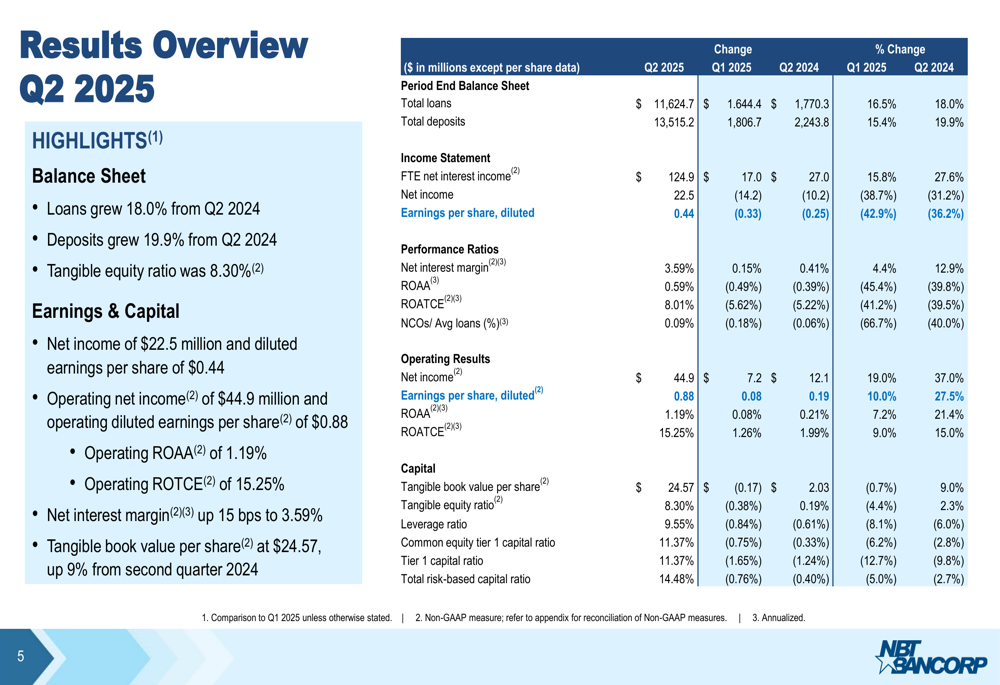
NBT reported net income of $22.5 million for Q2 2025, with diluted earnings per share of $0.44. On an operating basis, which excludes merger-related expenses, net income reached $44.9 million with earnings per share of $0.88. This represents a slight increase from the Q1 2025 operating EPS of $0.80 reported earlier this year.
The bank’s return on average tangible common equity (ROATCE) stood at 8.01% on a reported basis and 15.25% on an operating basis. Total (EPA:TTEF) revenue climbed to $171 million, while tangible book value per share reached $24.57, representing a 203 basis point increase compared to Q2 2024.
As shown in the following comprehensive results overview:
Evans Merger Impact
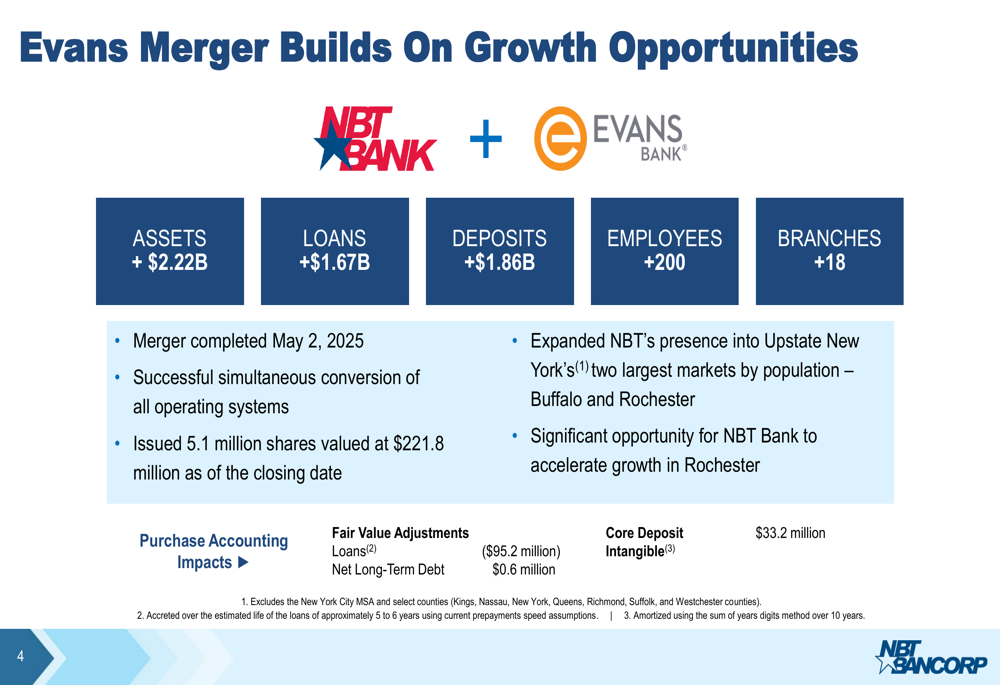
The Evans Bancorp merger, completed on May 2, 2025, has significantly transformed NBT’s balance sheet and market presence. The acquisition added $2.22 billion in assets, $1.67 billion in loans, and $1.86 billion in deposits to NBT’s portfolio. Additionally, the merger brought 18 new banking offices and approximately 200 employees into the NBT organization.
To complete the transaction, NBT issued 5.1 million shares valued at $221.8 million. While the merger resulted in fair value loan adjustments of ($95.2 million), it also created a core deposit intangible of $33.2 million, reflecting the value of the acquired deposit relationships.
The following slide illustrates the key benefits and financial impacts of the Evans merger:
Loan and Deposit Analysis
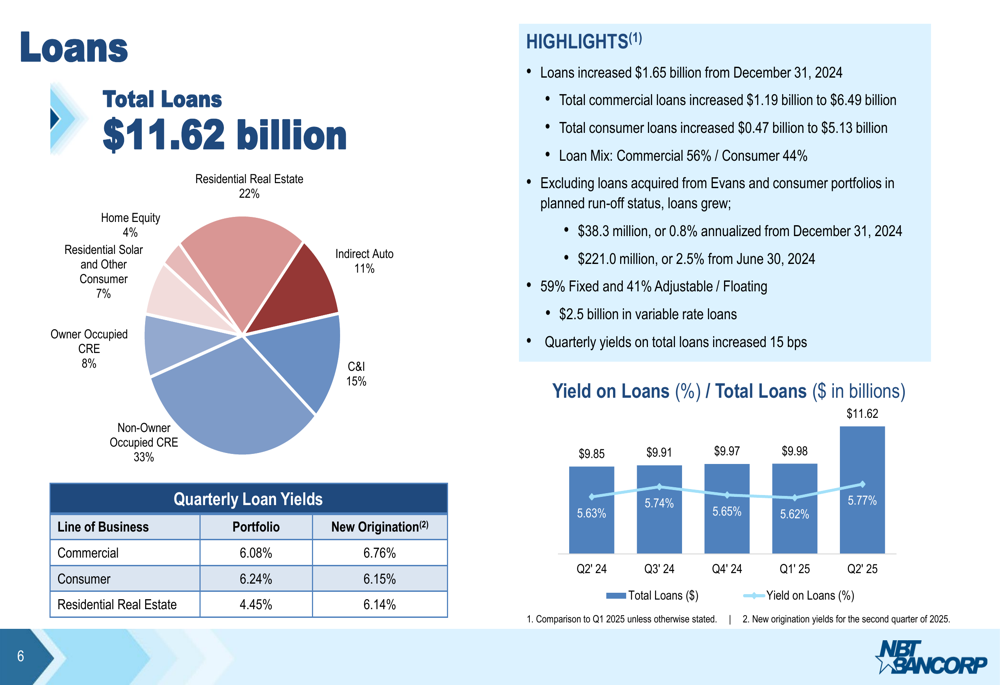
NBT’s total loan portfolio expanded to $11.62 billion, representing an 18.0% increase from Q2 2024, largely driven by the Evans acquisition. The portfolio remains well-diversified, with commercial real estate (both owner-occupied and non-owner-occupied) comprising 41% of total loans, residential real estate at 22%, and commercial & industrial loans at 15%.
Loan yields improved to 5.77% in Q2 2025, up from 5.62% in the previous quarter. New origination yields were particularly strong in the commercial segment at 6.76% and residential real estate at 6.14%, indicating the bank’s ability to maintain pricing discipline in the current rate environment.
The loan portfolio composition and yield trends are illustrated in the following chart:
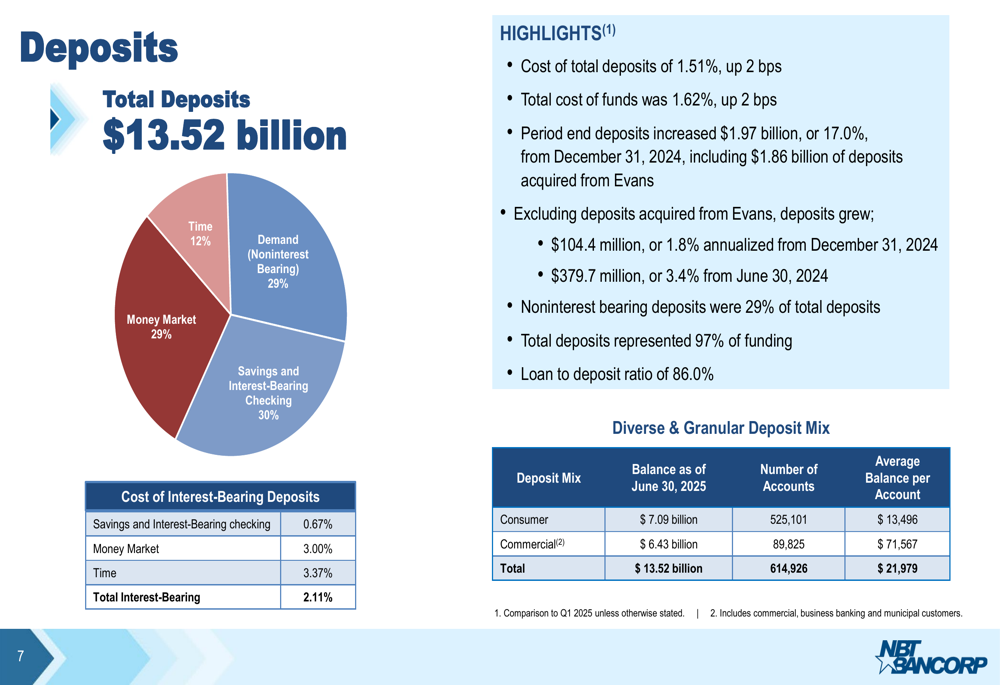
On the funding side, total deposits grew to $13.52 billion, a 19.9% increase from Q2 2024. The deposit base remains well-balanced with noninterest-bearing demand deposits accounting for 29% of the total, while savings and interest-bearing checking represent 30%, money market accounts 29%, and time deposits 12%.
The cost of total deposits was 1.51% in Q2, up just 2 basis points from the previous quarter, demonstrating the bank’s effective deposit cost management despite the competitive funding environment. The loan-to-deposit ratio stood at a healthy 86.0%.
The following chart details NBT’s deposit composition and customer segmentation:
Net Interest Income and Margin
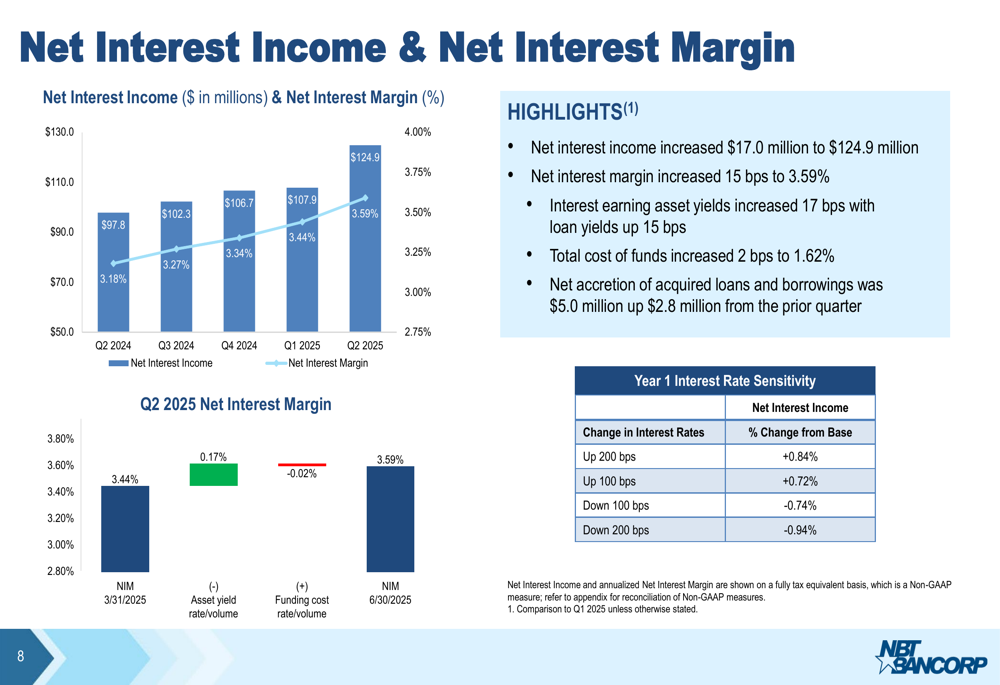
NBT reported strong improvement in its core banking metrics, with net interest income increasing by $17.0 million to $124.9 million in Q2 2025. The net interest margin expanded by 15 basis points to 3.59%, driven by a 17 basis point increase in interest-earning asset yields, while the total cost of funds rose by just 2 basis points to 1.62%.
This margin expansion reflects NBT’s successful balance sheet management and the positive impact of the Evans acquisition. The bank’s interest rate sensitivity position suggests it is well-positioned for various rate environments.
The following chart illustrates the trends in net interest income and margin:
Noninterest Income and Expense
Noninterest income reached $46.8 million in Q2 2025, representing an increase of $3.5 million or 8% from Q2 2024. This growth was broad-based across multiple business lines, with retirement plan administration fees up 6.2%, wealth management fees up 5.0%, and insurance revenues up 6.5%. Notably, noninterest income contributed 27% of total revenue, which the company highlighted as above peer levels.
On the expense side, noninterest expenses increased primarily due to the Evans acquisition and the timing of planned initiatives. Salaries and benefits rose by 5.7%, driven by the addition of Evans employees, while the amortization of intangible assets increased due to the new core deposit intangible from the merger.
Asset Quality
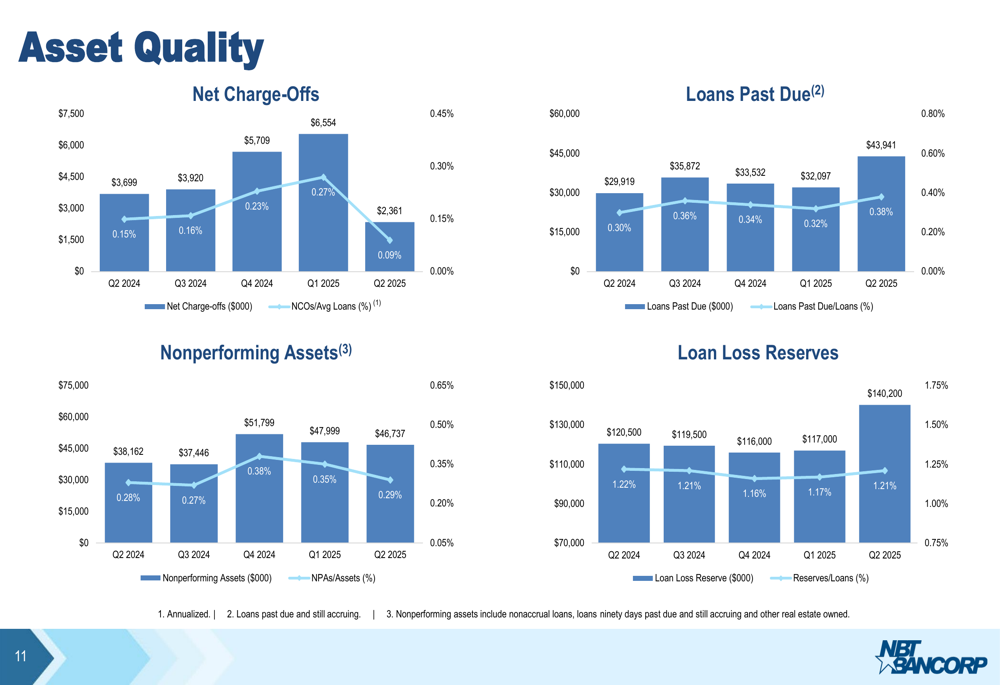
Despite the significant expansion of its loan portfolio, NBT maintained strong asset quality metrics in Q2 2025. The presentation highlighted stable trends in nonperforming assets, past due loans, and net charge-offs, indicating prudent risk management through the merger integration process.
The loan loss reserve increased to accommodate the expanded loan portfolio, with different reserve levels maintained across various loan segments based on their risk profiles. The commercial real estate portfolio, which represents the largest segment of NBT’s loans, appears well-diversified across different property types, reducing concentration risk.
The following charts provide a comprehensive view of NBT’s asset quality metrics:
Strategic Positioning and Outlook
The Evans merger has strengthened NBT’s competitive position in western New York, particularly in the Buffalo and Rochester markets. This expansion aligns with the bank’s strategy of growing in attractive markets while maintaining its community banking focus.
The presentation suggests that NBT is focused on leveraging its diversified revenue streams, with noninterest income sources such as wealth management, insurance, and retirement plan administration complementing traditional banking services. This diversification provides some insulation from net interest margin pressures that may affect the banking industry.
NBT’s peer group consists of 18 regional banks with similar business models and market capitalizations, providing context for its performance metrics. The bank’s operating return on average tangible common equity of 15.25% and operating return on average assets of 1.19% appear competitive within this peer set.
While the presentation does not provide specific forward guidance, the positive operating leverage demonstrated in Q2 2025 suggests that NBT is well-positioned to continue delivering solid financial results as it completes the integration of Evans Bancorp and pursues additional growth opportunities in its expanded footprint.
Full presentation:
This article was generated with the support of AI and reviewed by an editor. For more information see our T&C.