Intel stock spikes after report of possible US government stake

Northeast Bank (NASDAQ:NBN) reported strong third-quarter fiscal year 2025 results, with net income reaching $18.7 million and significant deposit growth, according to the company’s investor presentation on April 30, 2025.
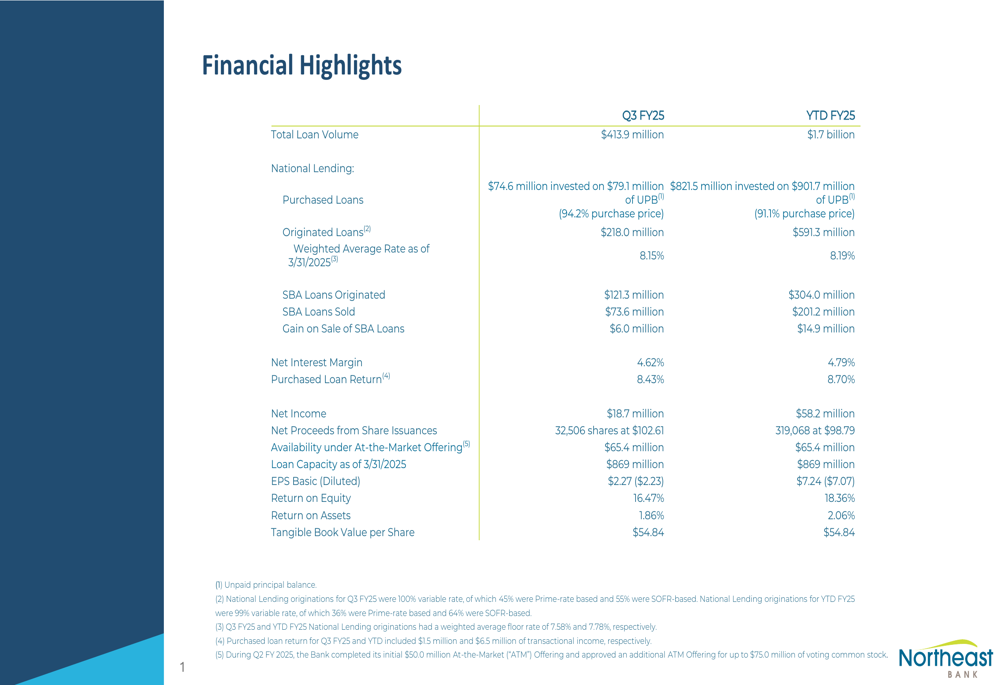
Quarterly Performance Highlights
Northeast Bank delivered diluted earnings per share of $2.23 for the third quarter, contributing to a year-to-date figure of $7.07. The bank’s tangible book value per share stood at $54.84, reflecting its solid capital position.
Total (EPA:TTEF) loan volume for Q3 FY25 reached $413.9 million, with year-to-date volume of $1.7 billion. The bank maintained a healthy net interest margin of 4.62% for the quarter, while purchased loan returns came in at 8.43%.
As shown in the following comprehensive financial overview, Northeast Bank’s performance remained strong across key metrics:
Loan Portfolio and Asset Quality
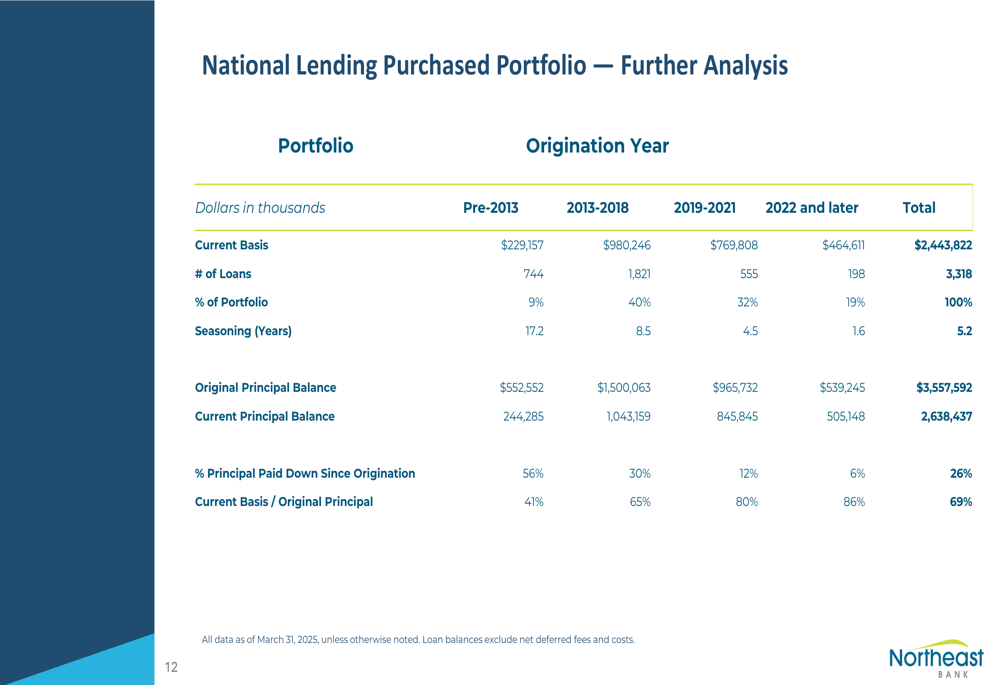
Northeast Bank’s loan portfolio totaled $3.74 billion as of March 31, 2025, with the National Lending Division accounting for the vast majority at $3.63 billion. The portfolio maintained a conservative weighted average loan-to-value ratio of 50%, indicating prudent risk management.
The following breakdown illustrates the composition of the bank’s loan portfolio:
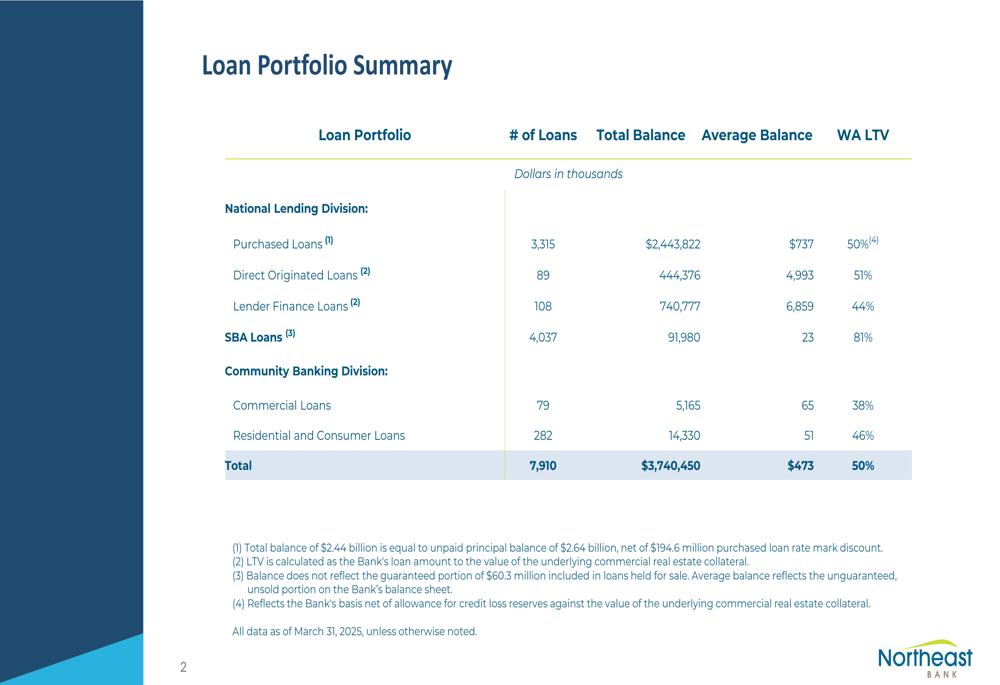
The bank’s National Lending portfolio showed continued growth, with originations of $218.0 million and purchases of $74.6 million during the quarter, partially offset by run-off.
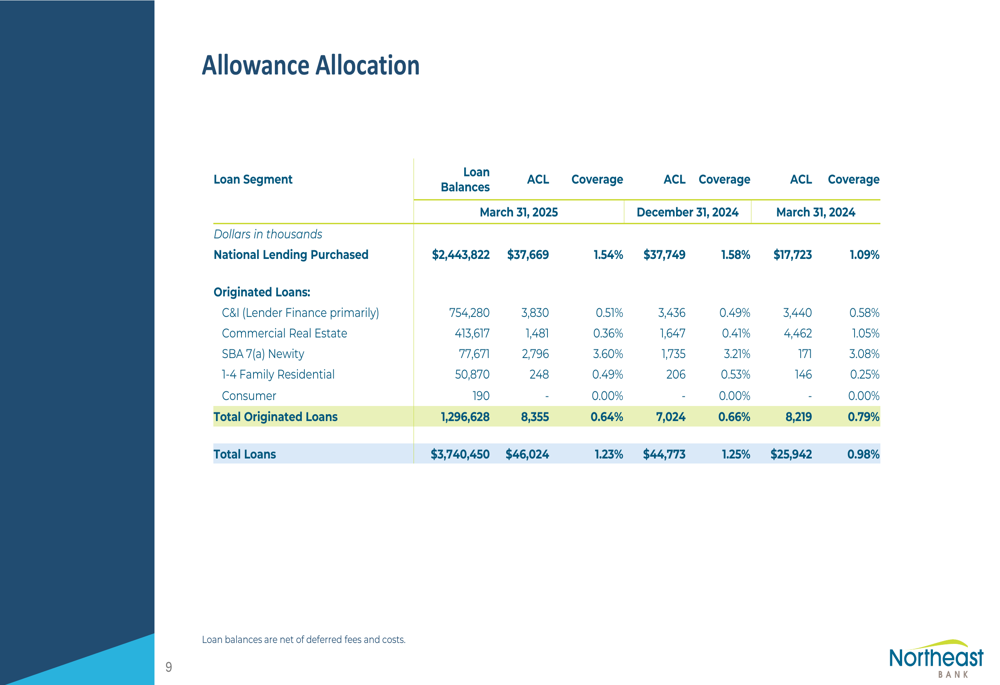
Asset quality metrics remained stable, with nonperforming assets at 0.79% of total assets and nonperforming loans at 0.86% of total loans. The allowance for credit losses stood at 1.23% of gross loans, relatively unchanged from 1.25% in the previous quarter.
The following chart details the bank’s allowance allocation across different loan segments:
Deposit Growth and Funding
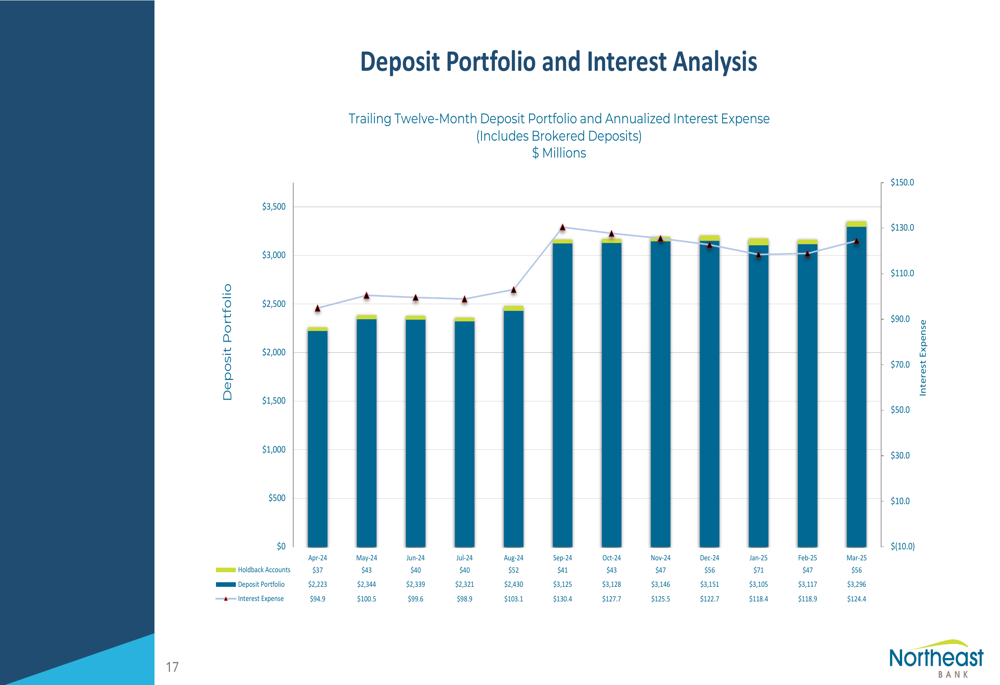
One of the most impressive aspects of Northeast Bank’s performance was its deposit growth. Total deposits reached $3.30 billion as of March 31, 2025, representing a 48% increase from $2.23 billion a year earlier.
Notably, the bank has successfully reduced its cost of deposits to 3.92% in Q3 FY25, down from 4.15% in the previous quarter and 4.31% a year ago. The quarter-end cost of deposits was even lower at 3.77%, suggesting continued improvement in funding costs.
The following table provides a detailed view of the bank’s deposit portfolio changes:
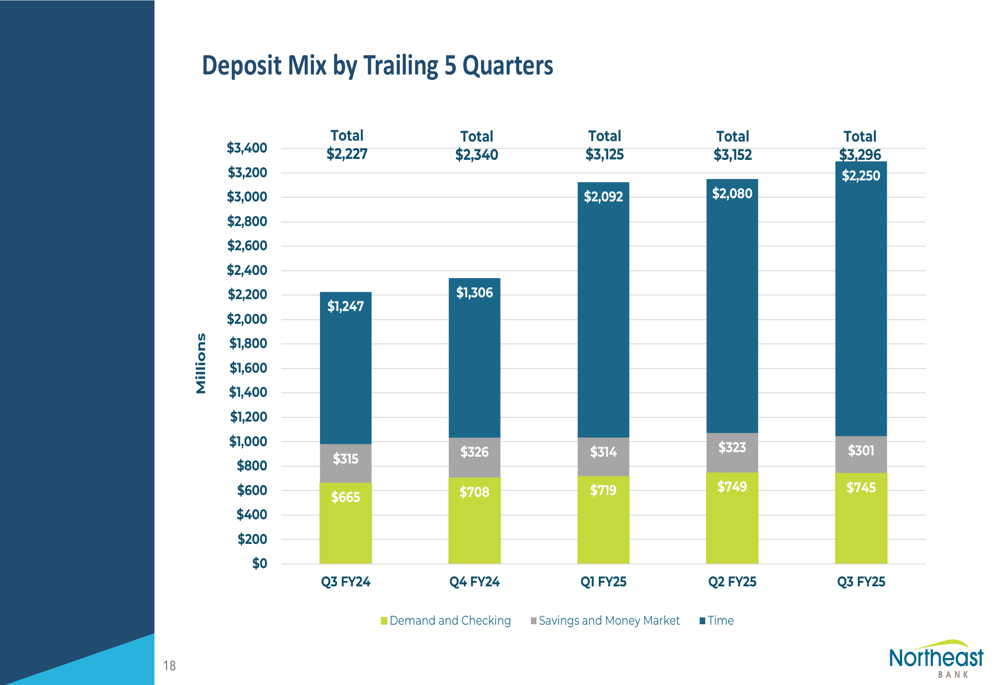
The deposit mix has shifted significantly over the past year, with time deposits growing substantially. This strategic shift in funding sources has supported the bank’s loan growth while maintaining efficient funding costs.
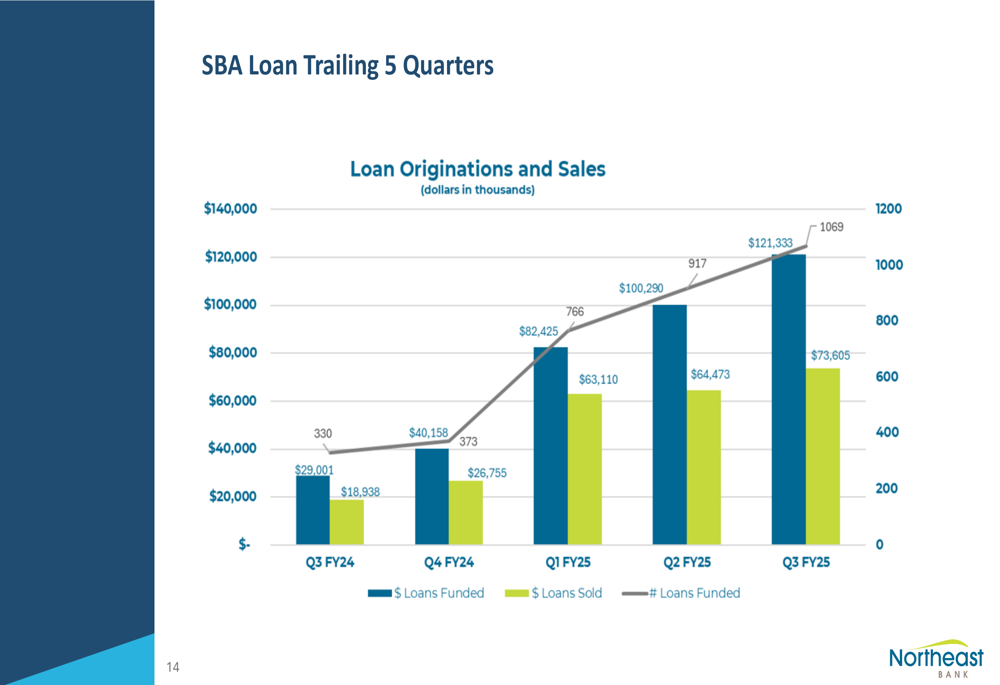
SBA (LON:SBA) Lending Momentum
Northeast Bank’s SBA lending program showed remarkable growth, with $121.3 million in loans originated during Q3 FY25, up from $100.3 million in the previous quarter and significantly higher than the $29.0 million reported in Q3 FY24.
The bank sold $73.6 million in SBA loans during the quarter, generating gains on sale of $6.0 million. Year-to-date, the bank has originated $304.0 million in SBA loans and sold $201.2 million, resulting in gains of $14.9 million.
The following chart illustrates the strong upward trajectory in SBA loan originations and sales:
This growth aligns with the bank’s strategic focus on small balance SBA loans, which was highlighted in the previous quarter’s earnings call. The bank’s partnership with NEWITY for SBA loan servicing, which was extended for another five years as mentioned in the Q1 earnings call, appears to be yielding positive results.
Revenue and Profitability
Northeast Bank reported total revenue of $52.6 million for Q3 FY25, slightly down from $54.4 million in the previous quarter but significantly higher than the $38.1 million reported in Q3 FY24. Non-interest expense increased to $20.1 million, reflecting the bank’s continued investments in growth initiatives.
The following chart shows the bank’s revenue and non-interest expense trends over the past five quarters:
The bank’s loan performance has remained strong, with a total return of 8.52% on its National Lending portfolio in Q3 FY25. This includes 8.34% from regularly scheduled interest and accretion, plus 0.18% from accelerated accretion, interest, and fees recognized on loan payoffs.
The following chart illustrates the bank’s loan performance and average loan balances:
Forward Outlook
While the presentation did not include explicit forward-looking statements, the bank’s consistent performance and strategic focus on high-yielding loan segments suggest a positive outlook. The decreasing cost of deposits, combined with strong loan yields, positions Northeast Bank well for continued profitability.
The bank’s conservative loan-to-value ratios and stable asset quality metrics indicate a prudent approach to risk management, which should serve it well in navigating potential economic uncertainties.
Northeast Bank’s stock closed at $89.81 on April 29, 2025, down 2.81% from the previous close of $92.41, according to the provided fundamentals data. The stock has traded between $51.50 and $110.35 over the past 52 weeks, suggesting significant volatility but also substantial upside potential based on the bank’s strong financial performance.
Full presentation:
This article was generated with the support of AI and reviewed by an editor. For more information see our T&C.