Dimon says U.S. stocks facing higher risk of a serious fall - BBC

Introduction & Market Context
Olav Thon Eiendomsselskap (OB:OLT), Norway’s leading shopping center operator, presented its second quarter and first half 2025 results on August 14, 2025. The company reported a satisfactory performance despite headwinds from negative value adjustments on financial instruments and increased maintenance costs. The stock is currently trading at 297 NOK, down 1.98% from its previous close of 303 NOK, but remains near the upper end of its 52-week range of 215-316 NOK.
Quarterly Performance Highlights
Olav Thon Eiendomsselskap reported profit before tax of 357 million NOK in Q2 2025, up from 286 million NOK in the comparable period. Despite facing total fair value adjustments of -171 million NOK (improved from -254 million NOK), the company’s underlying operations remained strong with profit before tax, fair value adjustments, and currency effects reaching 544 million NOK compared to 523 million NOK previously.
As shown in the following comprehensive financial overview from the presentation:
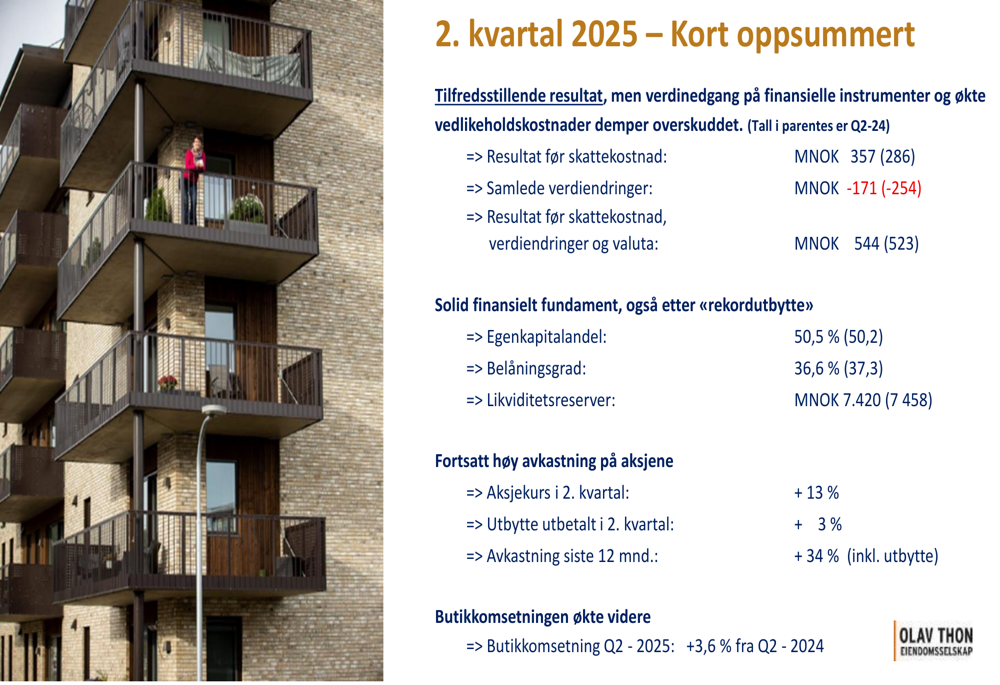
The company maintained solid fundamentals with an equity ratio of 50.5% (up from 50.2%) and a loan-to-value ratio of 36.6% (improved from 37.3%). Liquidity reserves stood at 7,420 million NOK, providing substantial financial flexibility.
A more detailed breakdown of the company’s financial performance across multiple periods demonstrates consistent improvement in key metrics:
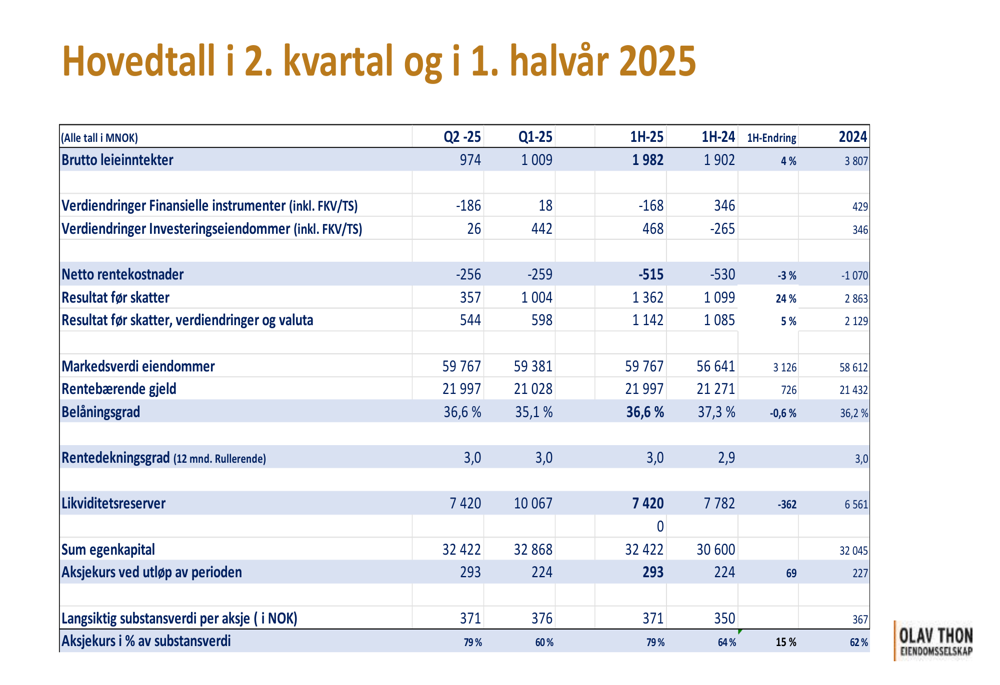
Gross rental income for Q2 2025 reached 974 million NOK, slightly down from 1,009 million NOK in Q1 2025 but up from the previous year. For the first half of 2025, rental income totaled 1,982 million NOK compared to 1,902 million NOK in H1 2024, representing a 4.2% increase. The company noted that organic growth contributed 2.5% to this increase, with the remainder coming from acquisitions, including two new shopping centers where ownership increased from 50% to 100%.
Property Portfolio & Strategic Initiatives
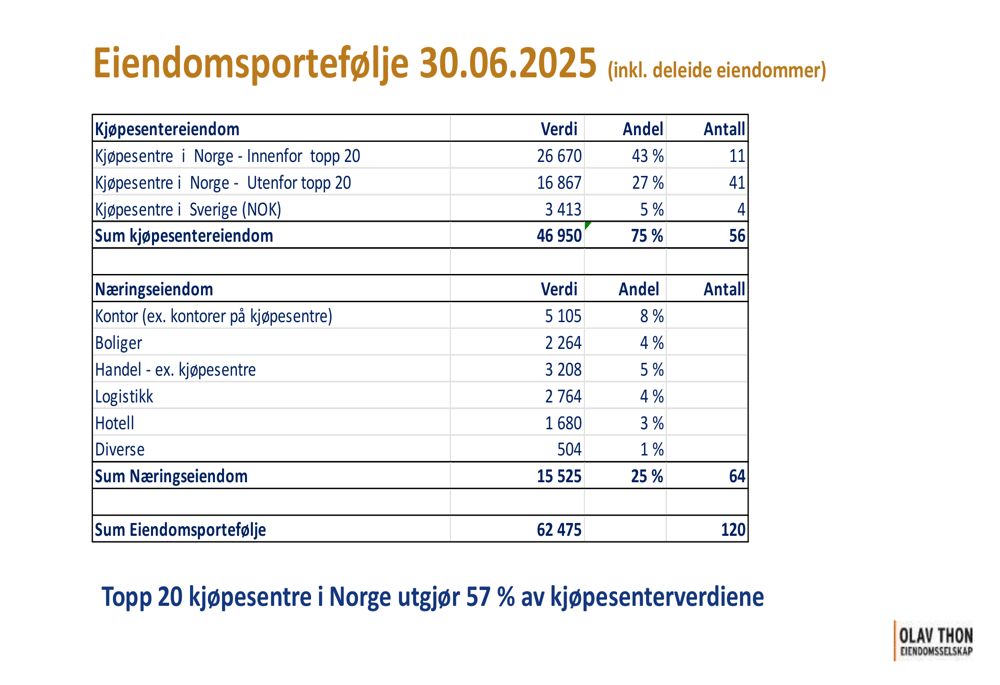
Olav Thon Eiendomsselskap maintains its position as Norway’s dominant shopping center operator. The company’s property portfolio as of June 30, 2025, was valued at 62,475 million NOK, comprising 56 shopping centers in Norway and Sweden (75% of portfolio value) and 65 commercial properties (25% of portfolio value).
The detailed breakdown of the property portfolio shows the company’s strategic focus on premium retail locations:
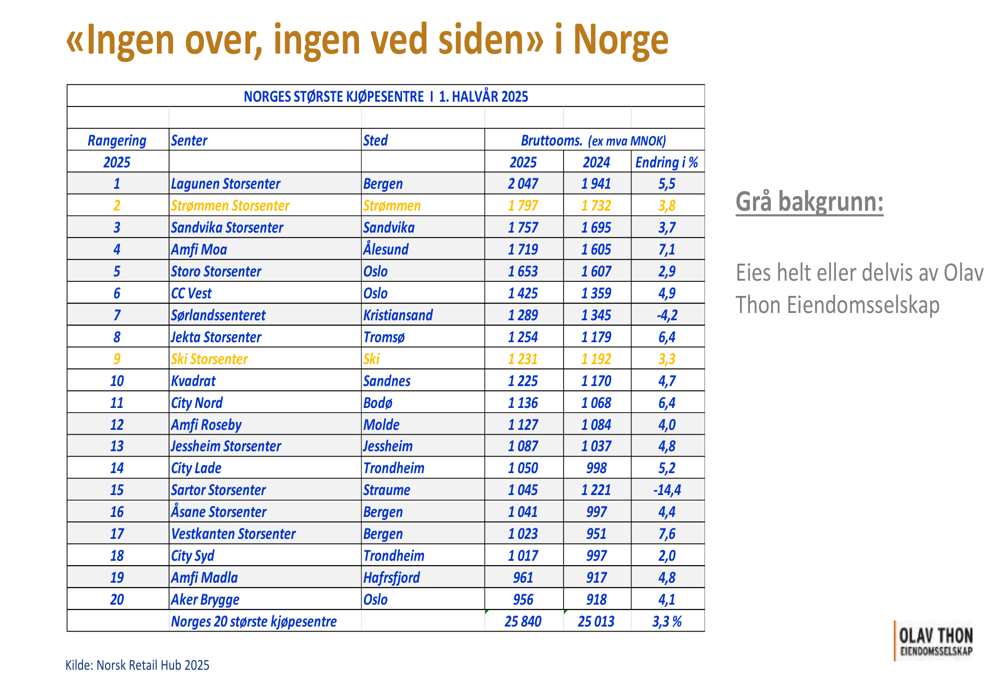
The company’s market leadership is particularly evident in its ownership of 11 of Norway’s top 20 shopping centers, including 5 of the top 7. The following table demonstrates the strong performance of these centers, with most showing positive turnover growth:
While the shopping center segment showed strong growth of 6.6% in the first half of 2025, the commercial property segment experienced a decline of 4.4%, reflecting a strategic shift in the portfolio. The company noted a temporary increased vacancy rate of 4.6% as several large commercial properties undergo upgrades.
Olav Thon Eiendomsselskap continues to invest in property development, with 742 million NOK invested in the first half of 2025. Major projects include the expansion of Lagunen Storsenter by 17,500 square meters and the Gardermoen Park logistics facility by 10,500 square meters. Additionally, significant upgrade projects are underway in Oslo Centrum, including Vika Atrium and Koppgården, with planned completion in 2025 and 2026.
Financial Position & Outlook
The company maintains a strong financial position with key metrics well within its policy targets. As illustrated in the financial policy overview:
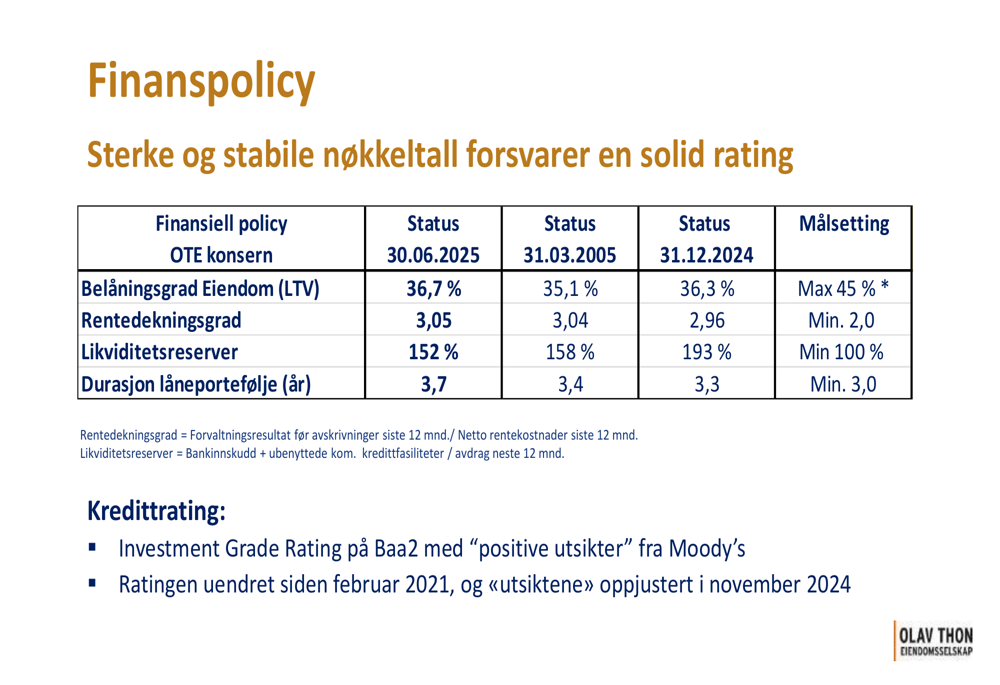
Olav Thon Eiendomsselskap holds an Investment Grade Rating of Baa2 with a "positive outlook" from Moody’s. The company’s average interest rate as of June 30, 2025, was 4.84%, down 0.32 percentage points from the previous year but up 0.17 percentage points from the first quarter of 2025.
The company’s share price has shown impressive performance, rising 13% in Q2 2025 and delivering a total return (including dividends) of 34% over the past 12 months, significantly outperforming the Oslo Stock Exchange main index’s 14% return over the same period.
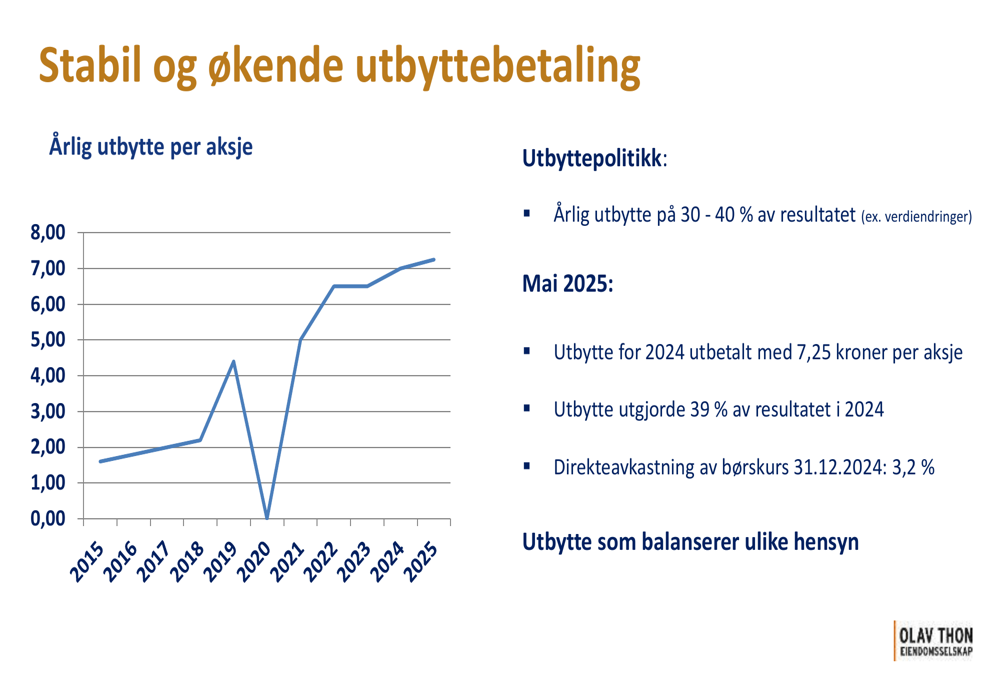
Dividend payments have remained stable and increasing, with the annual dividend per share reaching approximately 7.5 NOK in 2025. The dividend for 2024 was paid in May 2025 at 7.25 NOK per share, representing 39% of the company’s 2024 result and yielding 3.2% based on the year-end 2024 share price.
Looking ahead, Olav Thon Eiendomsselskap appears well-positioned to maintain its market leadership in Norwegian shopping centers while managing the transition in its commercial property portfolio. With substantial liquidity reserves of 7,420 million NOK against debt maturities of 6,784 million NOK through the end of 2027, the company has the financial flexibility to continue its strategic investments and navigate potential market challenges.
Full presentation:
This article was generated with the support of AI and reviewed by an editor. For more information see our T&C.