Futures slip, bank earnings ahead, Powell to speak - what’s moving markets

Orchid Island Capital Inc (NYSE:ORC) released its second quarter 2025 earnings presentation on July 25, revealing a significant reversal from the previous quarter’s positive performance. The mortgage real estate investment trust (REIT) reported a net loss of $0.29 per share, a stark contrast to the $0.18 earnings per share in Q1 2025 and well below analyst projections of $0.11 for the quarter.
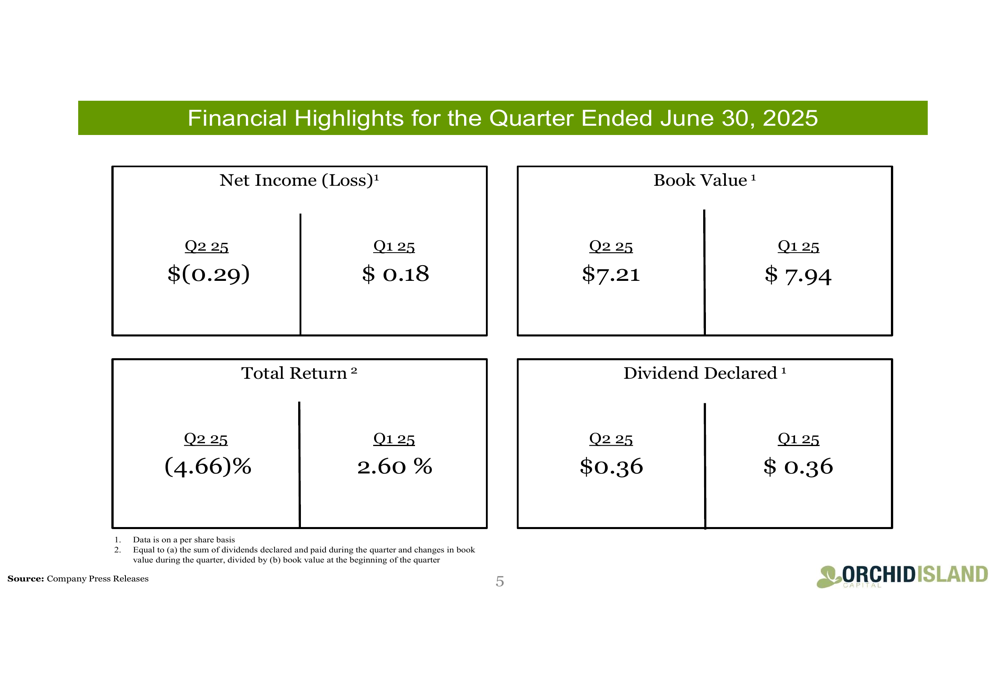
Quarterly Performance Highlights
Orchid Island’s financial results showed a substantial deterioration in Q2 2025, with total return dropping to negative 4.66% compared to positive 2.60% in the first quarter. Book value per share declined to $7.21 from $7.94 at the end of March 2025, representing a 9.2% decrease. Despite these challenges, the company maintained its quarterly dividend at $0.36 per share.
As shown in the following comparison of key financial metrics between Q1 and Q2 2025:
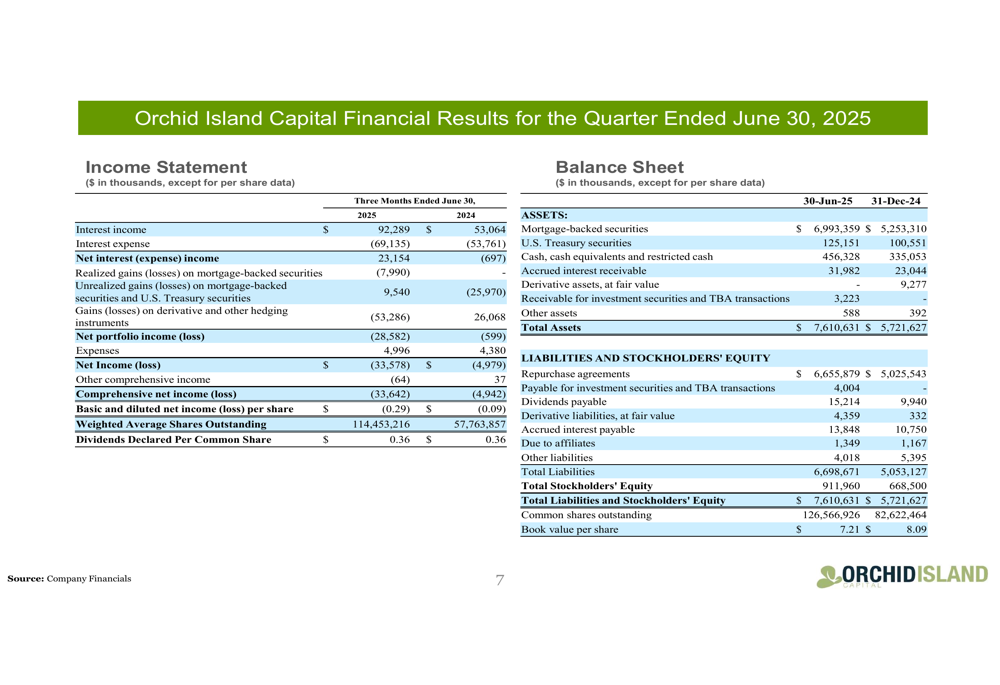
The company’s income statement reveals that while interest income increased to $92.3 million in Q2 2025 from $53.1 million in Q2 2024, losses on derivative and hedging instruments of $53.3 million significantly impacted overall performance. This represents a dramatic swing from the $26.1 million gain on derivatives in the same quarter last year.
The detailed financial results highlight both the growth in the company’s portfolio and the impact of hedging losses:
Portfolio Strategy & Positioning
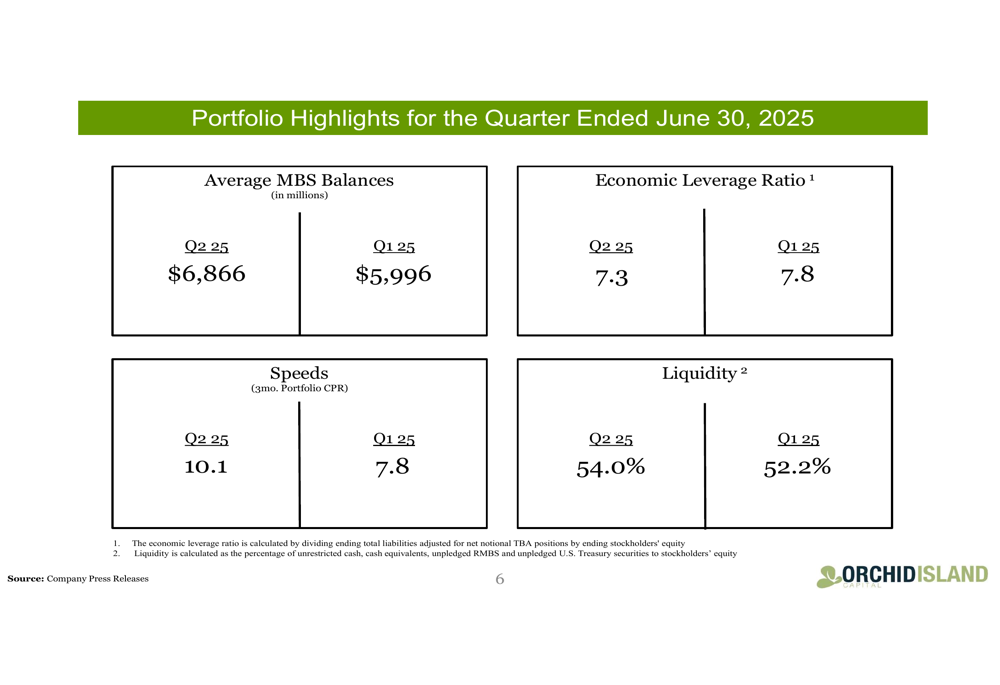
Despite the challenging quarter, Orchid Island continued to grow its mortgage-backed securities (MBS) portfolio, with average balances increasing to $6.87 billion in Q2 2025 from $6.00 billion in Q1. The company also reduced its economic leverage ratio to 7.3 from 7.8 in the previous quarter, while maintaining strong liquidity at 54.0%.
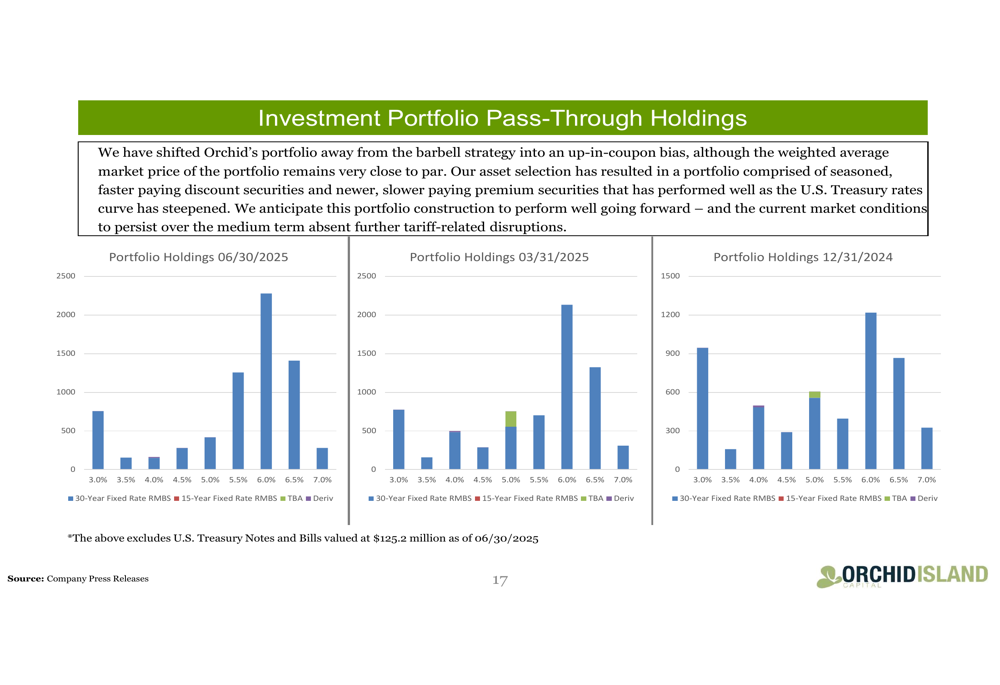
Management highlighted a strategic shift in the portfolio composition, moving away from a barbell strategy toward an up-in-coupon bias. The company increased its allocation to higher coupon 30-year fixed-rate mortgage-backed securities, particularly in the 5.5%, 6.0%, and 6.5% coupon ranges, while reducing exposure to 4.0% and 5.0% coupons.
The following chart illustrates this portfolio repositioning over the past two quarters:
The weighted average coupon of the fixed-rate MBS portfolio increased from 5.32% to 5.45% during the quarter, though the realized yield on the portfolio slightly decreased from 5.41% to 5.38%. The economic net interest spread, inclusive of hedge instruments, declined to 2.43% from 2.58% in the first quarter.
Hedging Strategy & Impact
The significant losses in Q2 2025 were primarily driven by the company’s hedging positions. As of June 30, 2025, Orchid Island maintained hedge positions equal to approximately 73% of its repo funding liability, with a total notional balance of $4.88 billion.
The following summary shows the composition and performance of these hedging positions:
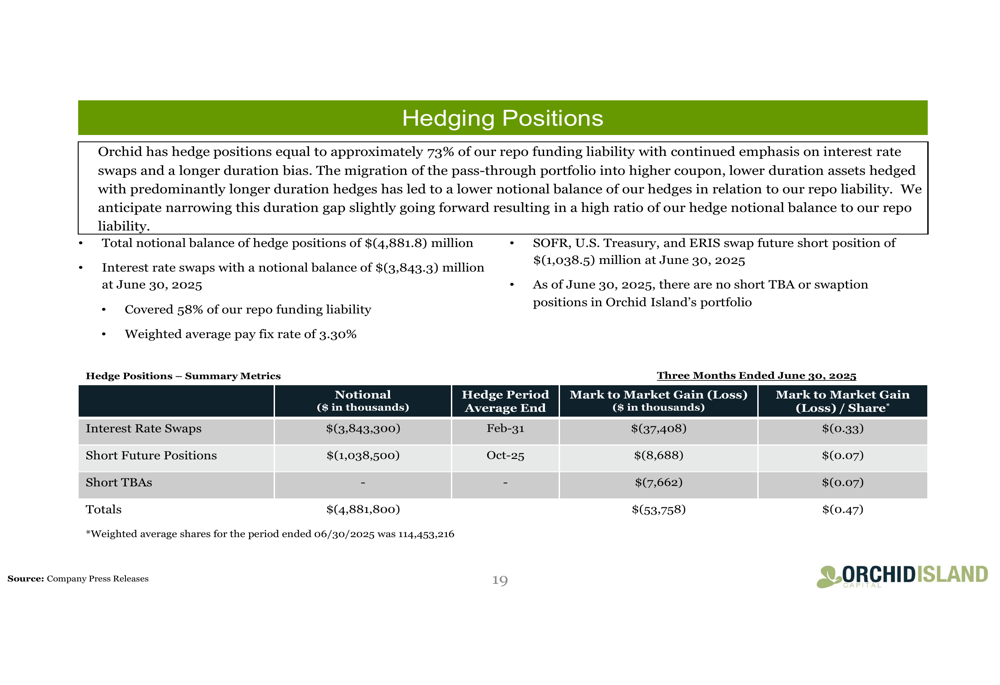
Interest rate swaps accounted for the largest portion of the hedging strategy, with a notional balance of $3.84 billion covering 58% of the company’s repo funding liability at a weighted average pay fixed rate of 3.30%. The mark-to-market losses on these positions totaled $53.8 million for the quarter, or approximately $0.47 per share.
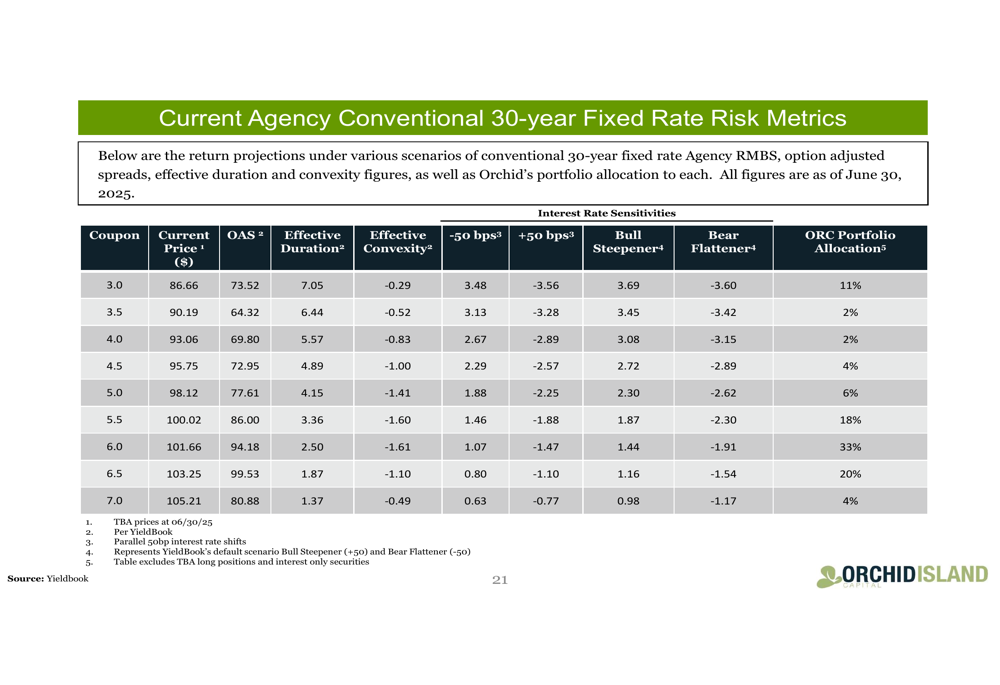
The company’s risk metrics for its 30-year fixed-rate agency conventional securities show varying sensitivity to interest rate changes across different coupon rates:
Market Context & Forward Outlook
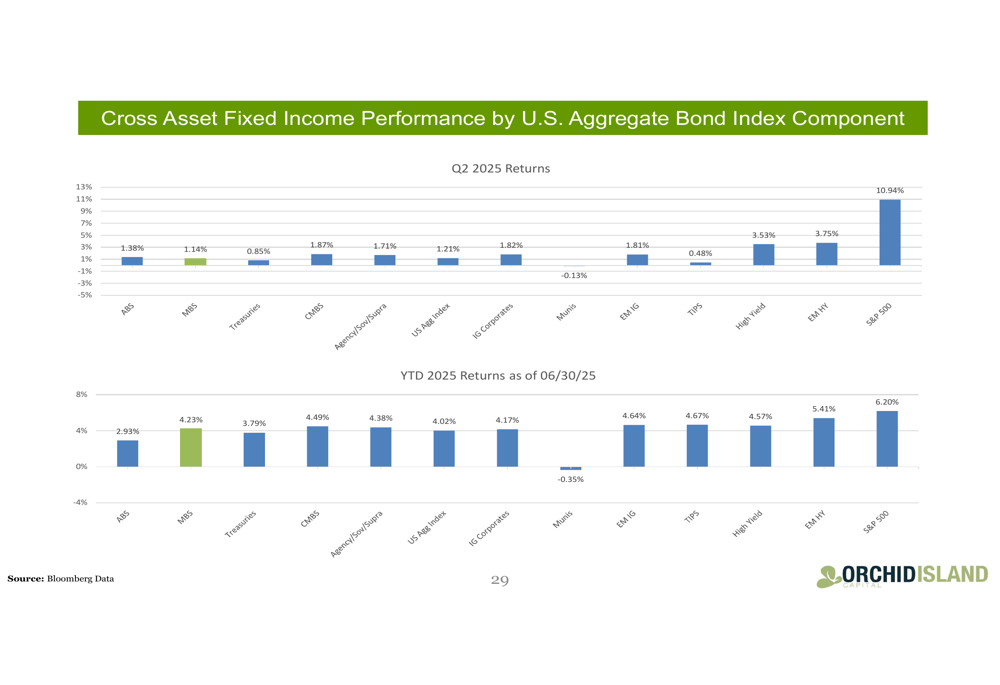
Management described the start of the second quarter as "reminiscent of March 2020 and the onset of the Covid-19 pandemic," suggesting significant market volatility. Despite these challenges, the company maintains that current market conditions are favorable to investments in Agency RMBS, with federal budget deficits likely to remain elevated, which should support economic growth.
The cross-asset fixed income performance comparison provides context for the challenging environment faced by mortgage REITs during the quarter:
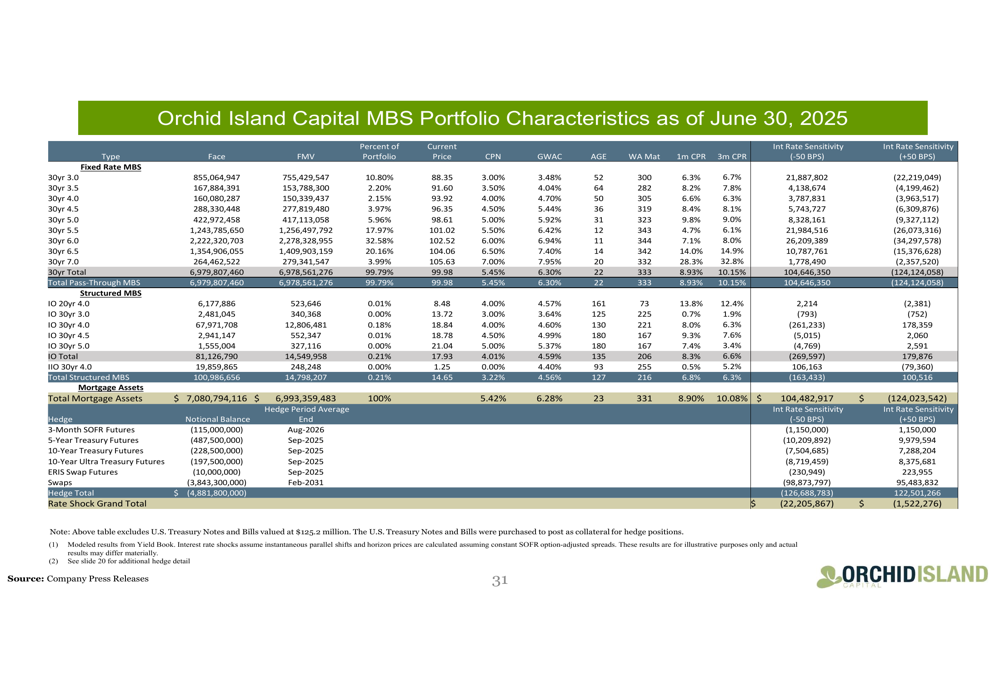
The comprehensive portfolio characteristics as of June 30, 2025, show the detailed composition of Orchid Island’s MBS holdings and their sensitivity to interest rate changes:
Analyst Perspectives
The Q2 2025 results represent a significant departure from analyst expectations. In the previous earnings report, projections suggested a gradual increase in EPS with forecasts of $0.11 for Q2 2025 and $0.16 for Q3 2025. The actual Q2 loss of $0.29 per share indicates that market conditions proved more challenging than anticipated.
Orchid Island Capital’s stock closed at $7.34 on July 24, 2025, representing a 0.54% decline for the day. The stock has been trading within a 52-week range of $5.685 to $9.005, and the current price reflects the ongoing challenges faced by the company.
While the company maintained its dividend at $0.36 per share, the sustainability of this payout may come into question if negative performance continues, despite management’s previous statements about dividend obligations related to REIT tax requirements.
Full presentation:
This article was generated with the support of AI and reviewed by an editor. For more information see our T&C.