Conservative commentator Charlie Kirk shot and killed at Utah event

Introduction & Market Context
Paramount Group, Inc. (NYSE:PGRE) released its Q2 2025 investor presentation on July 31, providing insights into the company’s performance and strategic positioning in a persistently challenging office real estate market. The presentation reveals a company leveraging its high-quality assets to navigate sector headwinds, with notable divergence between its stronger New York portfolio and more challenged San Francisco properties.
Following the company’s Q1 2025 results, which showed core FFO of $0.17 per share and revenue of $187.02 million, the Q2 presentation indicates continued pressure on financial metrics despite some operational bright spots. The stock has shown resilience, trading at $6.21 at market close on July 30, with a 1.45% gain in after-hours trading.
Portfolio Performance Highlights
Paramount’s portfolio consists of 17 assets totaling 13.1 million square feet, with a total assets under management of approximately $7.2 billion. The company’s same-store leased occupancy stands at 85.4%, with a significant performance gap between markets – New York at 88.1% and San Francisco at 75.1%.
As shown in the following overview of Paramount’s key metrics:
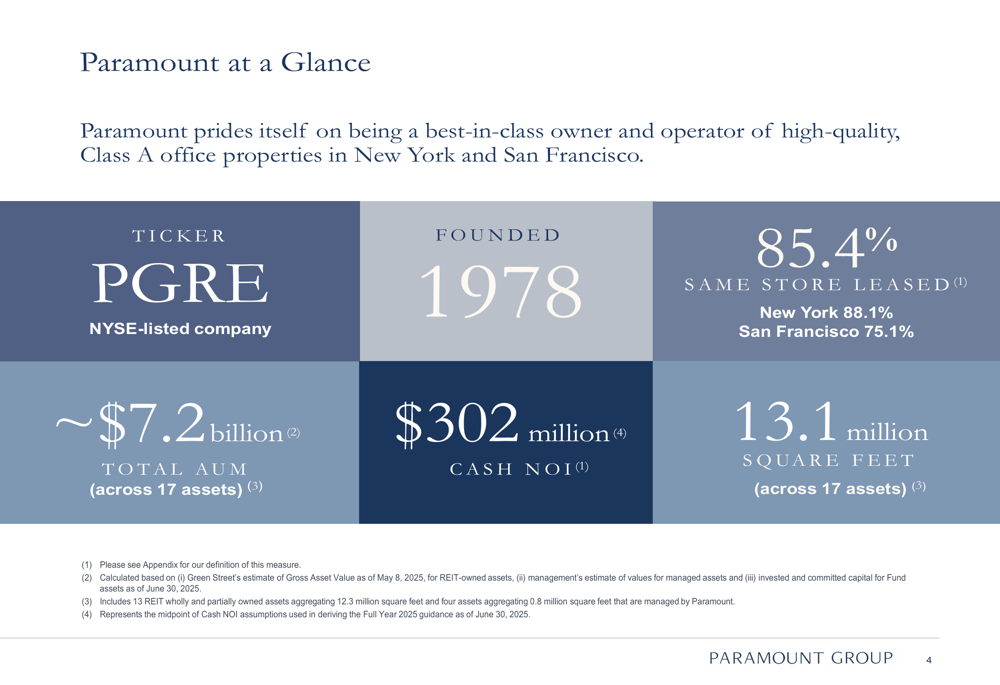
The company’s portfolio is heavily weighted toward New York, which represents 77% of gross asset value compared to San Francisco’s 23%. This geographic allocation has proven beneficial given the stronger performance of the New York office market. Paramount’s properties command premium rents averaging $90 per square foot, with an average lease term of 7.1 years (7.9 years in New York and 4.1 years in San Francisco).
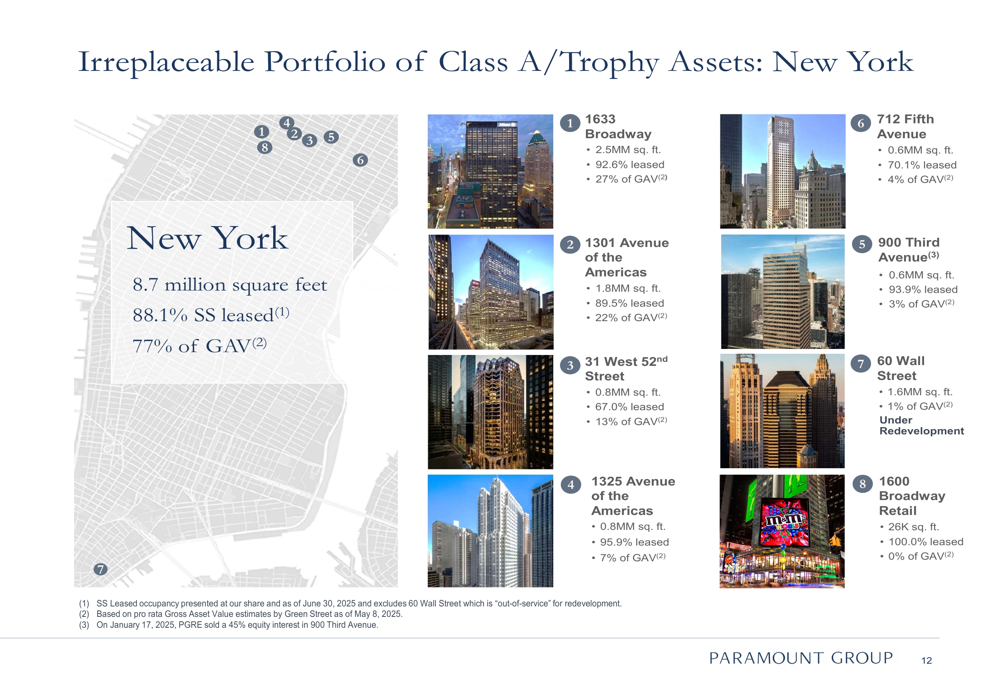
The company’s New York portfolio features eight properties totaling 8.7 million square feet, including trophy assets such as 1633 Broadway and 1301 Avenue of the Americas. The following image illustrates Paramount’s New York footprint:
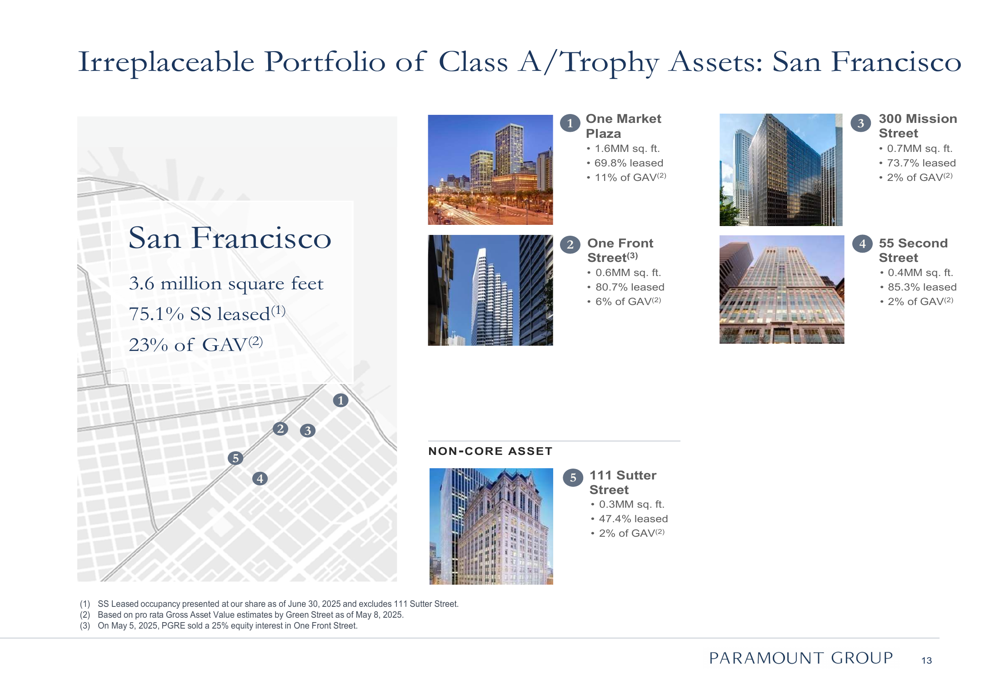
In contrast, Paramount’s San Francisco portfolio, while featuring high-quality assets like One Market Plaza, continues to face more significant challenges with lower occupancy:
Leasing Activity and Tenant Base
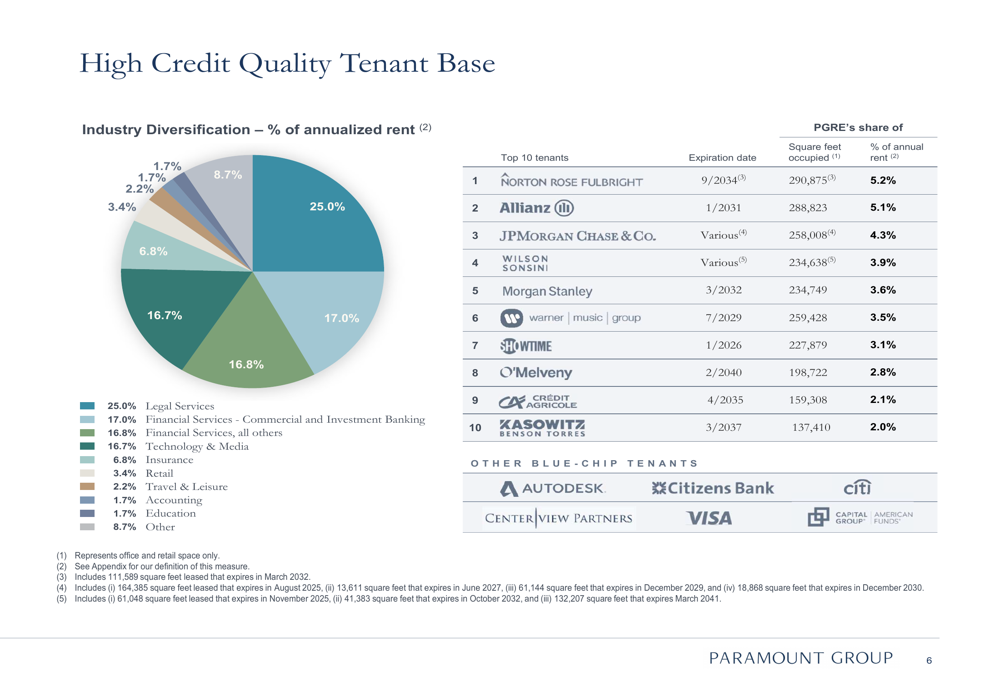
Paramount’s tenant roster reflects its focus on credit-worthy occupiers, with significant representation from legal services (25.0%), financial services (33.8% combined), and technology and media companies (16.7%). This diversification provides some insulation against sector-specific downturns.
The company’s tenant mix and industry exposure are detailed in the following chart:
A key focus for investors is Paramount’s lease expiration schedule, which shows significant upcoming roll in both markets. In New York, Charter Communications (NASDAQ:CHTR) (96,000 square feet) expires in 2025, while Showtime Networks (235,000 square feet) and Turner Broadcasting (52,000 square feet) expire in 2026. In San Francisco, JPMorgan Chase (NYSE:JPM) (164,000 square feet) expires in 2025, while Visa (NYSE:V), Morgan Lewis (JO:LEWJ), KPMG, and Autodesk (NASDAQ:ADSK) have leases expiring in 2026 totaling 244,000 square feet.
The following chart details these upcoming lease expirations by market:
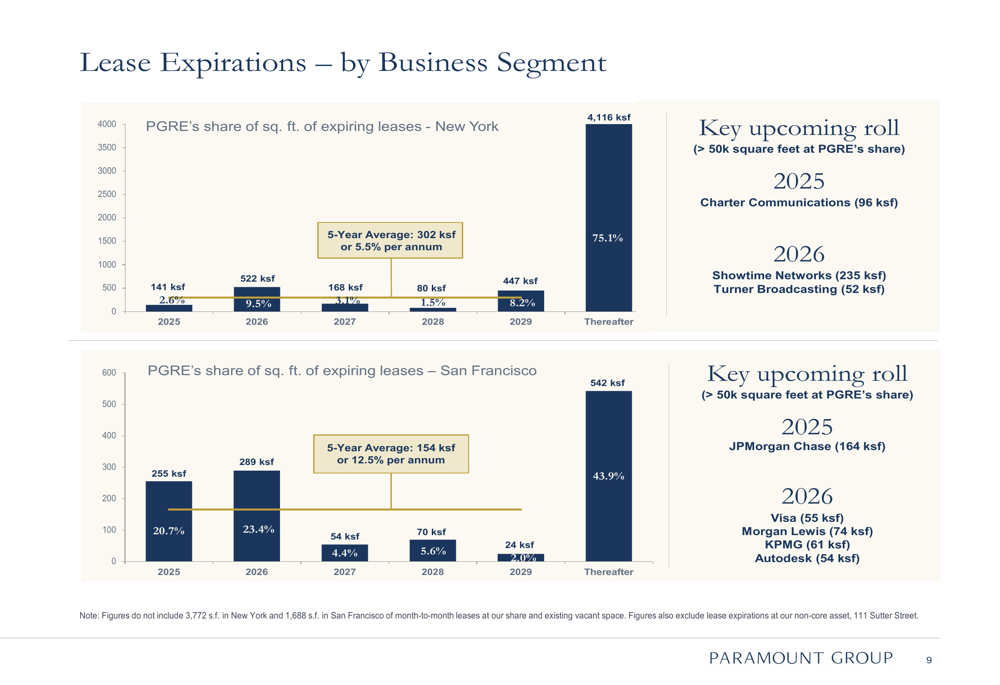
These expirations represent both risk and opportunity for Paramount, particularly in the context of the "flight to quality" trend mentioned by CEO Albert Baylor in the Q1 earnings call. The company’s ability to retain tenants or backfill spaces will be crucial to maintaining and improving occupancy rates.
Financial Position and Capital Structure
Paramount’s financial metrics show some pressure compared to the prior year. The company reported six-month FFO per diluted share of $0.29 as of June 30, 2025, down from $0.47 in the comparable period of 2024. Similarly, Cash NOI for the six months ended June 30, 2025, was $166.4 million, compared to $175.5 million in 2024.
On a more positive note, Same Store Cash NOI for the three months ended June 30, 2025, showed a modest 0.5% increase year-over-year, though Same Store NOI decreased by 4.6%, suggesting non-cash items are impacting performance.
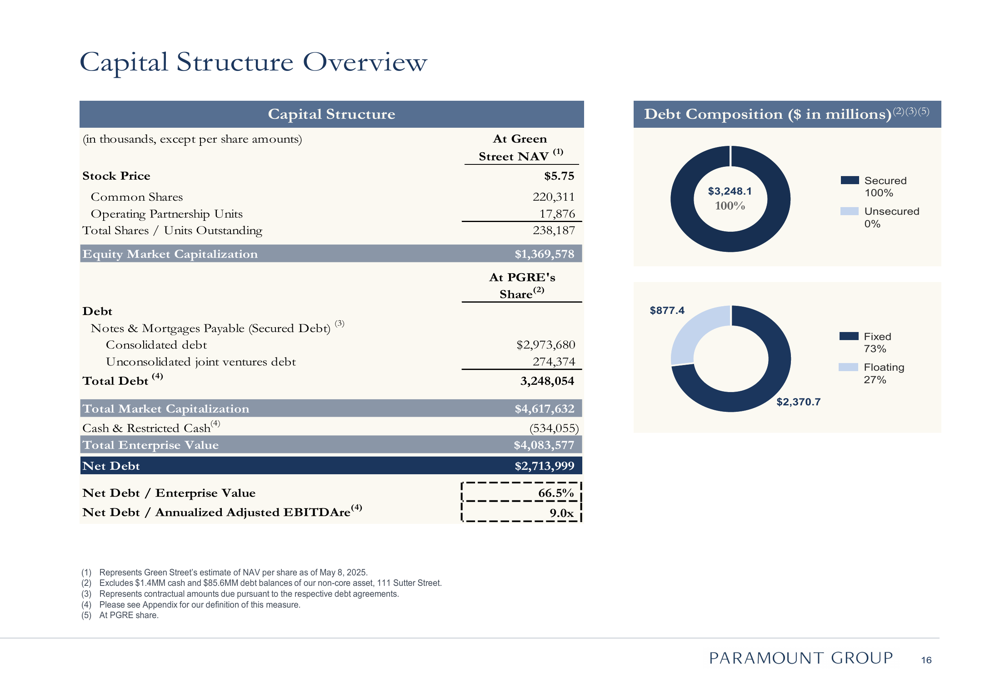
The company’s capital structure remains heavily weighted toward debt, with a total enterprise value of approximately $4.1 billion and net debt of $2.7 billion, resulting in a net debt to enterprise value ratio of 66.5% and net debt to adjusted EBITDAre of 9.0x.
The following chart provides a detailed breakdown of Paramount’s capital structure:
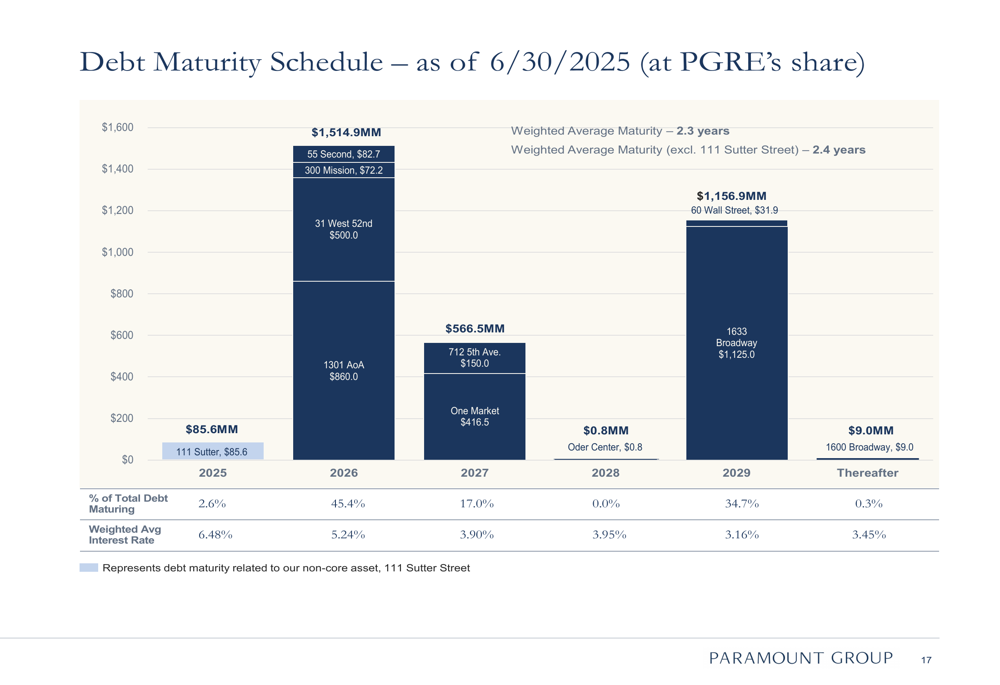
A significant consideration for investors is Paramount’s debt maturity schedule, with 45.4% of total debt maturing in 2026, creating potential refinancing pressure in a higher interest rate environment:
Sustainability Initiatives
Paramount continues to position itself as a leader in sustainability within the office sector, highlighting its environmental credentials as a competitive advantage in attracting and retaining premium tenants. The company’s entire portfolio has achieved LEED Platinum or Gold certification, ENERGY STAR labeling, and Fitwel ratings.
The company’s sustainability achievements are summarized in the following chart:
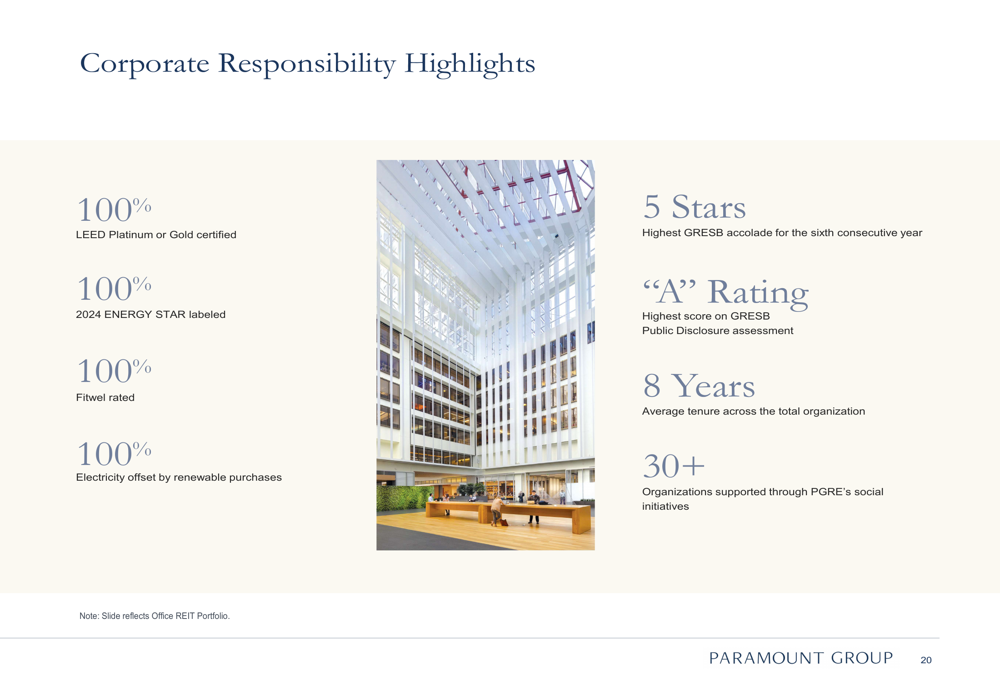
These initiatives align with increasing regulatory requirements, such as New York City’s Local Law 97, and reflect Paramount’s strategy of managing operating costs while enhancing portfolio value through sustainability practices.
Forward Outlook and Challenges
Looking ahead, Paramount faces several key challenges and opportunities. The divergence between its New York and San Francisco portfolios will likely continue to impact overall performance, with San Francisco requiring particular attention to improve its 75.1% occupancy rate.
The significant lease expirations in 2026, representing 45.4% of the company’s debt, will require careful management in a potentially challenging refinancing environment. Additionally, the company’s relatively high leverage (net debt to EBITDAre of 9.0x) could limit financial flexibility.
On the positive side, Paramount’s focus on high-quality assets in prime locations positions it to benefit from the ongoing "flight to quality" trend in office space. The company’s strong sustainability credentials also provide a competitive advantage in attracting environmentally conscious tenants.
As noted in the Q1 earnings call, Paramount has increased its leasing guidance to 900,000-1,100,000 square feet for the year, suggesting confidence in its ability to address vacancy challenges. The company’s substantial cash position of $534 million provides some cushion against market volatility and potential investment opportunities.
While Paramount’s Q2 2025 presentation highlights the quality of its portfolio and tenant base, the financial metrics indicate ongoing challenges in translating these strengths into improved bottom-line performance in the current office market environment.
Full presentation:
This article was generated with the support of AI and reviewed by an editor. For more information see our T&C.