ION expands ETF trading capabilities with Tradeweb integration

Introduction & Market Context
Patrick Industries (NASDAQ:PATK) presented its third-quarter 2025 results on October 30, showcasing a 6% year-over-year revenue increase to $976 million, exceeding analyst expectations of $896.78 million. The company's diversified business model across recreational vehicle (RV), marine, powersports, and housing markets demonstrated resilience despite mixed industry conditions.
The component solutions provider reported earnings per share of $1.01, surpassing the forecasted $0.93, though this represented a decline from $1.20 in the same quarter last year. Following the announcement, Patrick's stock rose 2.57% to close at $98.89, reflecting positive investor sentiment about the company's performance.
Quarterly Performance Highlights
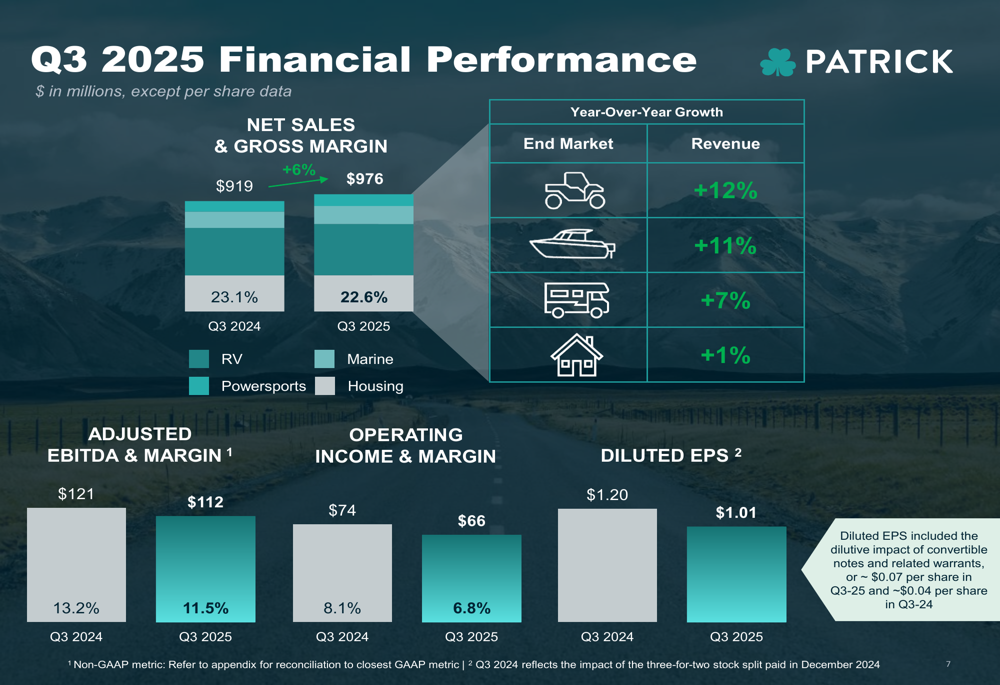
Patrick Industries achieved solid financial results in the third quarter, with revenue growth driven by both organic expansion (4%) and acquisitions (4%), which offset a 2% headwind from broader industry trends.
As shown in the following chart of Patrick's key financial metrics:
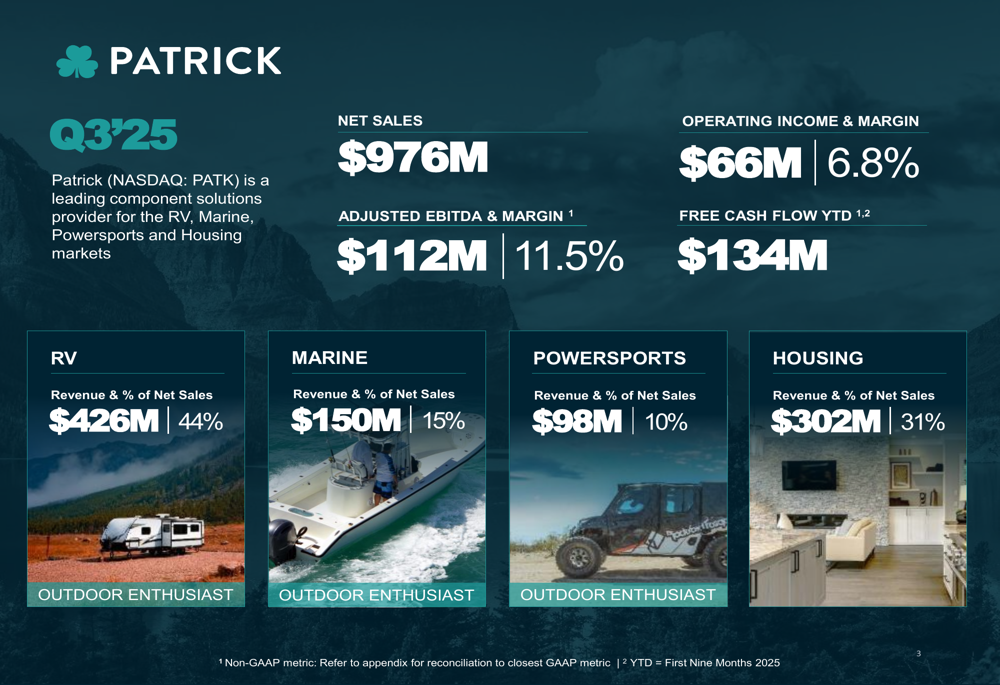
The company reported adjusted EBITDA of $112 million with an 11.5% margin, while operating income reached $66 million with a 6.8% margin. Year-to-date free cash flow stood at $134 million, providing substantial financial flexibility.
Despite outperforming industry wholesale shipments across key segments, Patrick experienced some margin pressure, with operating margin decreasing from 8.1% in Q3 2024 to 6.8% in Q3 2025. This quarterly financial performance is illustrated in the following chart:
Segment Analysis
Patrick's diversified portfolio showed strength across all four end markets, with each segment posting year-over-year revenue growth despite challenging conditions in some industries.
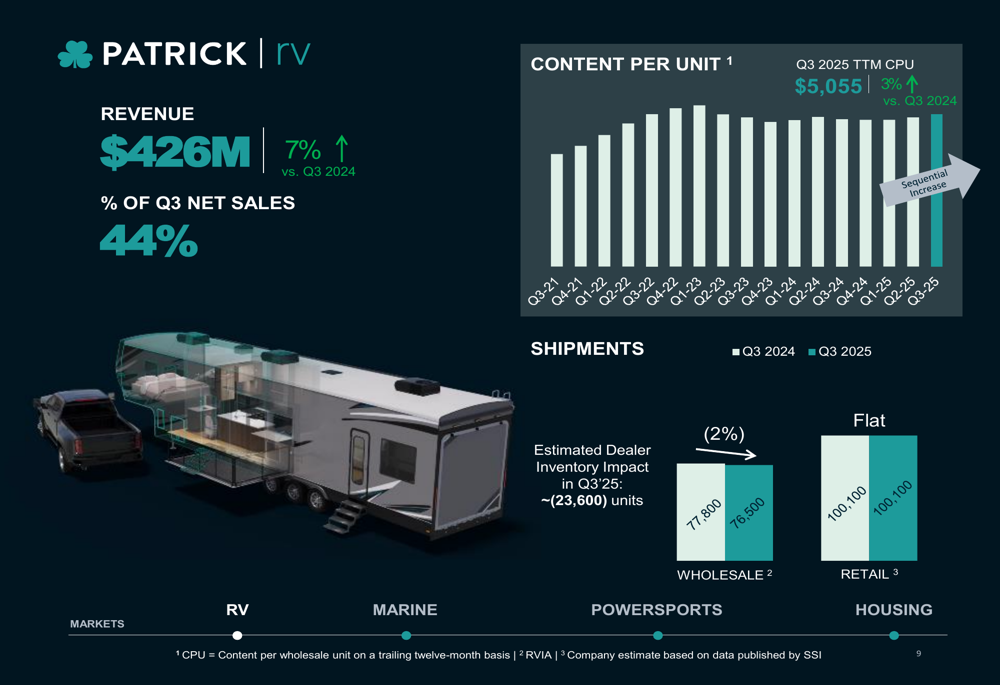
The RV segment, which accounts for 44% of net sales, grew 7% year-over-year to $426 million, outperforming a 2% decrease in wholesale industry unit shipments. Content per unit increased 3% to $5,055, demonstrating Patrick's ability to expand its product offerings within each RV.
As shown in the RV segment performance data:
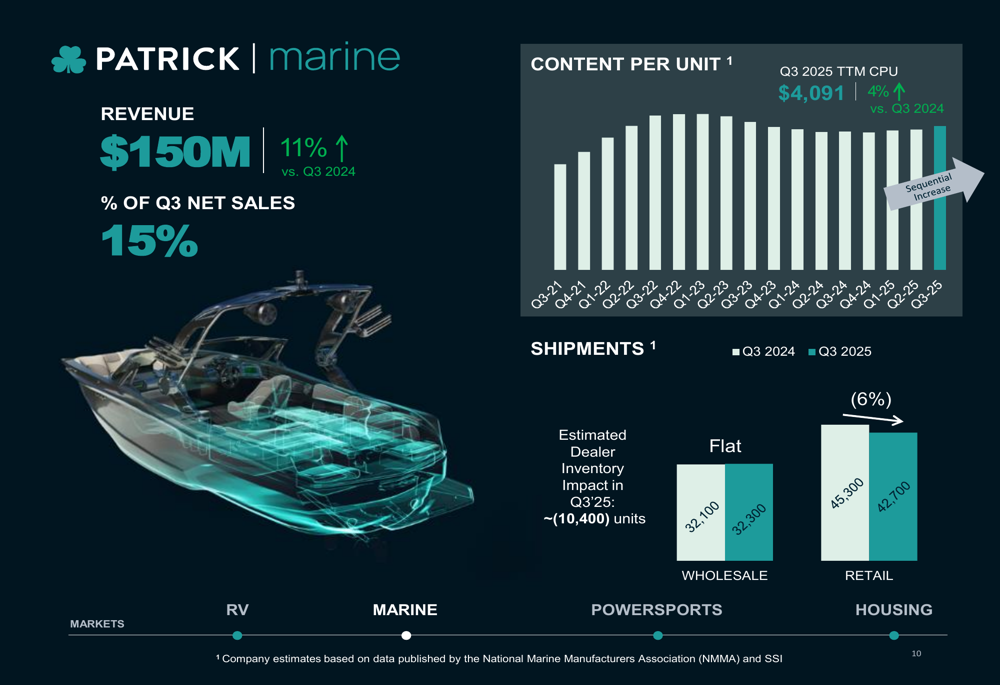
The marine segment showed robust 11% growth to $150 million (15% of total sales), outperforming flat wholesale powerboat industry unit shipments. Content per unit increased 4% to $4,091, reflecting successful product penetration strategies.
Powersports emerged as the fastest-growing segment with a 12% year-over-year increase to $98 million (10% of total sales), highlighting improved attachment rates on premium utility vehicles and stronger revenue from Patrick's powersports businesses.
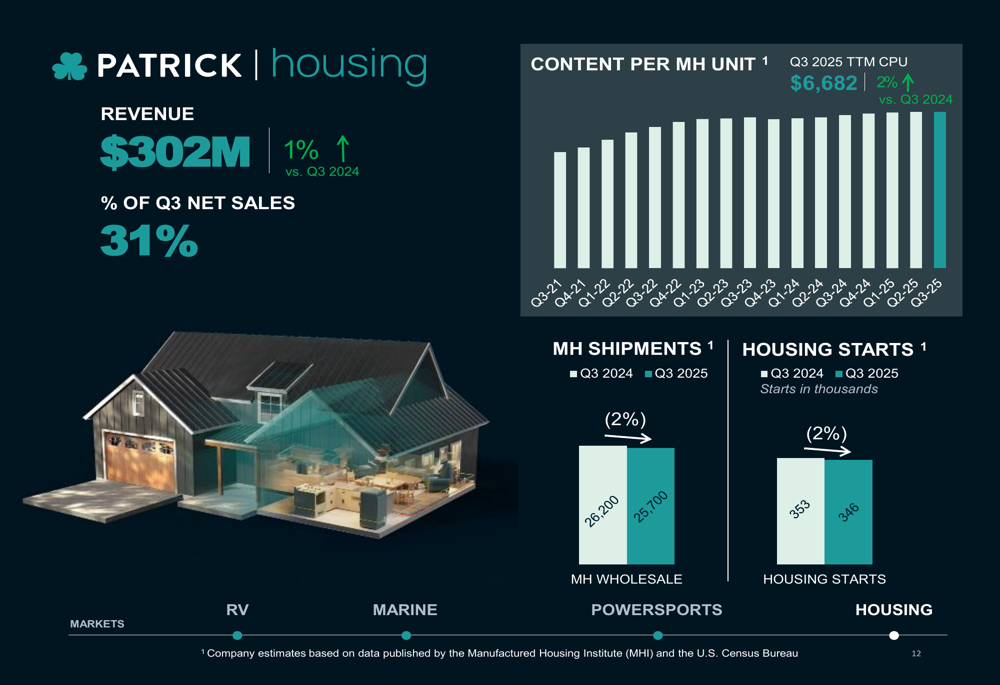
The housing segment, representing 31% of net sales, grew 1% to $302 million, reflecting continued demand for affordable housing despite a 2% decrease in manufactured housing shipments. Content per manufactured housing unit increased 2% to $6,682.
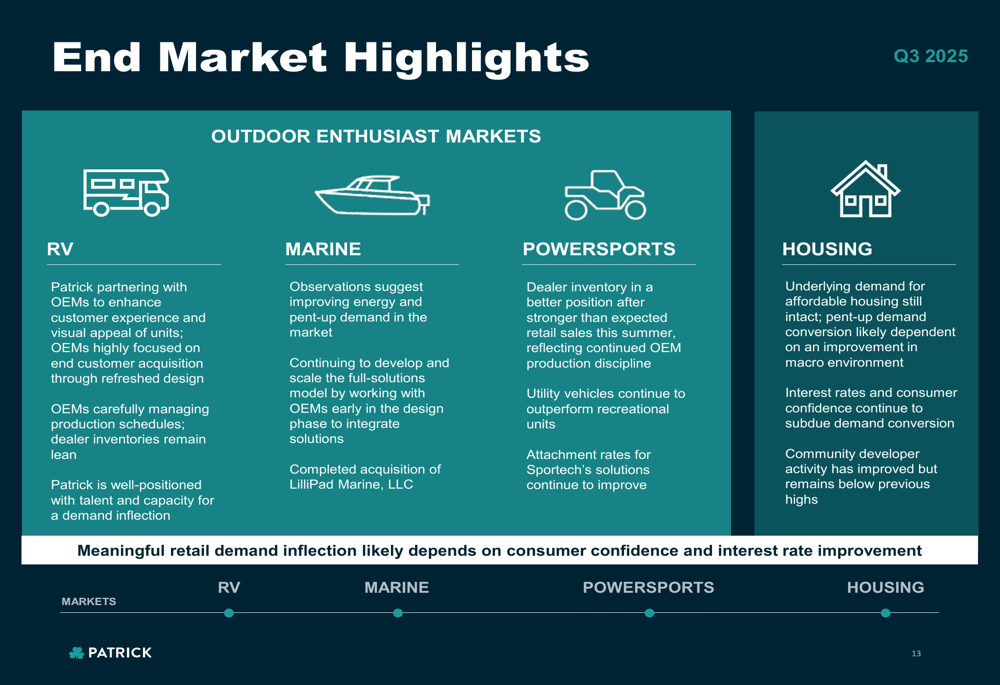
Patrick provided qualitative insights across its end markets, noting improving design appeal in RVs, growing energy and pent-up demand in marine, better positioned inventory in powersports, and underlying demand in housing:
Strategic Initiatives & Diversification
A central theme of Patrick's presentation was its ongoing diversification strategy, which has significantly transformed the company's revenue mix since 2019. This strategic evolution has enhanced Patrick's resilience against industry cyclicality while expanding its total addressable market.
The following chart illustrates Patrick's diversification journey from 2019 to Q3 2025:
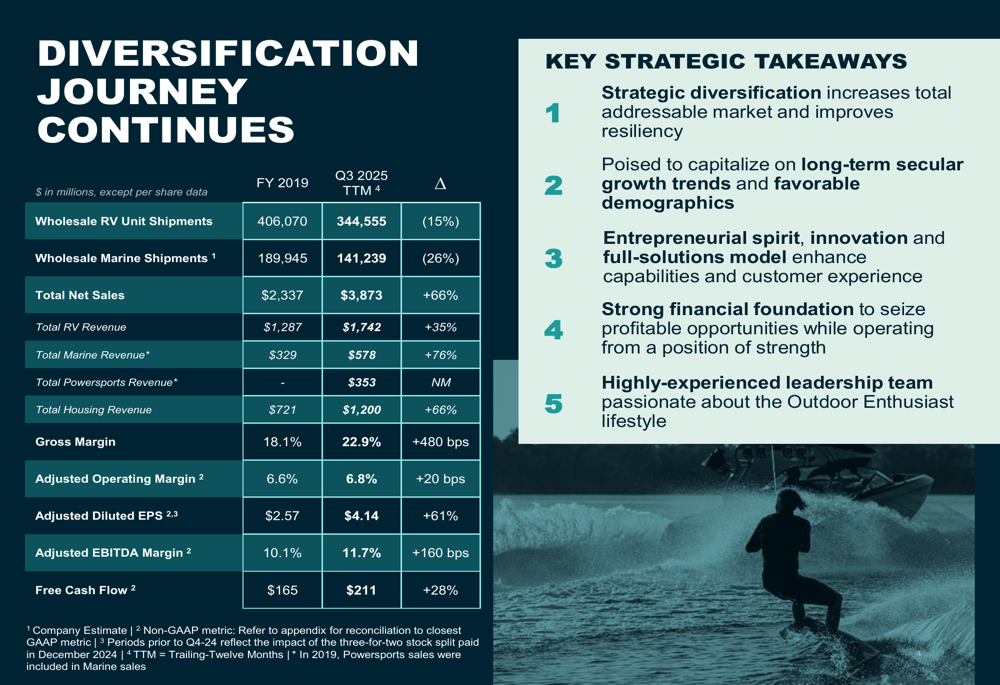
Despite a 15% decline in wholesale RV unit shipments and a 26% drop in wholesale marine shipments compared to 2019, Patrick has grown its total net sales by 66% to $3.87 billion (trailing twelve months). This growth has been accompanied by significant margin improvements, with gross margin expanding 480 basis points to 22.9% and adjusted EBITDA margin increasing 160 basis points to 11.7%.
During Q3 2025, Patrick continued its strategic growth through the acquisition of LilliPad Marine, LLC, further strengthening its marine segment capabilities. The company also invested in infrastructure modernization to enhance operational efficiency.
Balance Sheet & Liquidity
Patrick maintains a strong financial foundation with substantial liquidity to support future growth initiatives. As of Q3 2025, the company reported total net liquidity of $779 million, including $758 million in unused credit capacity.
The company's debt structure and leverage position are detailed in the following chart:

With a consolidated total net leverage ratio of 2.8x and a consolidated secured net leverage ratio of 0.45x, Patrick maintains significant financial flexibility to pursue acquisitions and other strategic investments while operating from a position of strength.
Forward-Looking Guidance
Looking ahead, Patrick provided guidance for the remainder of fiscal year 2025 and initial outlook for fiscal year 2026. The company expects adjusted operating margin of approximately 7.0% (range of 7.0%-7.3%) for FY 2025, compared to 7.2% in FY 2024.
Operating cash flows are projected to be between $330 million and $350 million for FY 2025, with capital expenditures of $75 million to $85 million, resulting in free cash flow of at least $245 million.

For FY 2026, Patrick anticipates improvements in operating margins and growth in RV, marine, and powersports shipments. According to CEO Andy Nemeth in the earnings call, the company sees potential for inventory restocking, which could drive future sales growth.
Patrick Industries continues to position itself as a leading component solutions provider for the outdoor enthusiast lifestyle markets, leveraging its entrepreneurial spirit, innovation capabilities, and full-solutions model to enhance customer experience while maintaining a strong financial foundation for future growth.
Full presentation:
This article was generated with the support of AI and reviewed by an editor. For more information see our T&C.