Can anything shut down the Gold rally?

Introduction & Market Context
Rockwell Automation (NYSE:ROK) reported its third-quarter fiscal 2025 results on August 6, showcasing 5% year-over-year sales growth and raising its full-year earnings guidance. The industrial automation company’s shares rose 1.45% in premarket trading to $351, reflecting positive investor sentiment despite mixed performance across regions and industry segments.
The Milwaukee-based company highlighted productivity gains and margin expansion as key drivers of its performance, with particular strength in North America and the e-Commerce & Warehouse Automation sector. These results build upon the momentum seen in the previous quarter, when the company beat earnings expectations and signaled a return to growth.
Quarterly Performance Highlights
Rockwell Automation reported third-quarter sales of $2.14 billion, up 5% year-over-year, with organic sales growth exceeding 4%. The company achieved an adjusted earnings per share of $2.82, above market expectations and representing a 4% increase from the $2.71 reported in the same quarter last year.
Segment operating margin improved to 21.2%, a 40 basis point increase from Q3 FY24, while the company generated $489 million in free cash flow, more than double the $238 million achieved in the prior year period. Notably, Rockwell achieved approximately $250 million in year-over-year productivity benefits, reaching this target a quarter earlier than expected.
As shown in the following chart of key financial information:
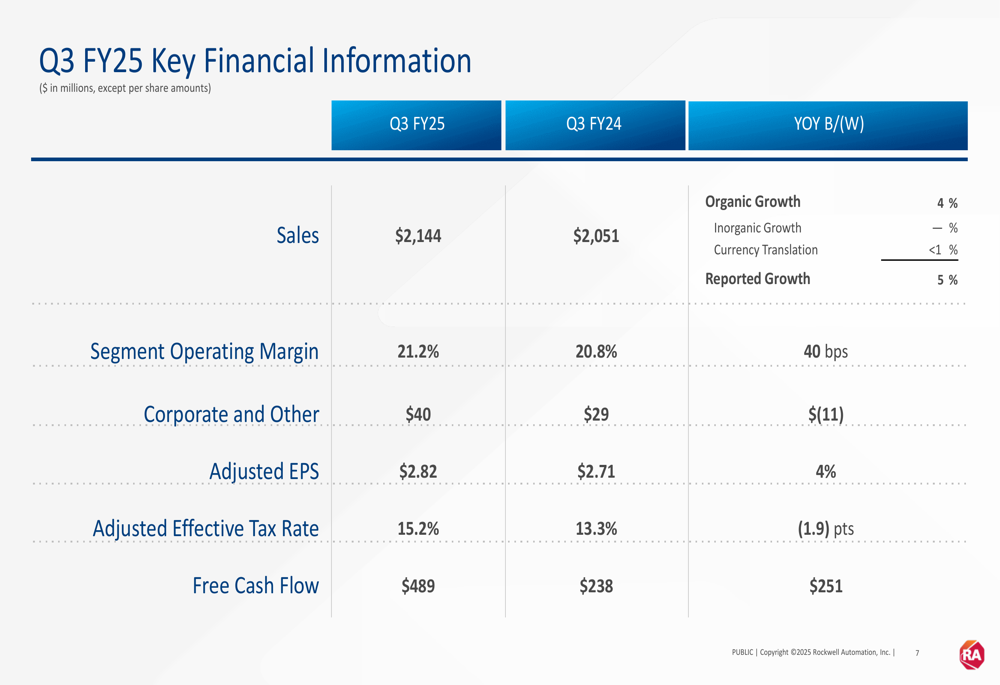
The company maintained a book-to-bill ratio of approximately 1.0, which is consistent with its normal historical range and suggests stable demand going forward. Total (EPA:TTEF) Annual Recurring Revenue (ARR) grew 7% year-over-year, indicating progress in the company’s efforts to build more predictable revenue streams.
Segment and Regional Analysis
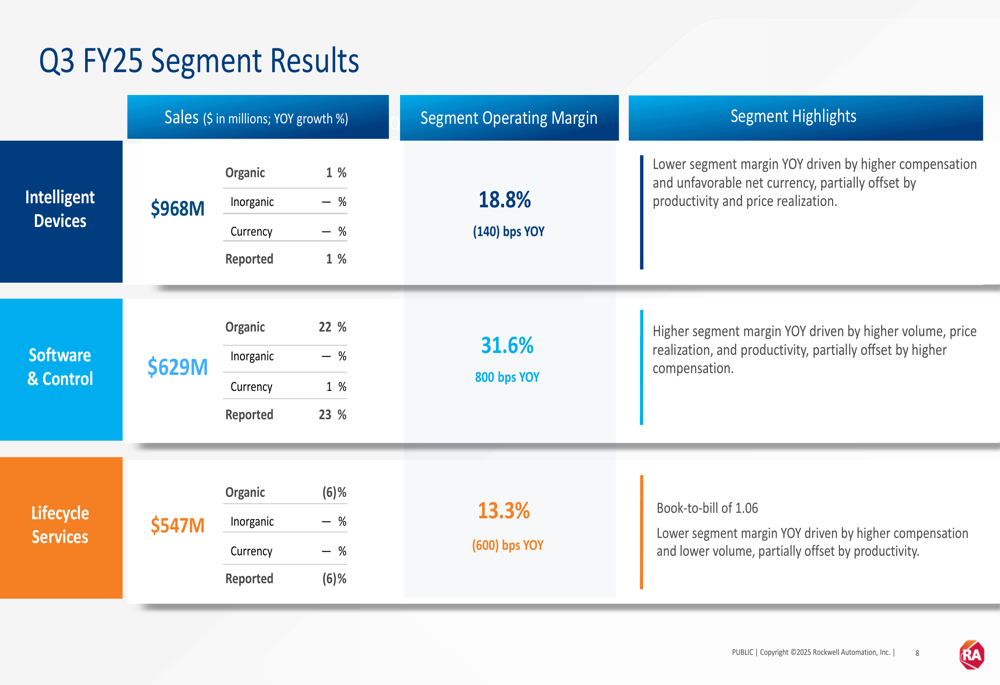
Rockwell Automation’s performance varied significantly across its business segments. The Software (ETR:SOWGn) & Control segment was the standout performer with 22% organic growth and a segment operating margin of 31.6%, an impressive 800 basis point improvement year-over-year. Meanwhile, the Intelligent Devices segment saw modest 1% organic growth with an 18.8% operating margin, and the Lifecycle Services segment experienced a 6% organic decline with a 13.3% operating margin.
The company’s detailed segment results reveal the factors behind these performance variations:
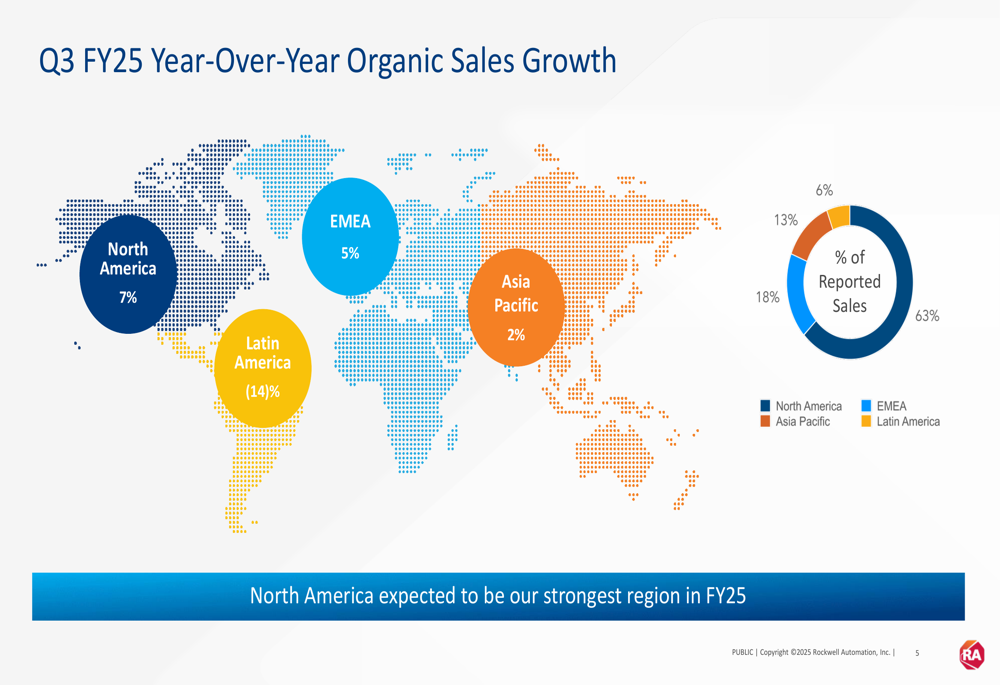
Regional performance also showed considerable divergence, with North America leading at 7% growth and representing 63% of total sales. Europe, Middle East and Africa (EMEA) grew 5%, while Asia Pacific posted a modest 2% increase. Latin America was the notable underperformer with a 14% decline.
The following world map illustrates this regional performance:
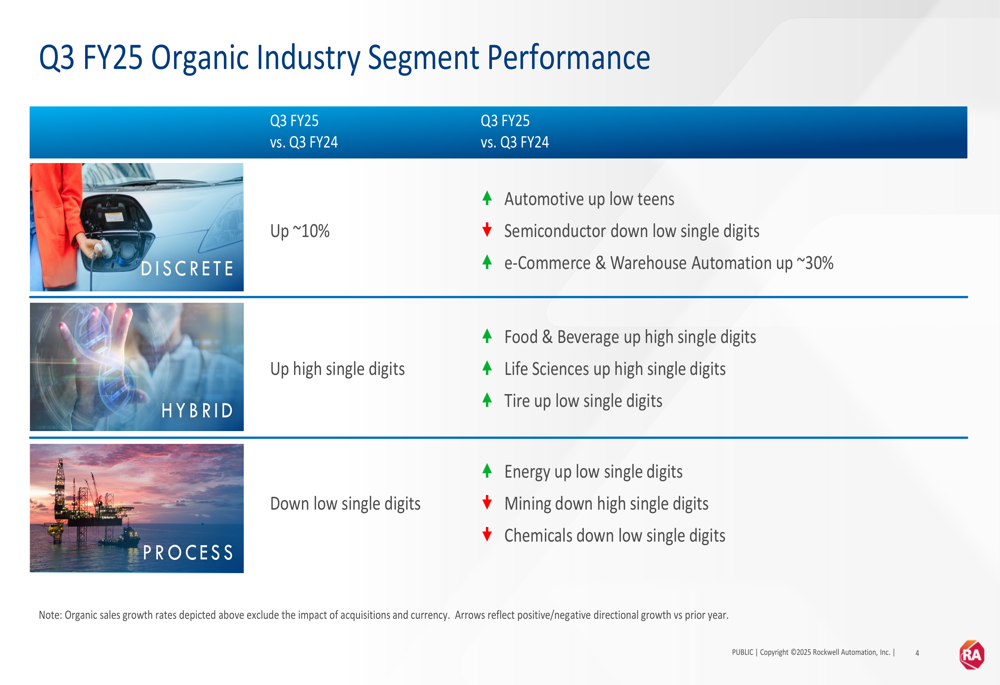
Industry segment performance reflected broader economic trends, with Discrete automation up approximately 10%, driven by a strong 30% growth in e-Commerce & Warehouse Automation. The Hybrid segment grew at high single digits, while the Process segment declined at low single digits, with particular weakness in the mining sector.
The breakdown of organic industry segment performance is shown here:
Guidance and Outlook
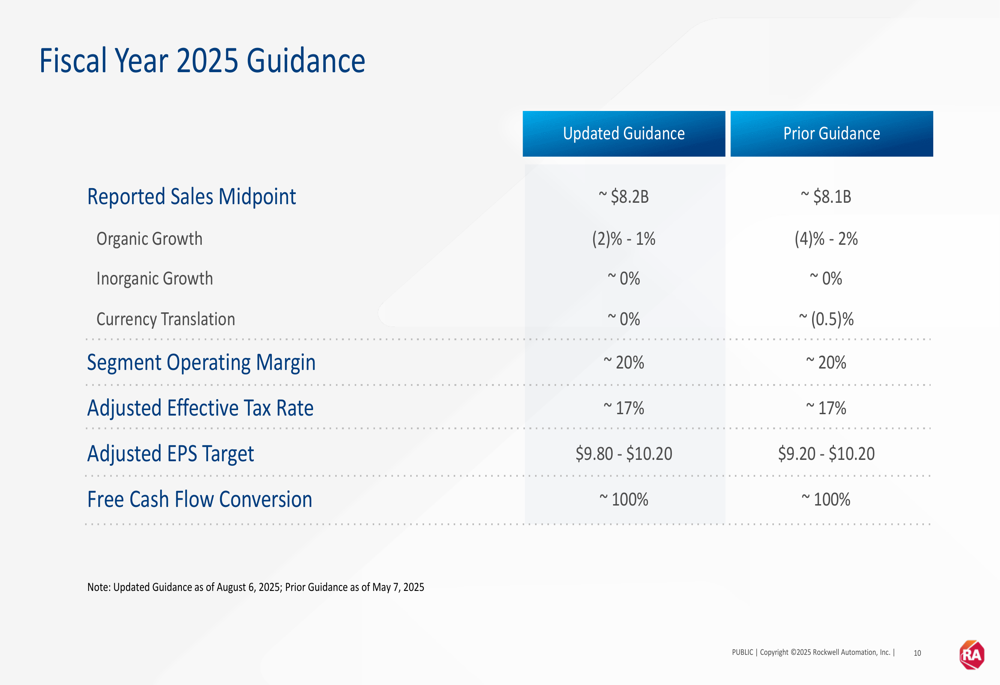
Based on its strong execution, Rockwell Automation raised its full-year adjusted EPS guidance to a range of $9.80 to $10.20, up from the previous range of $9.20 to $10.20. The company updated its reported and organic sales growth expectations to a range of -2% to 1% year-over-year, an improvement from the prior guidance of -4% to 2%.
The company continues to expect segment operating margin of approximately 20% for the full year, including over $250 million in benefits from cost reduction and margin expansion actions. Free cash flow conversion is anticipated to remain at approximately 100%.
The updated guidance compared to prior guidance is illustrated in this table:
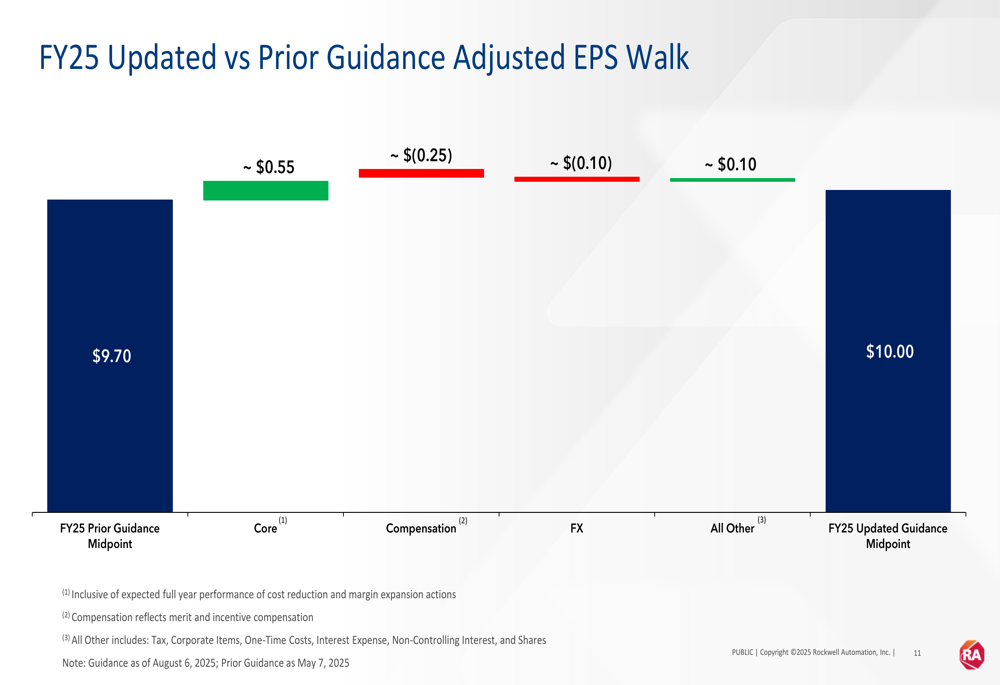
The factors contributing to the raised EPS guidance are clearly shown in the following adjusted EPS walk:
Financial Analysis
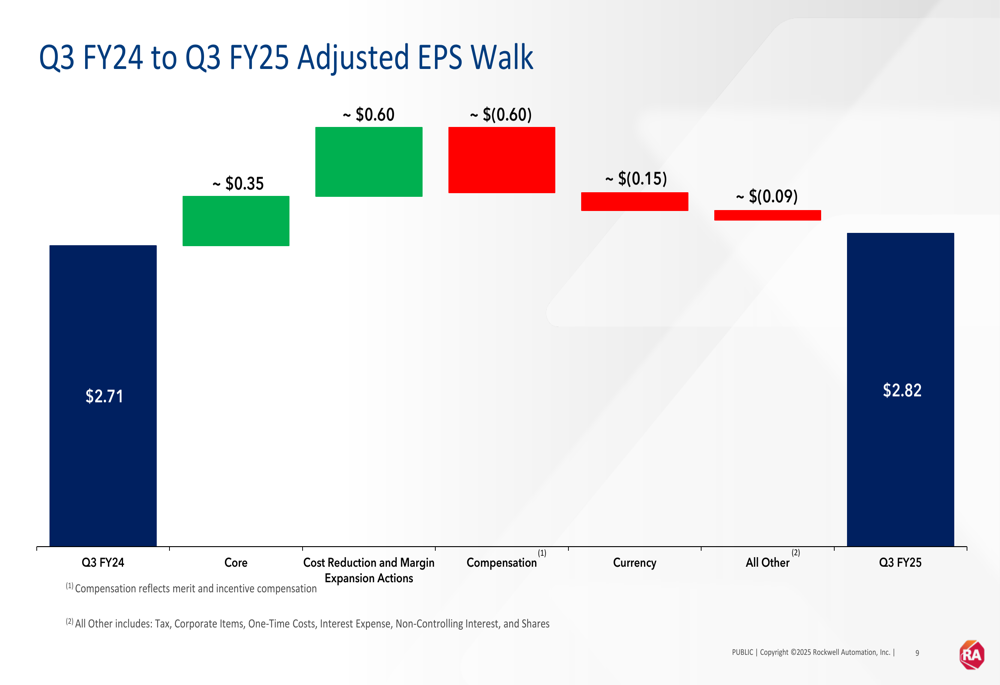
Rockwell Automation’s adjusted EPS of $2.82 for Q3 FY25 represents a 4% increase from $2.71 in Q3 FY24. This improvement was driven by core operational performance and cost reduction initiatives, which contributed approximately $0.35 and $0.60 per share, respectively. These gains were partially offset by higher compensation costs (-$0.60), unfavorable currency impact (-$0.15), and other factors (-$0.09).
The components driving the year-over-year EPS change are visualized in this chart:
Free cash flow generation was particularly strong at $489 million for the quarter, representing a 153% conversion rate of net income to free cash flow. This significant improvement from $238 million in the same period last year demonstrates the company’s enhanced operational efficiency and working capital management.
The company’s balance sheet remains solid, allowing it to continue investing in growth initiatives while returning value to shareholders. Rockwell’s focus on productivity and margin expansion appears to be yielding results, as evidenced by the achievement of productivity targets ahead of schedule.
Despite facing headwinds in certain regions and industry segments, Rockwell Automation’s overall performance in Q3 FY25 demonstrates resilience and effective execution of its strategic initiatives. The raised guidance suggests management’s confidence in maintaining this momentum through the remainder of the fiscal year.
Full presentation:
This article was generated with the support of AI and reviewed by an editor. For more information see our T&C.