Gold prices dip as December rate cut bets wane; economic data in focus

Introduction & Market Context
SCOR SE (EPA:SCR) presented its second quarter 2025 results on July 31, showing strong performance across all business segments. The French reinsurance giant reported a net income of €226 million and a return on equity of 22.6%, demonstrating the effectiveness of its strategic initiatives under the Forward 2026 plan. The company’s shares have been trading near their 52-week high of €27.52, reflecting investor confidence in SCOR’s business model and growth trajectory.
The results come amid a challenging global environment characterized by climate change concerns, geopolitical uncertainties, and ongoing digital transformation in the insurance industry. Despite these challenges, SCOR has maintained a disciplined approach to underwriting and investment management, allowing it to deliver solid results.
Quarterly Performance Highlights
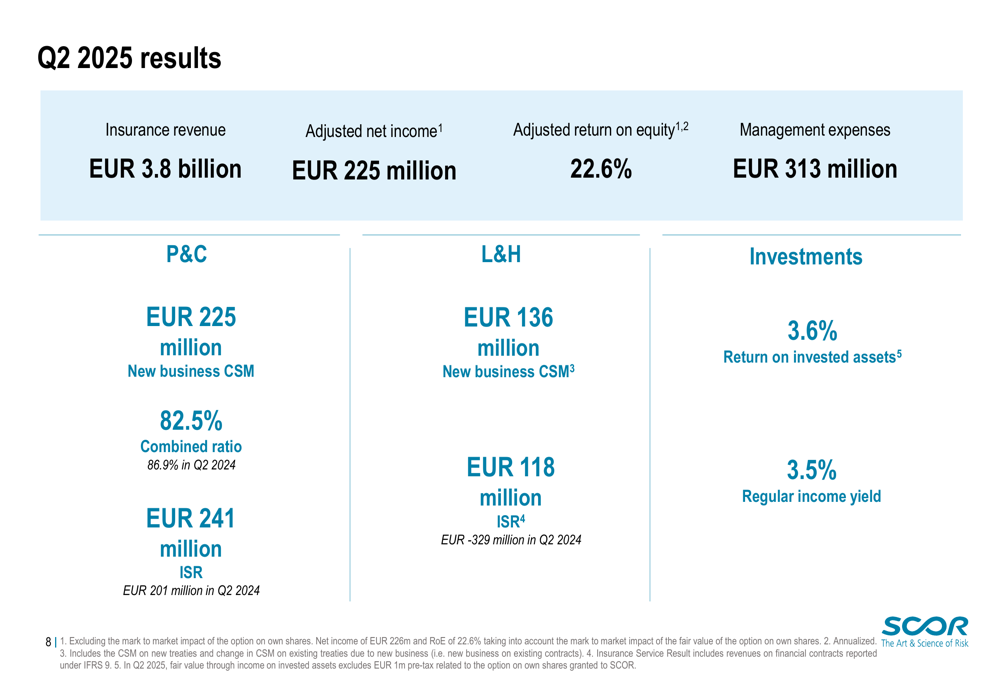
SCOR’s Q2 2025 performance showed strength across all three business activities, with each segment contributing positively to the overall results. The company achieved an adjusted net income of €225 million and an adjusted return on equity of 22.6% for the quarter.
As shown in the following key performance indicators chart, the company maintained a strong solvency position while delivering solid returns:
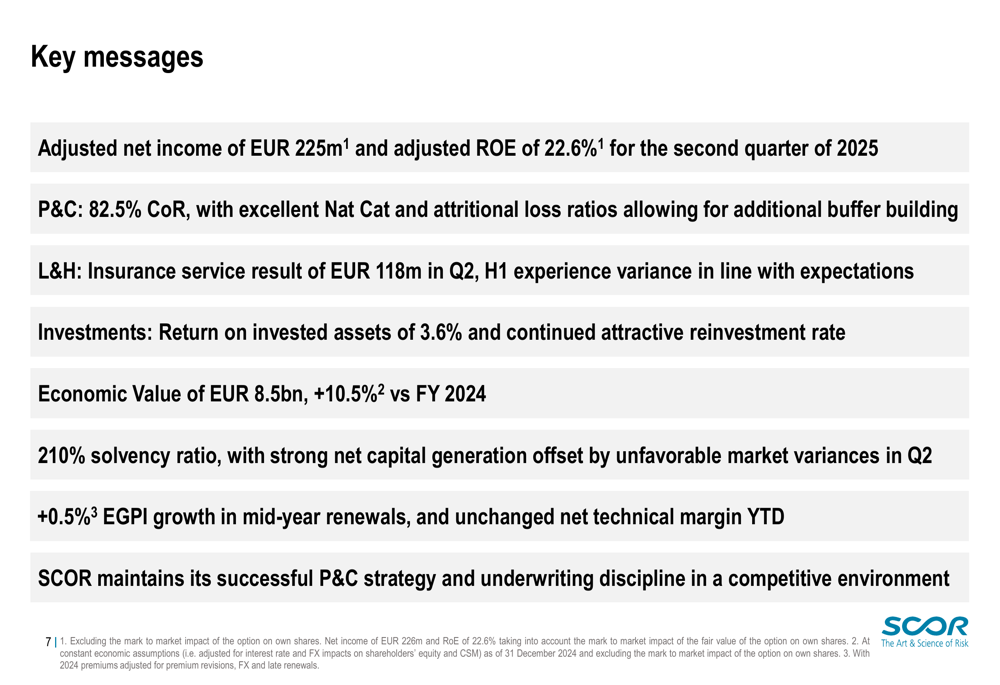
The P&C (Property & Casualty) segment delivered an exceptional combined ratio of 82.5%, reflecting excellent natural catastrophe and attritional loss ratios. The L&H (Life & Health) segment contributed an insurance service result of €118 million, while the investment portfolio generated a return on invested assets of 3.6%.
The following chart provides a comprehensive breakdown of Q2 2025 results across all business segments:
Thierry Leger, Group CEO, expressed satisfaction with the company’s performance, stating, "We are very satisfied with the level and quality of our results over the first six months of 2025," as noted in the earnings call.
Detailed Financial Analysis
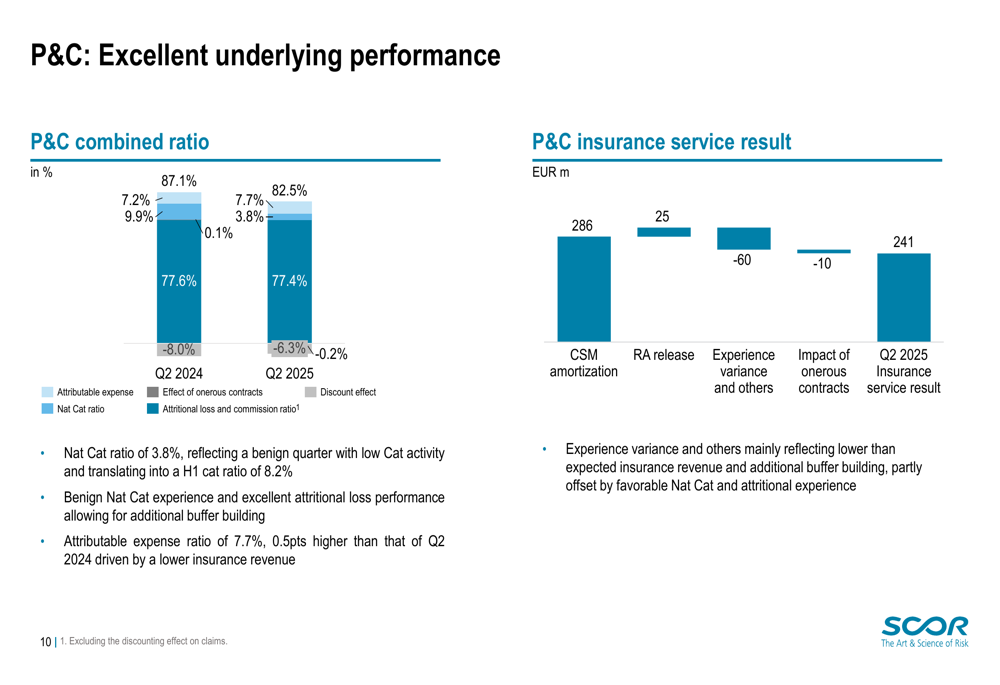
SCOR’s P&C segment demonstrated excellent underlying performance with a combined ratio of 82.5%, significantly better than the Forward 2026 assumption of <87%. This performance was driven by disciplined underwriting and favorable loss experience.
The following chart illustrates the components of the P&C combined ratio:
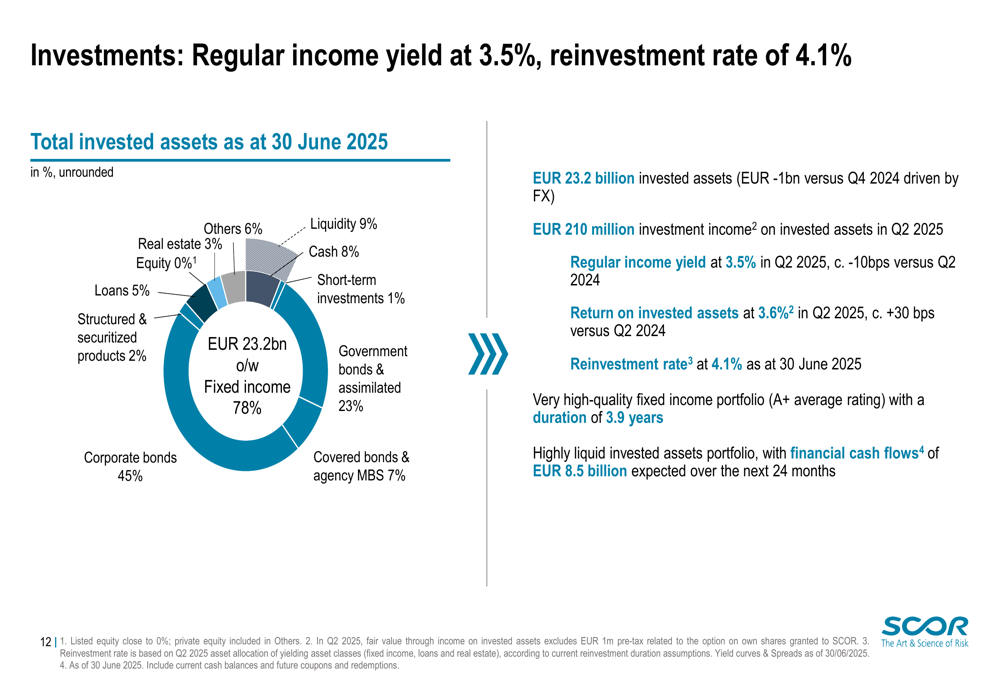
In the investment portfolio, SCOR maintained a regular income yield of 3.5% with a reinvestment rate of 4.1%. The company’s investment allocation remains conservative, with a focus on high-quality fixed income securities that have an average rating of A+.
The investment portfolio allocation as of June 30, 2025 is detailed in the following chart:
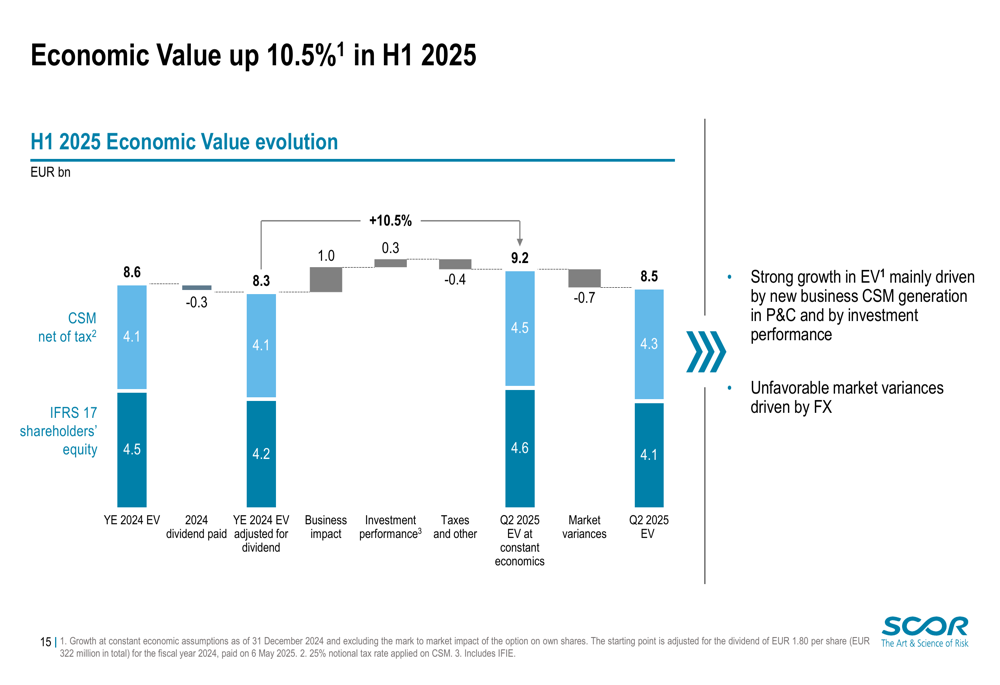
SCOR’s economic value increased by 10.5% in H1 2025 at constant economics, reaching €8.5 billion. This growth was primarily driven by new business CSM generation in P&C and strong investment performance, although partially offset by unfavorable foreign exchange impacts.
The evolution of economic value is illustrated in this waterfall chart:
Deputy CEO and CFO Francois Varane highlighted the company’s strong solvency position during the earnings call, noting, "Our solvency ratio remained very strong at 210 in the upper part of our optimal range."
Strategic Initiatives
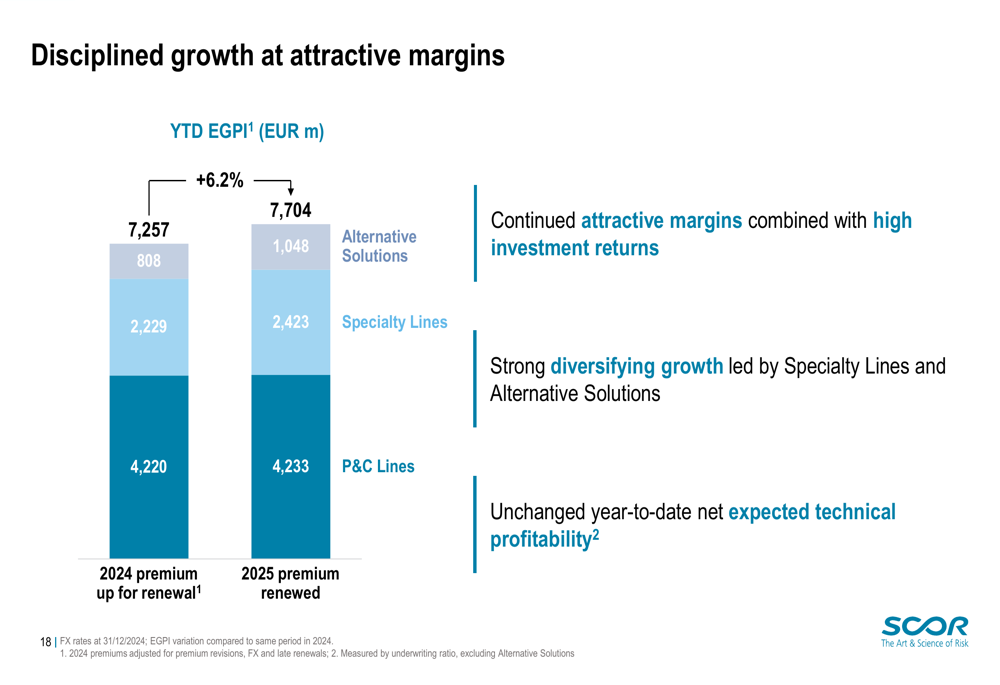
SCOR continues to execute its Forward 2026 strategic plan, focusing on disciplined growth in preferred lines while reducing exposure to less profitable segments. The company reported a 6.2% growth in year-to-date EGPI (Estimated Gross Premium Income) to €7,704 million, with strong performance in P&C Lines and Specialty Lines.
The following chart shows the breakdown of SCOR’s YTD EGPI growth:
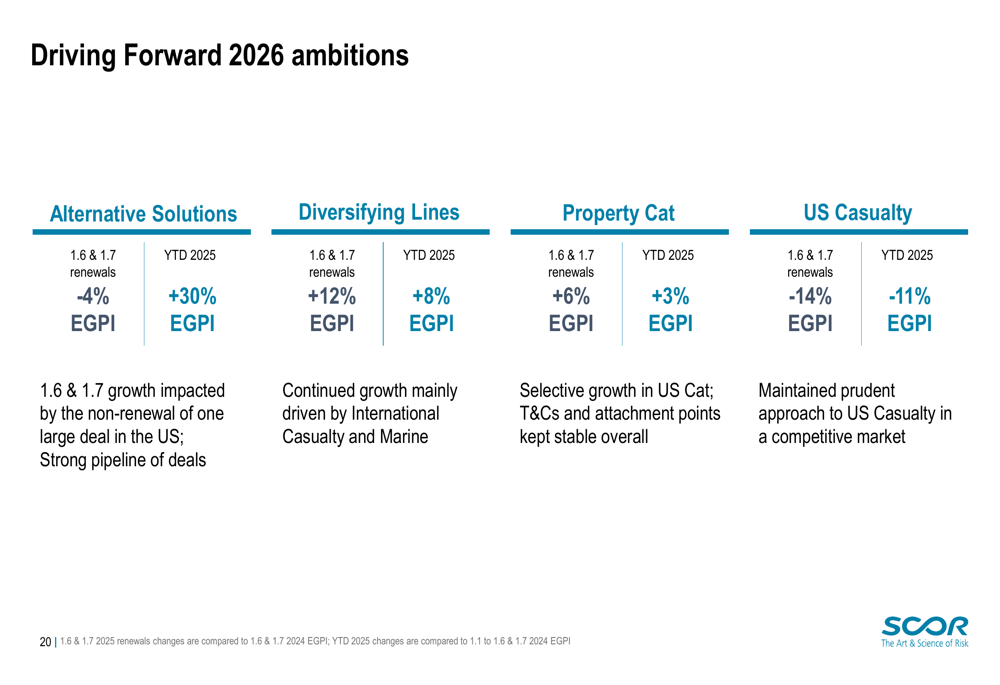
The company is successfully navigating a competitive market environment, maintaining stable pricing with an average rate change of +0.1% on renewed portfolios. SCOR’s strategic focus on preferred lines is evident in its renewal patterns, with significant growth in Alternative Solutions (+30%) and Diversifying Lines (+8%), while reducing exposure to US Casualty (-11%).
As shown in the following chart, SCOR is strategically positioning its portfolio to align with its Forward 2026 ambitions:
Forward-Looking Statements
Looking ahead, SCOR remains committed to its Forward 2026 plan, which targets 4-6% growth. The company anticipates stable P&C revenue for 2025 and expects the Solvency II review to positively impact its solvency ratio by 10-15 points.
The strategic focus on selective growth in preferred lines like Alternative Solutions and Marine is expected to drive future performance. SCOR’s disciplined approach to capital management and underwriting should continue to support strong returns, although the company remains vigilant about potential challenges from climate change, geopolitical uncertainties, and market volatility.
With a current dividend yield of 3.26% and a P/E ratio of 12.36, SCOR presents a balanced profile of growth potential and income generation. The company’s strong financial position, with a solvency ratio of 210% and liquidity of €2.4 billion, provides a solid foundation for navigating future market conditions while pursuing strategic growth opportunities.
Full presentation:
This article was generated with the support of AI and reviewed by an editor. For more information see our T&C.