Bitcoin price today: dips below $112k, near 6-wk low despite Fed cut bets

Introduction & Market Context
SCOR SE (EPA:SCR) released its Q2 2025 financial results on July 31, 2025, reporting an adjusted net income of €225 million and an adjusted return on equity (ROE) of 22.6%. The results demonstrate continued strong performance across all business segments, building on the positive momentum from Q1 2025 when the company reported a net income of €195 million.
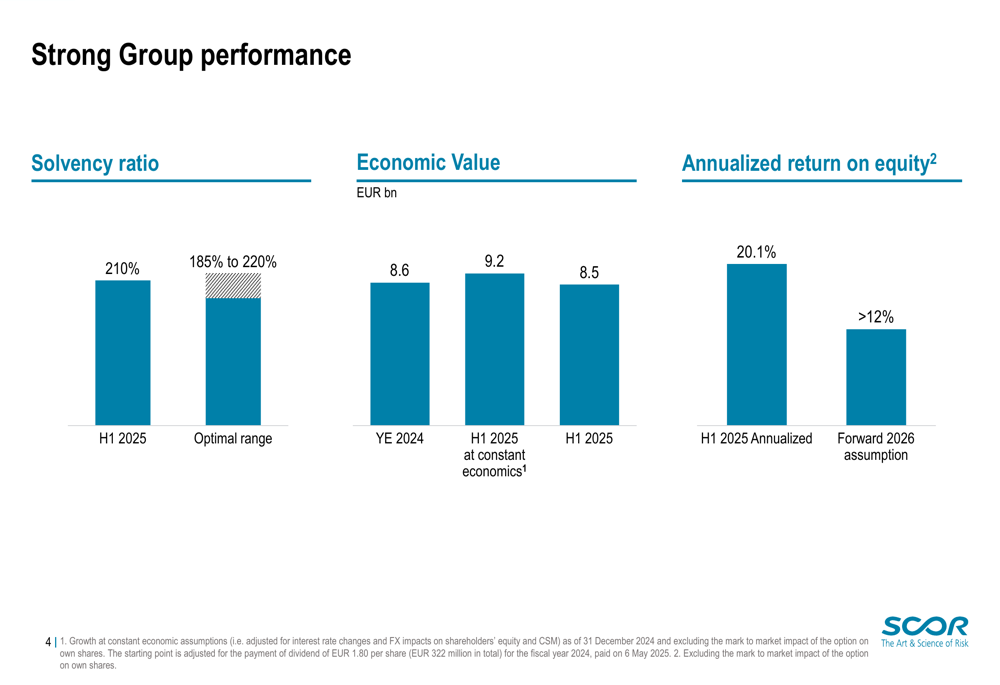
The global reinsurer maintained its disciplined approach in a competitive market environment, focusing on strategic growth in preferred lines while maintaining underwriting discipline. SCOR’s solvency ratio stood at 210% at the end of Q2, slightly down from 212% in Q1 but still positioned in the upper part of the company’s optimal range of 185%-220%.
Quarterly Performance Highlights
SCOR’s Q2 2025 results show strong performance across all three business activities, with an insurance revenue of €3.8 billion and management expenses of €313 million.
As shown in the following summary of key Q2 2025 results:
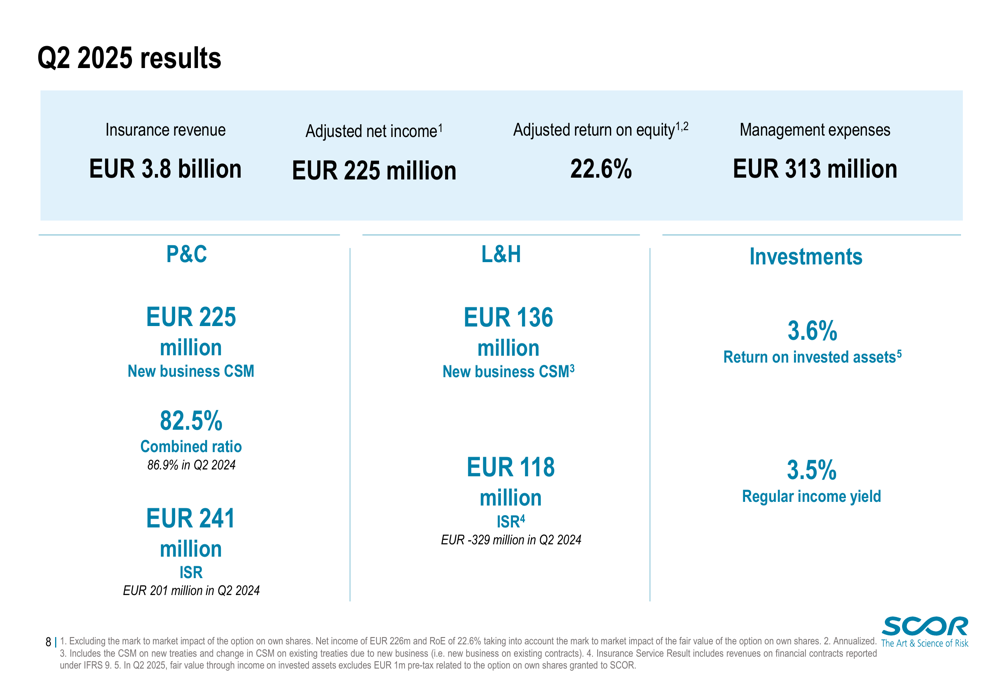
The Property & Casualty (P&C) segment delivered a combined ratio of 82.5%, improving from 86.9% in Q2 2024, with an insurance service result (ISR) of €241 million. The Life & Health (L&H) segment achieved an ISR of €118 million, a significant improvement from the €-329 million reported in Q2 2024. The investment portfolio generated a return on invested assets of 3.6% and a regular income yield of 3.5%.
For the first half of 2025, SCOR reported an adjusted net income of €420 million and an annualized ROE of 20.1%, exceeding its Forward 2026 assumption of >12%.
The following chart illustrates SCOR’s strong group performance metrics:
Detailed Financial Analysis
P&C Segment Performance
SCOR’s P&C segment demonstrated excellent underlying performance in Q2 2025, benefiting from a benign natural catastrophe environment with a Nat Cat ratio of just 3.8%. This contributed to a combined ratio of 82.5%, significantly better than the Forward 2026 assumption of <87%.
The P&C business generated a new business Contractual Service Margin (CSM) of €225 million in Q2 2025, with H1 2025 new business CSM reaching €935 million. This reflects SCOR’s successful strategy to grow in profitable and diversifying lines of business.
As shown in the following chart detailing P&C strategic growth:
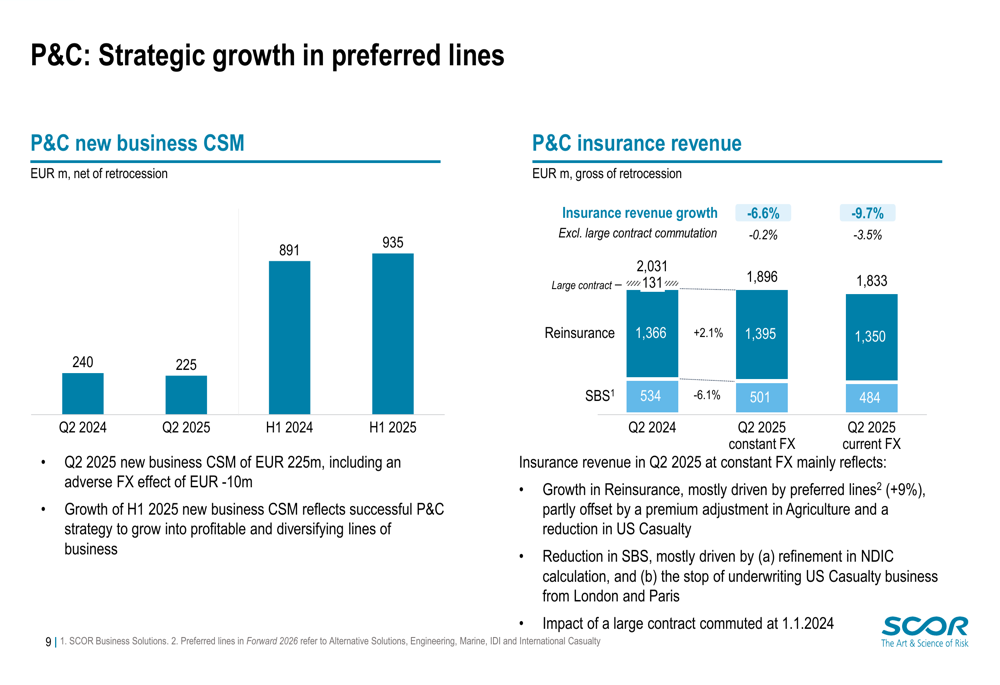
The company maintained its focus on preferred lines, which grew by 9% in the reinsurance segment, while overall insurance revenue declined by 6.6% (or -0.2% excluding a large contract commutation).
L&H Segment Performance
The L&H segment reported a strong improvement with an insurance service result of €118 million in Q2 2025, compared to €-329 million in Q2 2024. New business CSM reached €136 million in the quarter, primarily driven by the Protection business.
For the first half of 2025, the L&H insurance service result totaled €236 million, in line with the Forward 2026 assumption of approximately €0.4 billion per annum. The H1 annualized CSM amortization rate stood at 6.9%, excluding one-offs and FX impacts, with experience variances in line with expectations.
Investment Performance
SCOR’s investment portfolio delivered solid results with a return on invested assets of 3.6% in Q2 2025, approximately 30 basis points higher than Q2 2024. The regular income yield stood at 3.5%, slightly lower (-10 basis points) compared to the same period last year.
The following chart shows SCOR’s investment allocation as of June 30, 2025:
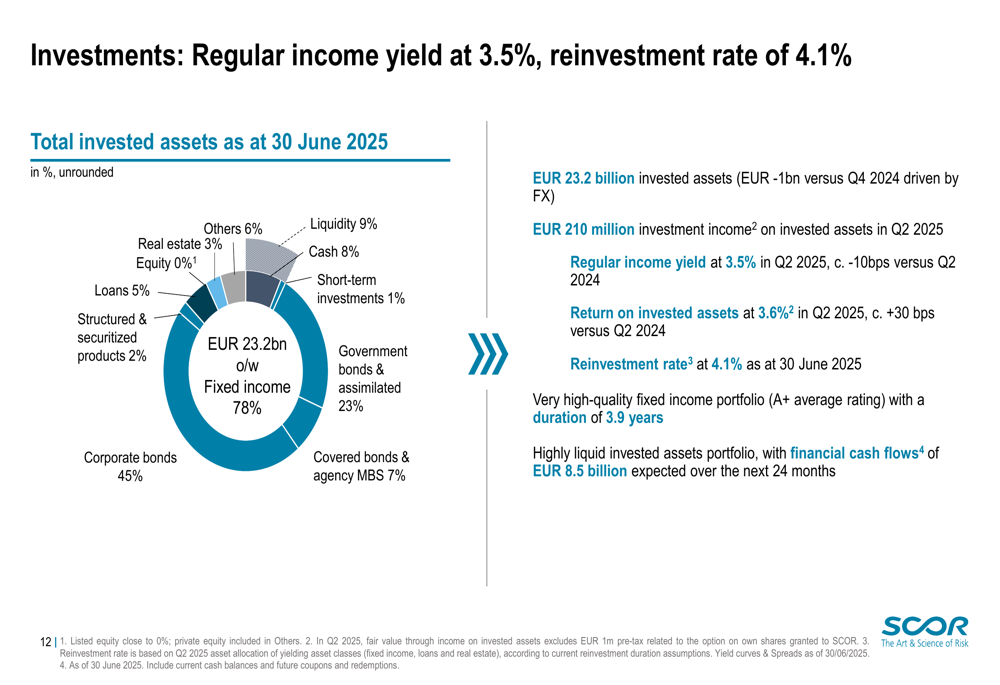
Total (EPA:TTEF) invested assets amounted to €23.2 billion, with a high-quality fixed income portfolio (A+ average rating) and a duration of 3.9 years. The reinvestment rate remained attractive at 4.1%, supporting future investment income. The portfolio maintained high liquidity with expected financial cash flows of €8.5 billion over the next 24 months.
Economic Value & Solvency
SCOR’s economic value increased by 10.5% in the first half of 2025 to reach €8.5 billion, translating to €47 per share as of June 30, 2025. This growth was primarily driven by new business CSM generation in P&C and investment performance, partially offset by unfavorable market variances mainly related to foreign exchange movements.
The following chart illustrates the evolution of SCOR’s economic value in H1 2025:
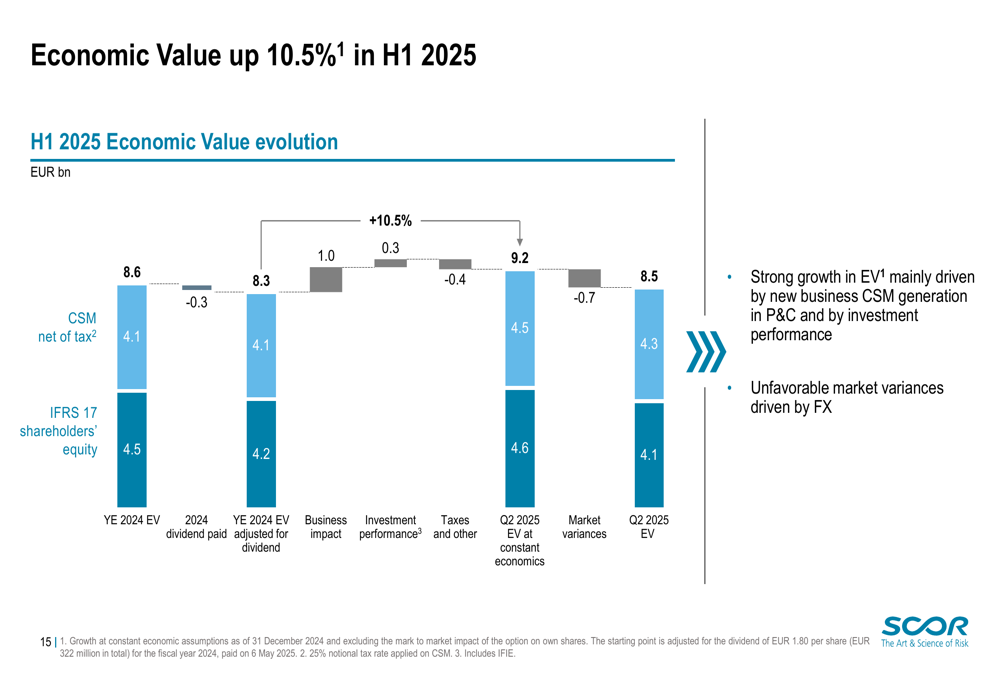
The company’s solvency ratio remained strong at 210%, positioned in the upper part of the optimal range (185%-220%). This reflects strong underlying capital generation, offset by unfavorable market variances notably driven by foreign exchange movements.
Strategic Initiatives & Renewals
In the June/July 2025 P&C renewals, SCOR demonstrated disciplined growth with a 0.5% increase in Estimated Gross Premium Income (EGPI) while maintaining unchanged net expected technical profitability. The company continued to focus on diversifying growth led by Specialty Lines and Alternative Solutions.
As shown in the following chart of renewal performance:
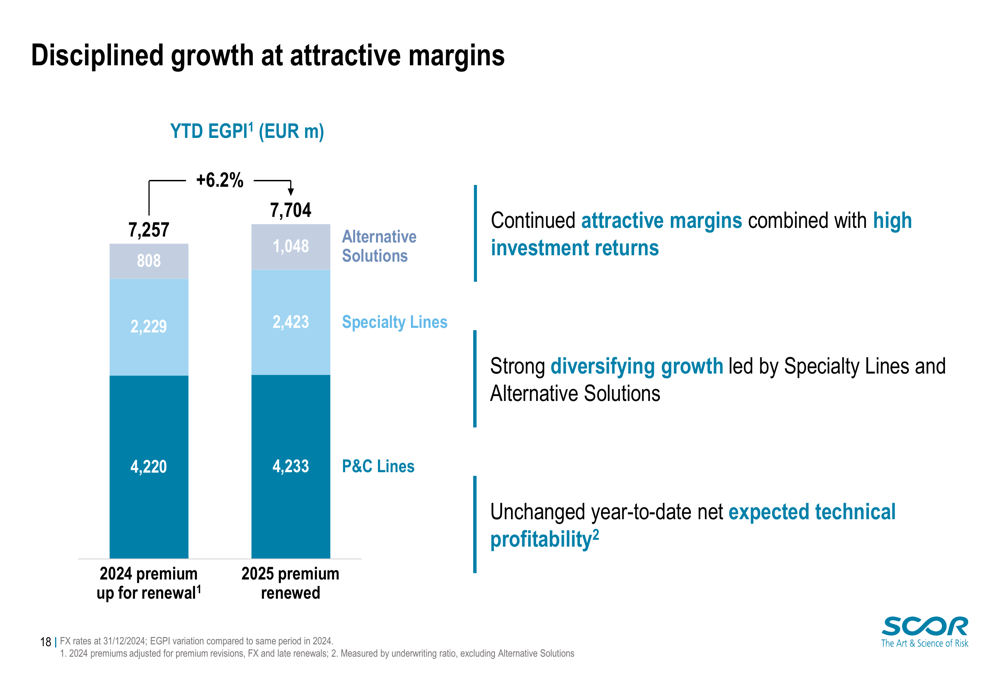
SCOR successfully navigated a competitive environment with a slight decline in pricing (-0.2% for June/July renewals) while maintaining its strategic focus on preferred lines. The company continued to reduce its exposure to US Casualty (-14% YTD) while growing in diversifying lines (+12% YTD) and Property Cat (+6% YTD).
Forward-Looking Statements
SCOR remains committed to its Forward 2026 strategic plan, targeting an annualized ROE of over 12%. The company expects to maintain its P&C combined ratio below 87% and achieve an L&H insurance service result of approximately €0.4 billion per annum.
In the investment portfolio, SCOR anticipates a regular income yield between 3.3% and 3.7% for 2025, in line with the 3.5% achieved in the first half of the year.
The company will continue its disciplined growth strategy in preferred lines while maintaining underwriting discipline in a competitive market environment. With a solvency ratio of 210% and strong liquidity position, SCOR is well-positioned to navigate market challenges and pursue profitable growth opportunities.
Full presentation:
This article was generated with the support of AI and reviewed by an editor. For more information see our T&C.